Market Overview
| Study Period | 2021 - 2031 |
|---|---|
| Forecast Data Period | 2026 - 2031 |
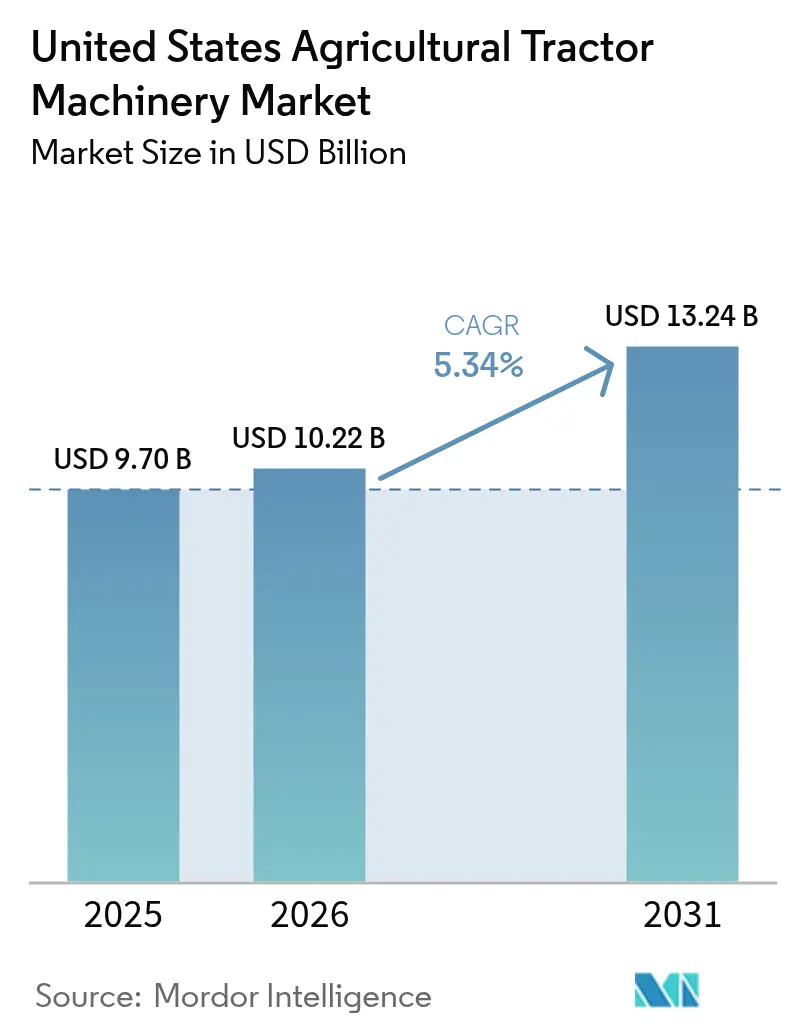
| Base Year Market Size (2025) | USD 9.7 Billion |
| Market Size (2026) | USD 10.22 Billion |
| Market Size (2031) | USD 13.24 Billion |
| Growth Rate (2026 - 2031) | 5.34% CAGR |
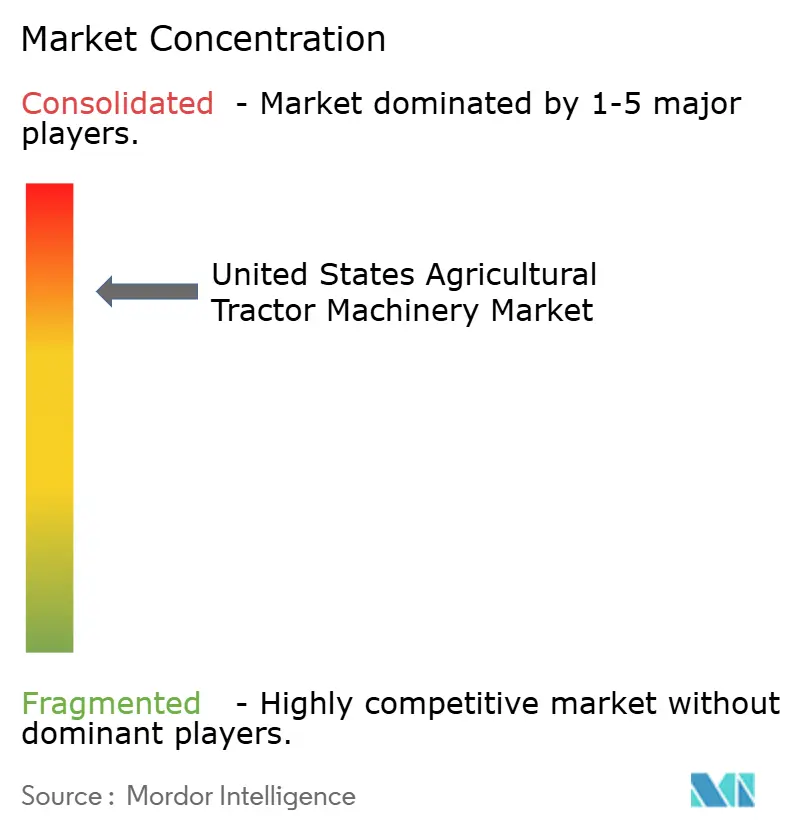
| Market Concentration | High |
Major Players *Disclaimer: Major Players sorted in no particular order Image © Mordor Intelligence. Reuse requires attribution under CC BY 4.0. | |
United States Agricultural Tractor Machinery Market Analysis by Mordor Intelligence
The United States agricultural tractor machinery market size was valued at USD 9.7 billion in 2025 and estimated to grow from USD 10.22 billion in 2026 to reach USD 13.24 billion by 2031, at a CAGR of 5.34% during the forecast period (2026-2031). The rising adoption of precision systems, the growing availability of electric attachments, and persistent labor cost inflation are driving a multi-year replacement cycle that extends beyond the usual fluctuations in farm income. Large farms are standardizing on sensor-rich implements that feed data into cloud software, which tightens brand lock-in and lifts aftermarket sales. Smaller specialty-crop operations are pivoting toward battery-electric units to comply with state emissions targets, while drought rules in the West are pushing investments in variable-rate irrigation-linked implements. At the same time, domestic sourcing prompted by Section 232 tariffs is reshaping supply chains and nudging prices upward. These cross-currents are fostering new dealer subscription models that spread capital outlays across seasons and convert sporadic equipment purchases into predictable service revenue.
Key Report Takeaways
- By product type, planting maching captured 30.62% of the United States agricultural tractor machinery market size in 2025, and sprayers are projected to expand at an 7.52% CAGR through 2031.
Note: Market size and forecast figures in this report are generated using Mordor Intelligence’s proprietary estimation framework, updated with the latest available data and insights as of 2026.
United States Agricultural Tractor Machinery Market Trends and Insights
Drivers Impact Analysis*
| Driver | (~) % Impact on CAGR Forecast | Geographic Relevance | Impact Timeline |
|---|---|---|---|
| Increase in Adoption of Precision Agriculture | +1.20% | Midwest, West, and Southeast | Medium term (2-4 years) |
| Rising in Electrification Incentives | +0.80% | West, Northeast, and Midwest | Long term (≥ 4 years) |
| Labor Cost Inflation on Large Farms | +1.00% | Midwest, West, and Southwest | Short term (≤ 2 years) |
| High Adoption of Dealer-Led Subscription Models | +0.60% | National, and early gains in Midwest | Medium term (2-4 years) |
| Section 232 Tariff-Driven Localization | +0.40% | National | Short term (≤ 2 years) |
| Carbon-Credit Revenue for Low-Emission Equipment | +0.30% | Iowa and Illinois are in the Midwest, and California is in West | Long term (≥ 4 years) |
| Source: Mordor Intelligence | |||
Increase in Adoption of Precision Agriculture
Global Positioning System (GPS) guidance, variable-rate controllers, and section-control nozzles have become standard practices on farms exceeding 1,500 acres. In 2024, 75% of Midwest corn and soybean acres were planted using GPS-guided technology, up from 62% in 2020 [1]Source: USDA Economic Research Service, “Farm Production Expenditures,” ers.usda.gov. Farmers rely on automation because labor shortages make manual in-field adjustments unworkable. Telematics now feeds data to cloud platforms, which raises switching costs, so the competitive edge is tied to software interoperability rather than horsepower. As older implements reach the end of their life, upgrades automatically embed sensors and connectivity, increasing the technology content per unit in the United States agricultural tractor machinery market.
Rising in Electrification Incentives
Federal tax credits that cover up to 30% of electric or hybrid equipment cost and California rules that phase out small diesel engines are stimulating demand for lower-horsepower battery units [2]Source: U.S. Department of Energy, “Inflation Reduction Act Clean Energy Credits,” energy.gov. Monarch Tractor shipped more than 200 electric tractors with paired implements to California growers in 2024, marking a significant milestone in the commercial viability of the technology. Electric drives are not displacing the high-horsepower row-crop segment but are carving out a parallel lane for specialty farms under 500 acres. This bifurcation widens the product palette inside the United States agricultural tractor machinery market.
Labor Cost Inflation on Large Farms
Average hourly wages for equipment operators rose 12% between 2022 and 2024 [3]Source: U.S. Bureau of Labor Statistics, “Occupational Employment and Wage Statistics,” bls.gov. The jump has tightened margins on farms above 3,000 acres, which now install autonomous-ready implements that lower labor hours per acre by up to 30%. Deere & Company's exactShot planter uses robotics to place fertilizer precisely at the seed and delivers payback in under three years on large row-crop farms. Elevated wages are therefore accelerating the shift toward autonomy and data-enabled implements across the United States' agricultural tractor machinery market.
High Adoption of Dealer-Led Subscription Models
Deere & Company and CNH Industrial N.V. dealers are bundling tractor-mounted machinery, telematics, agronomic support, and seasonal equipment swaps into monthly subscription plans designed for the United States farms of about 800–1,500 acres. These models lower upfront costs for buyers facing higher interest rates, while providing dealers with more stable revenue. The continuous data generated through these bundled contracts also helps refine equipment design and keeps growers tied to the OEM (Original Equipment Manufacturers) ecosystem within the United States agricultural tractor machinery market.
Restraint Impact Analysis*
| Restraint | (~) % Impact on CAGR Forecast | Geographic Relevance | Impact Timeline |
|---|---|---|---|
| High Equipment Capital Expenditure | -0.90% | National, acute in Southeast and Northeast | Short term (≤ 2 years) |
| Commodity-Price Volatility | -0.70% | Midwest, Southwest, and Southeast | Short term (≤ 2 years) |
| Advanced-Technology Maintenance Skill Gap | -0.50% | National, and severe in rural areas | Medium term (2-4 years) |
| Steel and Aluminum Tariff Cost Pass-Through | -0.40% | National | Short term (≤ 2 years) |
| Source: Mordor Intelligence | |||
Advanced-Technology Maintenance Skill Gap
In 2024, 68% of equipment dealers reported technician shortages, with average hiring times exceeding 120 days for advanced-technology roles. Persistent rural broadband gaps affecting nearly 30% of the United States' farmland further limit the effectiveness of remote diagnostics, reducing the uptime benefits of precision tractor implements. As a result, OEMs (Original Equipment Manufacturers) with dense, well-resourced service networks gain a clear competitive edge, while smaller or newer market entrants struggle to maintain adequate support coverage across dispersed farming regions.
Steel and Aluminum Tariff Cost Pass-Through
In 2024, rising tariffs added an estimated USD 1,200 to USD 1,800 to the production cost of a typical 16-row planter, driving notable price pressure across tractor-powered machinery. Large OEMs (Original Equipment Manufacturers) partially absorbed these increases by localizing fabrication and leveraging scale in procurement, while short-line manufacturers faced sharper margin compression and reduced pricing flexibility. This cost imbalance is accelerating consolidation trends and reinforcing the dominance of major players within the United States agricultural tractor machinery market.
*Our forecasts treat driver/restraint impacts as directional, not additive. The impact forecasts reflect baseline growth, mix effects, and variable interactions.
Segment Analysis
By Product Type: Planters Lead, Sprayers Accelerate
Planting machinery retained its position as the largest segment at 30.62% of the United States agricultural tractor machinery market size in 2025. Variable-rate seeding is nearing saturation on farms above 1,500 acres, making real-time seed spacing and downforce control standard rather than premium features. This normalization of precision technology has compressed hardware price spreads, pushing competition toward value-added services such as agronomic advice, data analytics, and integration with farm-management platforms. Farmers now prioritize not only the quality of seeding equipment but also software compatibility, dealer calibration support, and actionable insights that optimize yields and input efficiency, reinforcing the strategic importance of planting machinery in the United States agricultural tractor machinery market.
Sprayers are the fastest-growing segment with a projected 7.52% CAGR through 2031. Section-control nozzles and pulse-width-modulation systems have become standard for farms over 2,000 acres, turning precision application from an optional upgrade into an operational necessity. Pull-type boom designs are gradually giving way to self-propelled sprayers with integrated GPS and variable-rate controllers. Midwest row-crop growers justify the USD 300,000 to USD 500,000 premium through labor savings, reduced chemical overlap, and improved environmental compliance. Because these machines feed data directly into farm-management software, manufacturers with strong software ecosystems and dealer calibration support gain a significant competitive edge, highlighting the growing role of smart sprayer technologies in the United States agricultural tractor machinery market.


Geography Analysis
The Midwest generates the largest portion of revenue. Average farms in Iowa, Illinois, Indiana, and Nebraska invest around USD 1.5 million over five years and increasingly choose sensor-rich implements that feed data to farm-management software. Growth is moderate, as technology penetration is already high, yet each unit continues to include more advanced features. Labor pressures are driving wider adoption of autonomous-ready planters and sprayers.
The West is expanding rapidly. California specialty-crop farms utilize electric implements and variable-rate irrigation tools to comply with emissions and groundwater regulations. Monarch Tractor gains traction in vineyards and orchards with battery units, while large wheat and potato farms in Idaho and Washington largely remain diesel-oriented. This creates two distinct sub-markets within the region.
The Southeast is recovering with stable cotton and peanut prices. Sand-friendly planters and cultivators are seeing increasing demand, and conservation tillage is gaining support. The Southwest, supported by Texas dairy clusters, benefits from forage equipment upgrades that improve operations in confined animal setups. The Northeast remains the smallest market but shows niche adoption of compact electric cultivators on organic vegetable farms. These regional differences highlight the importance of configurable product families in the United States agricultural tractor machinery market.
Competitive Landscape
The United States agricultural tractor machinery market is dominated by Deere & Company, CNH Industrial N.V., and AGCO Corporation, which together hold the majority of industry revenue. Deere & Company leverages an integrated hardware-software ecosystem that creates customer stickiness through data lock-in, precision connectivity, and same-day parts service. CNH Industrial N.V. positions its Case IH and New Holland brands as flexible alternatives for diverse farm operations, strengthening its capabilities through partnerships, such as the collaboration with Raven Industries for autonomous guidance systems. AGCO Corporation differentiates its offerings with European-engineered precision under the Fendt and Massey Ferguson brands, emphasizing fuel efficiency and high-performance features tailored for large-scale farming.
Beyond the leading players, mid-tier manufacturers such as Kubota Corporation and Mahindra&Mahindra Ltd. are expanding their presence in the sub-100-horsepower segment, catering to specialty crop farms and livestock operations that require highly maneuverable equipment. This segment has also attracted emerging robotics and electric-vehicle firms, including Monarch Tractor, Blue White Robotics, and Autonomous Solutions Inc., which are piloting driverless attachments and battery-powered units. These innovators are targeting “white-space” opportunities in precision farming, creating pressure on traditional OEMs (Original Equipment Manufacturers) to maintain relevance.
Legacy manufacturers are actively defending their market positions through strategic acquisitions and tightened software controls. Deere & Company's 2024 acquisition of a machine-vision startup and CNH Industrial N.V.'s 2025 partnership with Raven Industries underscore this approach. However, evolving regulatory environments, such as right-to-repair legislation in Colorado and New York, could force OEMs to open their platforms, weakening traditional competitive moats and encouraging a more modular and interoperable landscape. These dynamics are reshaping the competitive framework and innovation pathways within the United States agricultural tractor machinery market.
United States Agricultural Tractor Machinery Industry Leaders
CNH Industrial N.V.
AGCO Corporation
Kubota Corporation
Mahindra&Mahindra Ltd.
Deere & Company
- *Disclaimer: Major Players sorted in no particular order

Recent Industry Developments
- March 2025: Case IH launched SenseApply, a tractor‑mounted sprayer and applicator system using multi‑spectral cameras for spot‑spraying and variable‑rate applications. The technology reduces herbicide use by up to 60%, operates without subscriptions or per‑acre fees, and enhances efficiency and sustainability of United States tractor‑mounted crop protection machinery.
- July 2024: The United States Agricultural Research Service launched a collaborative research project to automate weed management by linking camera-sensing technology with precision herbicide sprayers on tractor-mounted systems. The project develops AI-based weed detection models and tests efficacy on both robotic and tractor-mounted sprayer platforms through July 2026.
- February 2024: Deere & Company expanded the availability of See & Spray Premium technology to model-year 2025 Hagie STS pull-type sprayers, enabling existing tractor-pulled sprayer owners to retrofit their machines with AI-powered, targeted spray nozzles. The system achieves over 50% post-herbicide use reduction by scanning 2,100 square feet per second with boom-mounted cameras.


United States Agricultural Tractor Machinery Market Report Scope
By Product Type
| Plowing and Cultivating Machinery | Plows |
| Harrows | |
| Rotovators and Cultivators | |
| Other Plowing and Cultivating Machinery | |
| Planting Machinery | Seed Drills |
| Planters | |
| Spreaders | |
| Other Planting Machinery | |
| Sprayers | |
| Haying and Forage Machinery | Mowers and Conditioners |
| Balers | |
| Other Haying and Forage Machinery | |
| Other Types |
| By Product Type | Plowing and Cultivating Machinery | Plows |
| Harrows | ||
| Rotovators and Cultivators | ||
| Other Plowing and Cultivating Machinery | ||
| Planting Machinery | Seed Drills | |
| Planters | ||
| Spreaders | ||
| Other Planting Machinery | ||
| Sprayers | ||
| Haying and Forage Machinery | Mowers and Conditioners | |
| Balers | ||
| Other Haying and Forage Machinery | ||
| Other Types | ||


Key Questions Answered in the Report
How large is the United States agricultural tractor machinery market in 2026?
The market is valued at USD 10.22 billion in 2026 and is set to reach USD 13.24 billion by 2031.
Which product category leads current equipment demand?
Planting machinery hold the top position, accounting for 30.62% of product-type revenue in 2025.
What technology trend is most rapidly influencing buying decisions?
Precision agriculture systems that include GPS guidance and variable-rate controls are now standard on large farms and drive much of the upgrade cycle.
Why are electric tractors gaining attention?
Federal tax credits and state diesel phase-out rules cut purchase cost for small electric units, making them attractive to specialty-crop operations in states such as California.
Page last updated on:


