United States Homeowners Insurance Market Size and Share
Market Overview
| Study Period | 2020 - 2031 |
|---|---|
| Forecast Data Period | 2026 - 2031 |
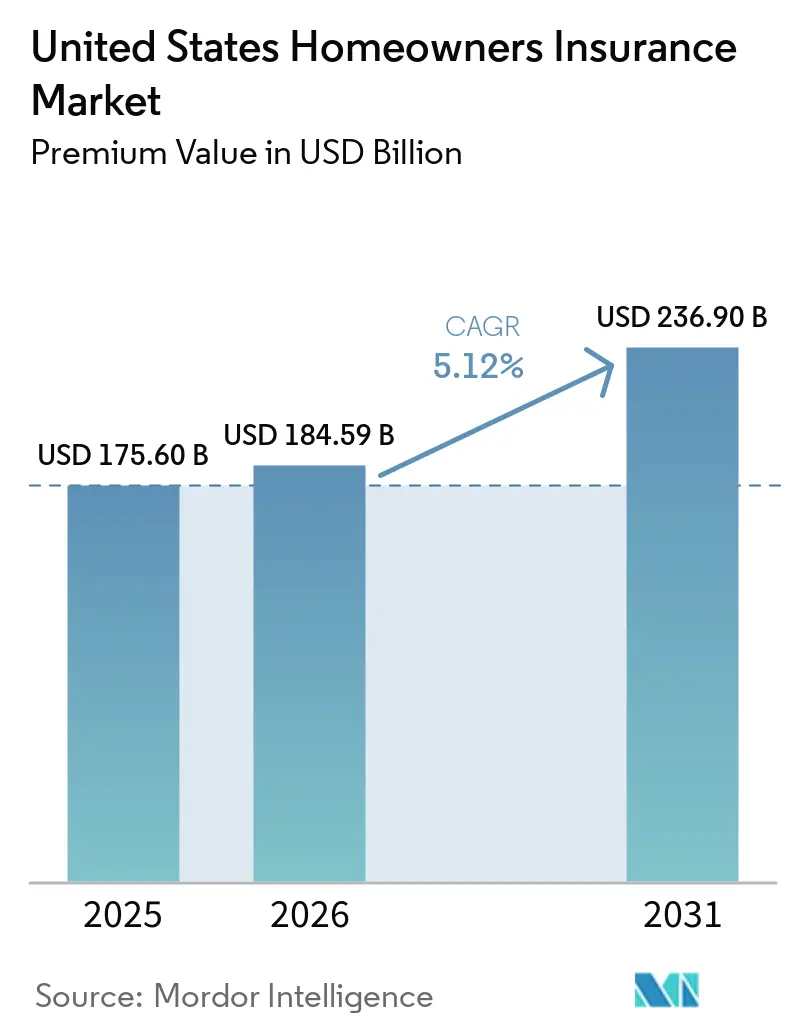
| Base Year Market Size (2025) | USD 175.60 Billion |
| Market Size (2026) | USD 184.59 Billion |
| Market Size (2031) | USD 236.90 Billion |
| Growth Rate (2026 - 2031) | 5.12% CAGR |
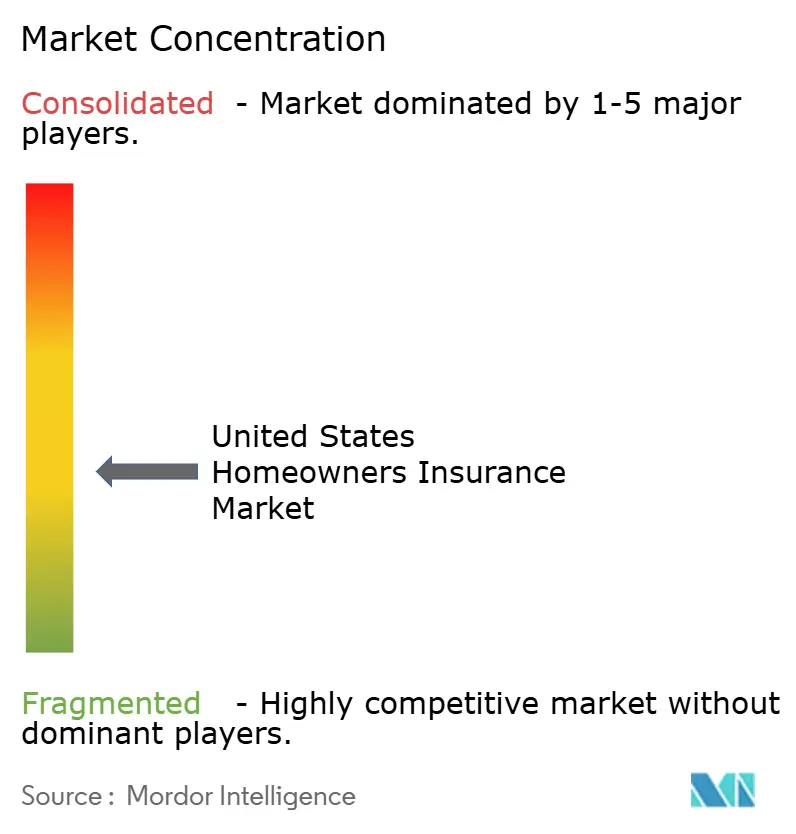
| Market Concentration | Medium |
Major Players *Disclaimer: Major Players sorted in no particular order Image © Mordor Intelligence. Reuse requires attribution under CC BY 4.0. | |
United States Homeowners Insurance Market Analysis by Mordor Intelligence
The United States Homeowners Insurance Market size in terms of premium value is projected to expand from USD 175.60 billion in 2025 and USD 184.59 billion in 2026 to USD 236.90 billion by 2031, registering a CAGR of 5.12% between 2026 to 2031.
The market’s scale reflects durable policy volume and the essential role of coverage in mortgage servicing, supported by an owner-occupied housing base of roughly 87 million households, representing a 65.3% homeownership rate in Q3 2025. After a deep underwriting loss in 2023, carriers restored profitability in 2024 on the back of broad rate actions and tighter risk management, although catastrophe risk continues to define the earnings profile. Insured losses tied to 27 billion-dollar disaster events reached USD 110 billion in 2024, keeping capital allocation cautious in high-exposure geographies. Regulatory shifts led by California’s allowance of catastrophe modeling in rate filings and rapid digitalization, including AI deployment across underwriting and claims, are setting the terms for growth and competition through 2031.
Key Report Takeaways
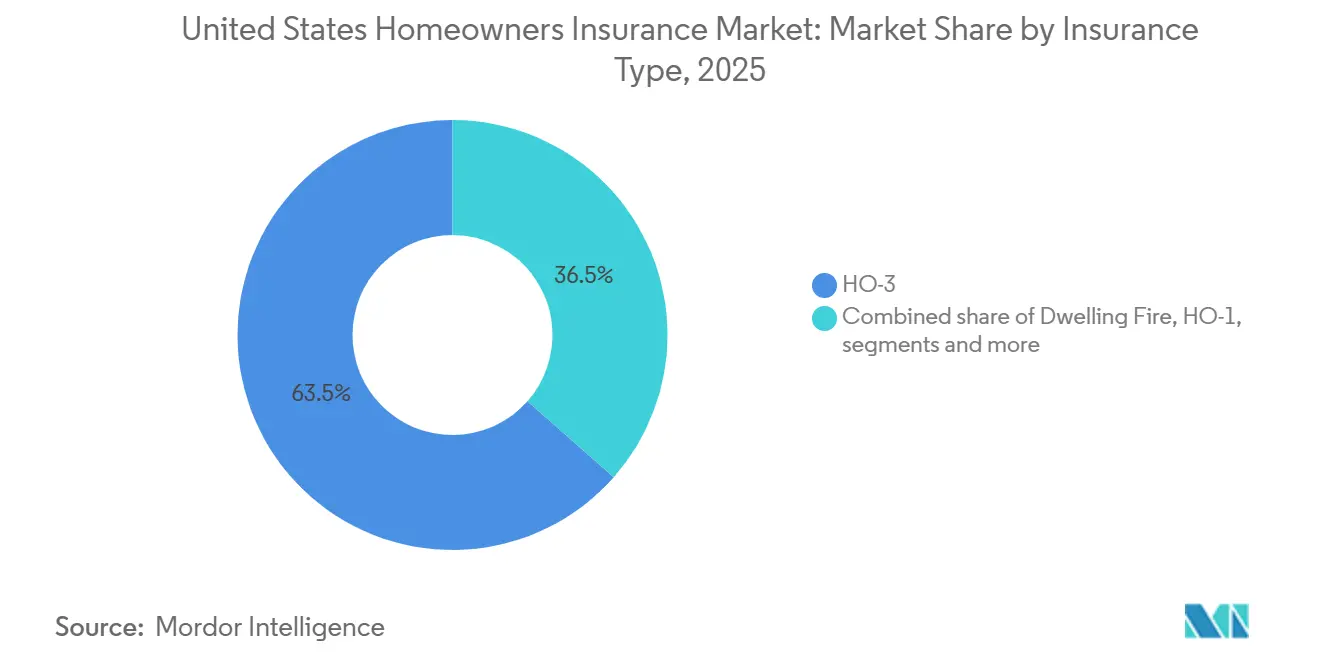
- By insurance type, HO-3 led with 63.50% revenue share of the United States homeowners insurance market size in 2025, while HO-3 is forecast to expand at a 7.84% CAGR through 2031.
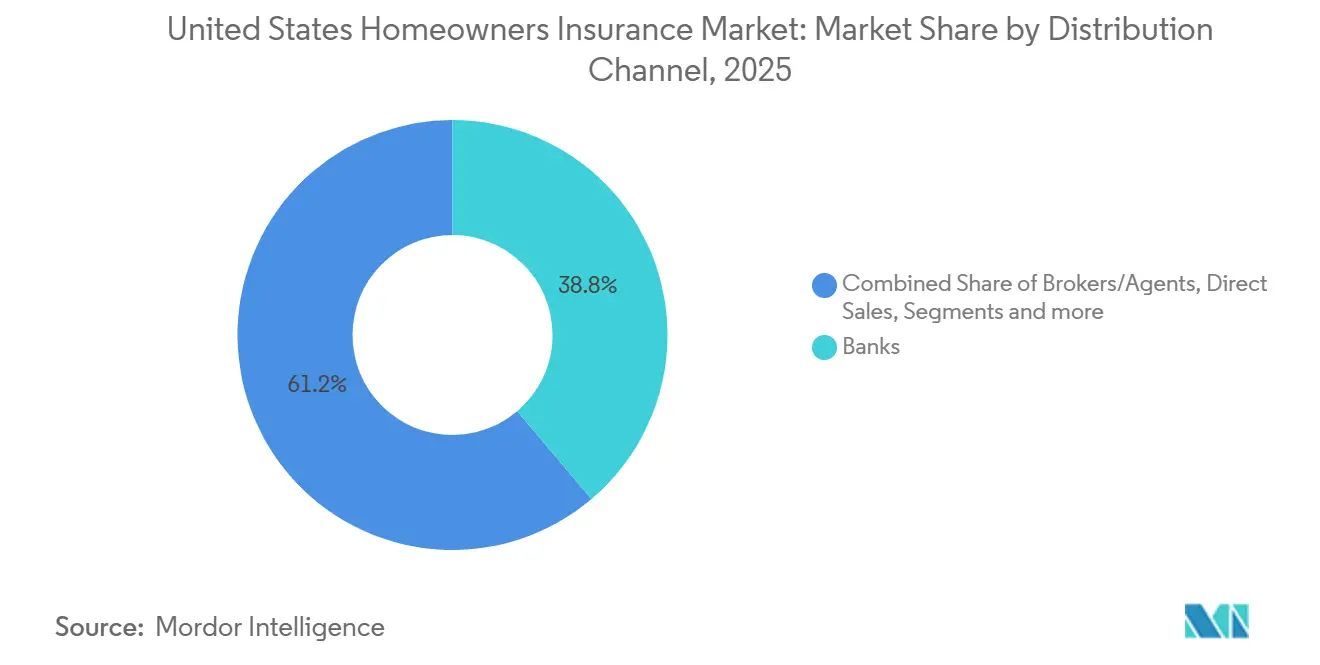
- By distribution channel, banks held a 38.80% share of the United States homeowners insurance market size in 2025, while brokers and agents are projected to post the highest growth at a 6.54% CAGR during 2026-2031.
- State Farm, Allstate, USAA, Liberty Mutual, and Farmers collectively dominated the United States homeowners insurance market.
Note: Market size and forecast figures in this report are generated using Mordor Intelligence’s proprietary estimation framework, updated with the latest available data and insights as of January 2026.
United States Homeowners Insurance Market Trends and Insights
Drivers Impact Analysis*
| Drivers | (~) % Impact on CAGR Forecast | Geographic Relevance | Impact Timeline |
|---|---|---|---|
| Mortgage-Linked Demand | +1.2% | National, concentrated in Texas, Florida, California | Long term (≥ 4 years) |
| Property Valuation Gains | +0.9% | Coastal California, Pacific Northwest, Southwest metros, secondary markets | Medium term (2-4 years) |
| Diversified Housing Stock | +0.7% | National, with Sunbelt growth in Texas, Florida, Arizona, and North Carolina | Long term (≥ 4 years) |
| Supportive State Regulation | +0.6% | California, Pennsylvania, Nevada, Colorado, Montana | Medium term (2-4 years) |
| Digitalization and AI Adoption | +0.8% | National, the highest adoption in urban metros and among younger consumers | Medium term (2-4 years) |
| Sustained Homeownership Base | +1.0% | National, strongest momentum in the affordable Midwest and South | Long term (≥ 4 years) |
| Source: Mordor Intelligence | |||
Mandatory Mortgage-Linked Insurance Demand
Lender requirements keep the United States homeowners insurance market anchored, since mortgage servicers mandate continuous dwelling coverage for financed homes regardless of price cycles. This structural effect is significant given that a majority of owner-occupied households carry mortgage debt, with the homeownership rate measuring 65.3% in Q3 2025 and the owner-occupied base near 87 million households[1]U.S. Census Bureau, “Housing Vacancy Survey,” U.S. Census Bureau, census.gov.. Policy availability tightens in catastrophe-prone areas, yet residual mechanisms and excess-and-surplus channels sustain access to coverage, helping stabilize policy counts even when prices rise. The 2024 return to underwriting profit demonstrates how rate adequacy and disciplined capacity management can offset volatility, while mortgage-linked inelasticity limits lapse risk in the core financed segment. As a result, the United States homeowners insurance market continues to exhibit stable baseline demand in 2026, even as risk selection and pricing sharpen in high-exposure territories.
Rising Residential Property Valuations
Home price appreciation feeds premium growth as insurers recalibrate coverage limits through inflation guard provisions and at renewal or property transfer. Elevated replacement cost inflation compounds the effect, with industry analysis reporting a multi-year spike in reconstruction costs that pushed coverage amounts higher through 2025[2]Insurance Information Institute, “A Firm Foundation: Homeowners Insurance Trends – Affordable Homeowners Insurance,” III, iii.org.. Owners’ monthly housing costs for mortgaged properties reached USD 2,035 in 2024, confirming the pressure that insurance and financing costs together place on household budgets. These valuation and cost trends ensure that the United States homeowners insurance market continues to capture higher insured values even when underlying transaction volumes fluctuate. The combined impact lifts premium bases while making coverage adequacy reviews a regular feature of annual renewals in 2026.
Expansive and Diversified Housing Stock
A large and diverse housing stock supports range, segmentation, and scale across policy forms and price points in the United States homeowners insurance market. National homeownership remains stable in 2026, with the rate at 65.3% in Q3 2025 and an owner-occupied base that supports steady policy demand aligned with household formation. Aggregated regulatory and industry data show meaningful variation in premiums and loss experience by risk geography, which favors carriers that manage balanced portfolios across regions. NAIC reporting also points to policy segmentation by insured value bands, an approach that refines underwriting tiers and pricing in standard, preferred, and non-standard segments. Technology and data enrichment, including aerial imagery and other property-level data, are increasingly embedded in underwriting workflows, and that precision enables better selection and pricing on a broad housing canvas in 2026.
Supportive State-Level Regulatory Environment
States are adapting frameworks to balance affordability with availability, which supports stability in the United States homeowners insurance market. Pennsylvania’s Insurance Department reported it evaluated property-casualty rate increases during 2025 and approved the substantial majority, signaling a path for rate adequacy while checking excessive requests. California’s December 2024 approval of catastrophe modeling in homeowners rate filings allows forward-looking wildfire and earthquake risk to be incorporated, while requiring coverage expansion commitments in higher-risk ZIP codes. A growing list of states is also legislating transparency and consumer communication around catastrophe models and wildfire risk scoring, according to a national legislative database that tracks 2025 activity. This stream of reforms facilitates operational predictability and aligns regulatory tools with current climate and market realities in 2026.
Restraints Impact Analysis*
| Restraints | (~) % Impact on CAGR Forecast | Geographic Relevance | Impact Timeline |
|---|---|---|---|
| Rising Catastrophe Exposure | -0.9% | Florida, California, Louisiana, the Atlantic coast, the Midwest, and the South convective storm belt | Long term (≥ 4 years) |
| Premium Affordability Pressure | -0.6% | National, most acute in California, Florida, Louisiana, and Texas | Medium term (2-4 years) |
| High-Risk Coverage Withdrawal | -0.4% | California, Florida, Louisiana, and wildfire-exposed Western states | Short term (≤ 2 years) |
| Rate Approval Delays | -0.3% | Prior-approval states and jurisdictions with lengthy reviews | Medium term (2-4 years) |
| Source: Mordor Intelligence | |||
Escalating Climate and Catastrophe Exposure
Catastrophe frequency and severity raise loss volatility and constrain risk appetites in exposed geographies, which weighs on growth. The United States recorded 27 billion-dollar disaster events in 2024, with insured losses totaling USD 110 billion, reflecting persistent increases in weather-related risk. H1 2025 performance showed direct losses incurred up 30.9% year over year and a pure direct loss ratio of 78.7%, which offset some of the rate adequacy carriers built in 2024[3]National Association of Insurance Commissioners, “Artificial Intelligence Topics,” NAIC, naic.org. Treasury analysis highlights the gradient in high-risk ZIP codes, where premiums and nonrenewals have been higher alongside elevated claim costs and loss ratios. This exposure dynamic remains a structural constraint on the United States homeowners insurance market in 2026 and informs underwriting, reinsurance, and geographic portfolio decisions.
Affordability Pressure from Premium Inflation
Premiums have risen faster than general inflation in recent years, intensifying affordability concerns, especially in high-risk zones. Treasury’s Federal Insurance Office documented average premium growth of 8.7% above inflation from 2018 to 2022, with the highest-risk areas experiencing an 82% premium differential relative to the lowest-risk areas. Household budgets also show stress, with median monthly owner costs for mortgaged homes at USD 2,035 in 2024. Insurers are refining roof and hazard underwriting and shifting some structures to actual cash value indemnity, which can narrow coverage breadth and elevate deductibles in risk-exposed areas. The affordability constraint tempers near-term elasticity in discretionary coverage enhancements within the United States homeowners insurance market while keeping mandatory base coverage resilient.
*Our forecasts treat driver/restraint impacts as directional, not additive. The impact forecasts reflect baseline growth, mix effects, and variable interactions.
Segment Analysis
By Insurance Type: HO-3 Dominance Reflects All-Risk Value Proposition
The HO-3 Special Form holds 63.50% of the United States homeowners insurance market share in 2025, with a projected 7.84% CAGR growth through 2031. Its broad dwelling protection, priced to meet mortgage requirements, makes it the default choice for standard owner-occupied risks in 2026[4]National Association of Insurance Commissioners, “2022 Homeowners Insurance Report,” NAIC, naic.org. The HO-5 form, designed for higher-value, coverage-sensitive households, is gaining exposure as demand for broader coverage and higher limits rises, according to recent NAIC data. HO-1 and HO-2 forms are shrinking, serving niche markets where property conditions or underwriting criteria limit broader options. This reinforces a two-tiered product structure dominated by HO-3 and premium HO-5 coverage. The HO-8 form, suitable for older properties where replacement costs are impractical, is declining as renovations modernize dwellings.
Policy exposures and coverage bands support this segmentation. NAIC data show a focus on mid-range dwelling limits, aligning with median property values and underwriting risk appetite. Technology-driven underwriting, including image analytics, enhances risk selection, improves HO-3 pricing adequacy, and enables HO-5 to justify surcharges for broader coverage. By 2026, form-level differentiation bridges consumer budget constraints with coverage needs for resilient rebuilds after severe weather. These dynamics continue to guide product design decisions in the United States homeowners insurance market.


By Distribution Channel: Direct Writers Capture Digital-First Consumers
Banks held a 38.80% market share in 2025, driven by mortgage origination touchpoints. Brokers and agents are projected to grow fastest, with a 6.54% CAGR from 2026 to 2031. Direct writers focus on digital-first acquisition, enhancing company-controlled experiences, reducing commission costs, and speeding up binding for standard risks. Independent agencies excel in complex placements and multi-carrier comparisons, especially in cases involving wildfire or wind risks. Exclusive agency networks provide local advice and reach, but face pressure as younger homeowners prefer digital channels for quotes and claims updates. Omnichannel distribution, blending digital tools with human guidance, is expected to anchor resilient customer journeys by 2026.
Digital automation is now a standard among leading United States homeowners insurance carriers. NAIC’s 2023 survey highlights widespread AI adoption in underwriting and claims, alongside regulatory discussions on model governance and consumer communication. Modernization reduces service costs, shortens cycle times, and retains expert advice for complex coverage. This enables faster digital binding for routine risks and structured routing of complex cases to advisory channels. As loss conditions remain volatile, distribution strategies linking channel economics to underwriting outcomes are expected to remain durable in 2026.
Geography Analysis
State-level variations in catastrophe exposure, housing economics, and regulation influence market performance and growth. California, the largest single-state opportunity by insured value, faces wildfire exposure and distribution challenges that intensified from 2022 to 2024. The December 2024 allowance for catastrophe modeling in rate filings marks progress toward market normalization, enabling forward-looking risk pricing and carrier commitments in high-risk ZIP codes. Florida, the most hurricane-prone jurisdiction, relies on public mechanisms to stabilize availability as private carriers adjust risk appetites. Texas shows strong growth potential driven by migration and household formation, though severe convective storms have elevated losses, impacting national loss ratios through mid-2025.
The Northeast, with steady homeownership and moderate catastrophe exposure, occasionally faces winter weather and hurricanes. Pennsylvania’s 2025 rate review reflects a balanced approach to rate adequacy, with most filings approved and minimal disallowances, ensuring stability for carriers and policyholders. Midwestern states, despite high homeownership and historical affordability, now face increased hail and tornado risks. NOAA-linked reports confirm severe convective storms caused significant insured losses in 2024 and early 2025, emphasizing the need for granular pricing and roof underwriting. These trends shape geographic diversification and reinsurance strategies for 2026.
The Southeast combines rapid household growth with hurricane exposure, creating dynamic but risk-sensitive conditions. Louisiana continues to experience capacity pressures, pushing policies into residual markets during private carrier retrenchment. The Mountain West faces rising wildfire severity and frequency, prompting legislative actions on modeling transparency and risk scoring, influencing rate filings. The Pacific Northwest benefits from favorable conditions outside wildfire-prone rural areas, with pricing competitiveness supporting the market in 2026. Catastrophe risk remains a key constraint, but regulatory modernization and portfolio diversification offer paths for sustained growth.
Competitive Landscape
The United States homeowners insurance market shows moderate concentration. State Farm, Allstate, USAA, Liberty Mutual, and Farmers collectively hold the majority of the market share, leaving room for regional and niche carriers. Insurers are focusing on stabilizing underwriting profitability following the 2024 rebound and 2025 volatility.
Strategic priorities include disciplined rate and limit management, product design improvements, and operational modernization. Rate adequacy is being restored through state-approved filings, as seen in Pennsylvania in 2025, where most proposed increases were approved. Adjustments to roof coverage terms, deductibles, and underwriting criteria align with hazard trends, supported by industry analyses on affordability and coverage shifts. Portfolio strategies aim to reduce exposure in high-risk ZIP codes while maintaining scale and retention in core markets.
Operational modernization, driven by AI and automation, enhances underwriting, claims processing, and fraud detection. The NAIC's AI survey highlights high adoption rates and evolving regulatory frameworks, including governance expectations for 2026. Catastrophe pricing reforms in states like California further support stable pricing and improved loss-cost visibility. Scale, data-driven insights, and disciplined capacity management shape competitive dynamics in 2026.
United States Homeowners Insurance Industry Leaders
AIA Group
Nippon Life Group
Life Insurance Corporation of India (LIC)
China Life Insurance Group
Ping An Insurance Group
- *Disclaimer: Major Players sorted in no particular order

Recent Industry Developments
- December 2025: Farmers Insurance Group closed a USD 400 million multi-year, multi-peril catastrophe bond to strengthen risk transfer and support underwriting capacity for property lines, including homeowners.
- November 2025: Farmers Insurance Group removed the cap on writing new homeowners insurance policies in California and submitted a new rating plan to support growth in the state.
- November 2025: The California Department of Insurance outlined next steps under its Sustainable Insurance Strategy that facilitate expanded homeowners availability, including the use of catastrophe modeling and recognition of reinsurance costs in rate plans.


United States Homeowners Insurance Market Report Scope
The homeowner’s insurance market refers to the organized industry of property insurance products designed to protect residential dwellings, household assets, and liability exposures. It plays a critical role in safeguarding homeowners against risks such as fire, natural disasters, theft, and liability claims, while also serving as a mandatory requirement in mortgage-linked financing. The market is shaped by rising residential property valuations, diversified housing stock, supportive state-level regulatory environments, and the digitalization of policy distribution and servicing, all of which sustain demand and reinforce the role of homeowner’s insurance in household financial planning.
The market is segmented by insurance type and distribution channel. By insurance type, it includes dwelling fire policies and homeowner’s insurance forms such as HO‑1, HO‑2, HO‑3, HO‑5, and HO‑8, each offering varying levels of coverage for property, contents, and liability. By distribution channel, the market is divided into brokers and agents, banks, direct sales, and other channels, reflecting the balance between traditional intermediated models and digital-first approaches. The report offers market size and forecasts for the United States Homeowners Insurance Market in value (USD) for all the above segments.
| Dwelling Fire |
| HO-1 |
| HO-2 |
| HO-3 |
| HO-5 |
| HO-8 |
| Brokers/Agents |
| Banks |
| Direct Sales |
| Other Channels |
| By Insurance Type | Dwelling Fire |
| HO-1 | |
| HO-2 | |
| HO-3 | |
| HO-5 | |
| HO-8 | |
| By Distribution Channel | Brokers/Agents |
| Banks | |
| Direct Sales | |
| Other Channels |


Key Questions Answered in the Report
What is the size of the the United States homeowners insurance market in 2026 and its outlook to 2031?
The United States homeowners insurance market size is USD 184.59 billion in 2026 and is projected to reach USD 236.90 billion by 2031 at a 5.12% CAGR.
Which policy form dominates homeowners coverage in the United States?
HO-3 is the leading form and held 63.50% of the United States homeowners insurance market share in 2025, with the same form projected to grow fastest at a 7.84% CAGR through 2031.
How are catastrophe losses shaping performance in 2026?
The United States experienced 27 billion-dollar disasters and USD 110 billion in insured catastrophe losses in 2024, and H1 2025 showed a homeowners' pure direct loss ratio of 78.7%, which keeps underwriting volatility elevated in 2026.
Which distribution channels are positioned to grow faster in the next five years?
While banks hold the largest share, brokers and agents are projected to record the fastest growth at a 6.54% CAGR during 2026-2031, supported by advisory demand for complex risks.
Which carriers hold the largest shares in the United States?
State Farm, Allstate, USAA, Liberty Mutual, and Farmers are the top five by 2024 premiums.
What policy or regulatory changes could impact homeowners insurance availability?
California now permits catastrophe modeling in rate filings and requires coverage commitments in higher-risk zones, which supports more sustainable pricing and measured re-entry.
Page last updated on:


