United States Car Insurance Market Size and Share
Market Overview
| Study Period | 2020 - 2031 |
|---|---|
| Forecast Data Period | 2026 - 2031 |
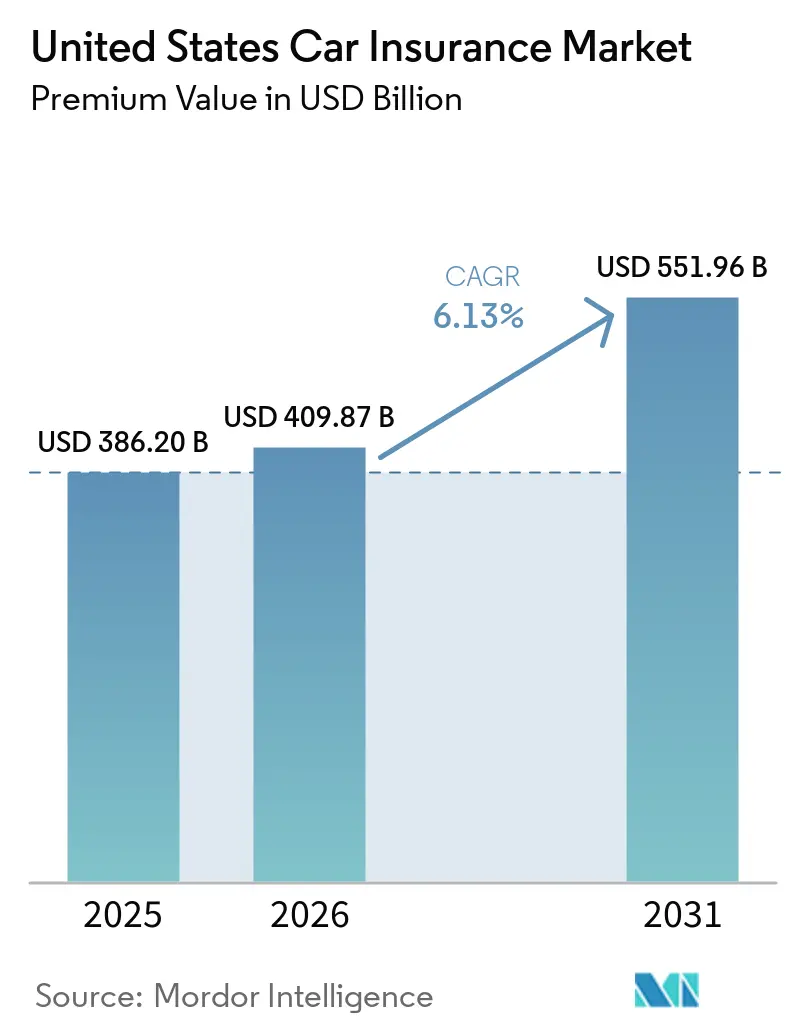
| Base Year Market Size (2025) | USD 386.20 Billion |
| Market Size (2026) | USD 409.87 Billion |
| Market Size (2031) | USD 551.96 Billion |
| Growth Rate (2026 - 2031) | 6.13% CAGR |
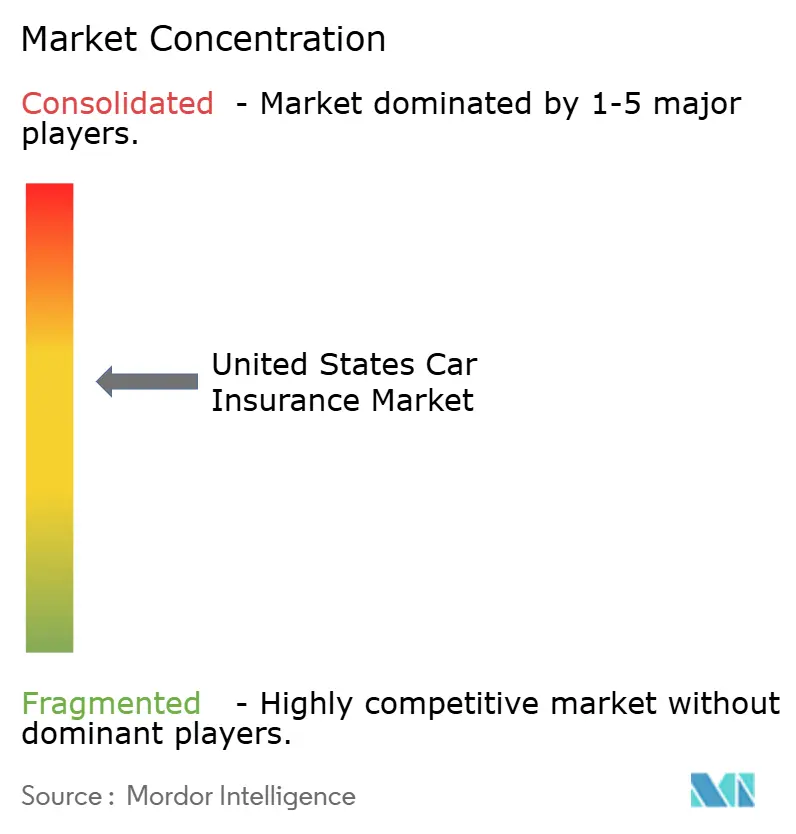
| Market Concentration | Medium |
Major Players *Disclaimer: Major Players sorted in no particular order Image © Mordor Intelligence. Reuse requires attribution under CC BY 4.0. | |
United States Car Insurance Market Analysis by Mordor Intelligence
The United States Car Insurance Market size in terms of premium value is expected to grow from USD 386.20 billion in 2025 to USD 409.87 billion in 2026 and is forecast to reach USD 551.96 billion by 2031 at 6.13% CAGR over 2026-2031.
Robust premium growth follows 15% average rate hikes in 2024 that eased to 10% in 2025, while stricter liability limits in four states immediately enlarge the insurable base. Accelerating embedded insurance adoption among Gen Z and millennials, telematics-driven underwriting, and fresh products for electric and autonomous vehicles collectively support a durable demand runway across the United States car insurance market. Conversely, surging repair bills tied to advanced driver-assistance systems, rising catastrophe losses, and an estimated USD 122 billion in annual fraud heighten loss costs, spurring rapid deployment of AI-enabled pricing and claims tools. Scale players exploit data depth, cloud infrastructure, and capital flexibility to reinforce their competitive moats, while midsize and regional insurers rely on partnerships, geographic focus, and niche propositions to stay relevant inside the United States car insurance market.
Key Report Takeaways
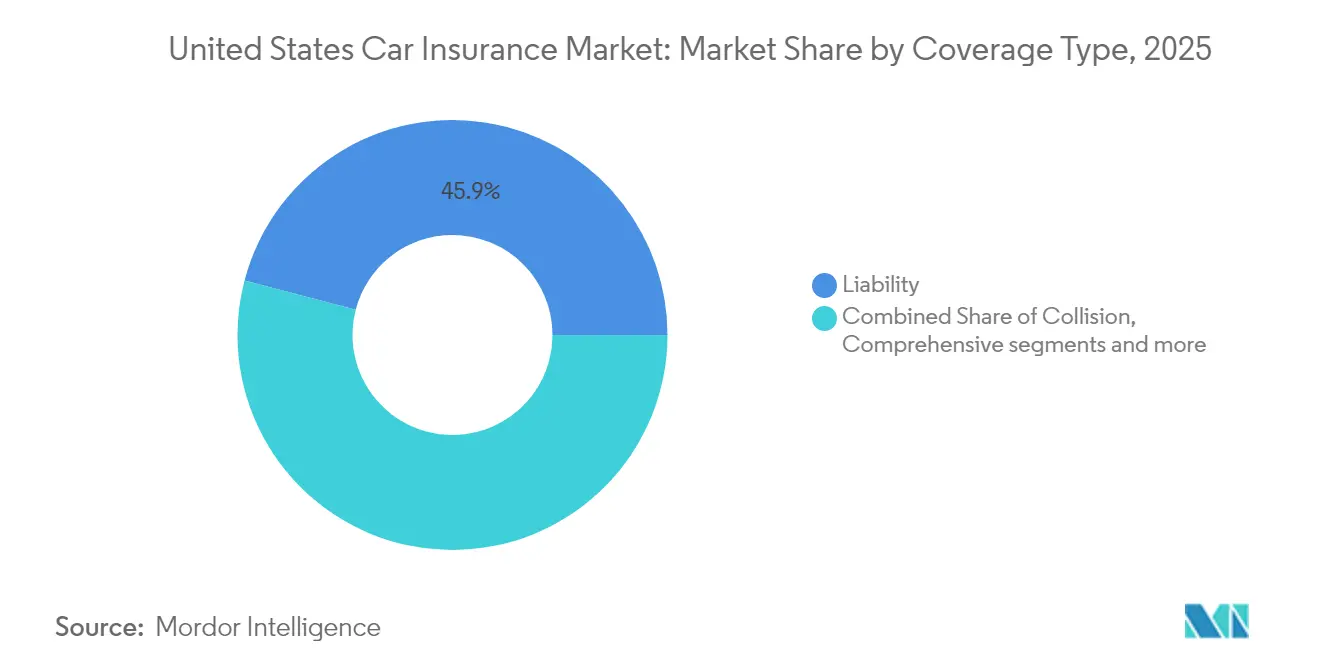
- By coverage type, liability insurance held 45.92% of the United States car insurance market share in 2025, while comprehensive coverage is forecast to advance at a 6.28% CAGR through 2031.
- By application, personal vehicles accounted for 81.56% of the United States car insurance market size in 2025; commercial fleets are projected to expand at a 7.01% CAGR between 2026 and 2031.
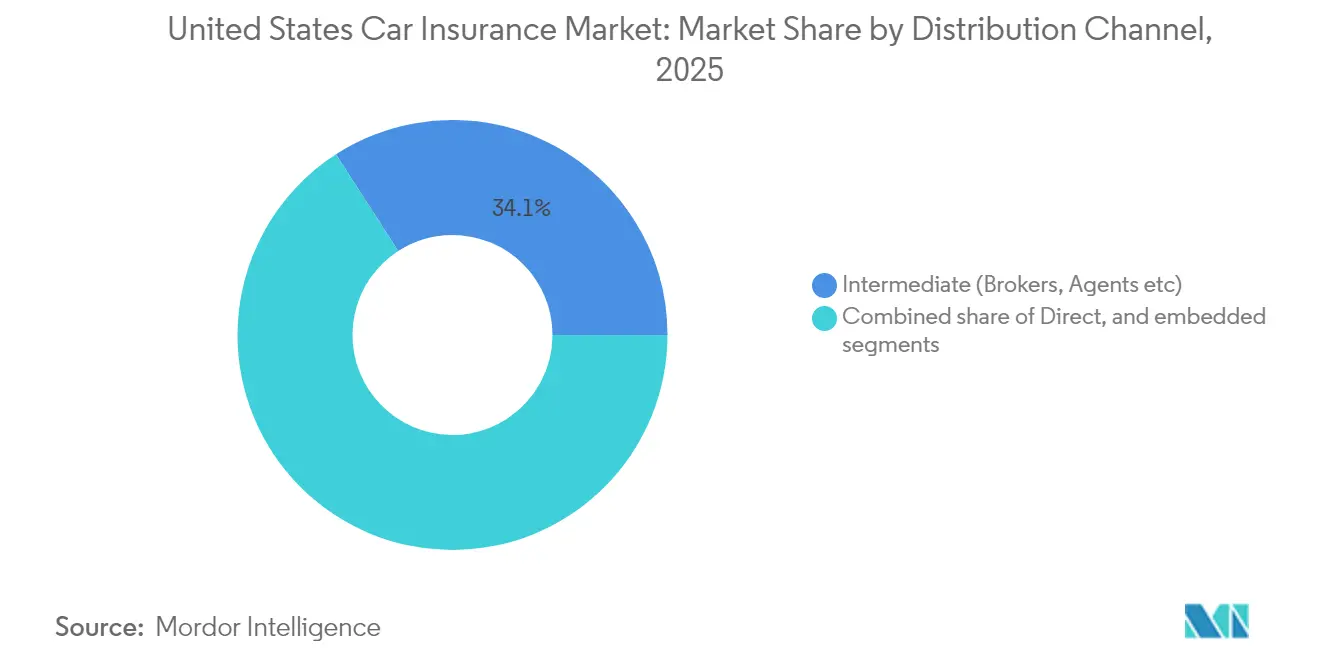
- By distribution channel, intermediated sales maintained 34.12% of premiums in 2025, but direct-to-consumer is the fastest-growing path at an 8.24% CAGR to 2031.
- By region, the Northeast commanded 61.62% of written premiums in 2025 and is rising at a 5.52% CAGR through 2031.
Note: Market size and forecast figures in this report are generated using Mordor Intelligence’s proprietary estimation framework, updated with the latest available data and insights as of 2026.
United States Car Insurance Market Trends and Insights
Drivers Impact Analysis*
| Driver | (~) % Impact on CAGR Forecast | Geographic Relevance | Impact Timeline |
|---|---|---|---|
| Rising frequency & cost of road accidents | +1.2% | National, urban concentration | Medium term (2–4 years) |
| Growth in vehicle ownership & VMT | +0.8% | National, Sun Belt concentration | Long term (≥ 4 years) |
| Mandatory minimum-liability regulations | +0.6% | CA, NC, UT, VA | Short term (≤ 2 years) |
| Declining telematics hardware costs | +0.4% | National, tech-forward regions | Medium term (2–4 years) |
| AI-driven claims automation | +0.3% | National, large-carrier led | Medium term (2–4 years) |
| New EV / AV risk products | +0.2% | CA, TX, FL, tech hubs | Long term (≥ 4 years) |
| Source: Mordor Intelligence | |||
Rising Frequency and Cost of Road Accidents
Driving violations climbed 17% in 2024, with major speeding up 16% and Gen Z distracted-driving tickets surging 50%, sustaining upward pressure on both frequency and severity. Advanced driver-assistance components, now 40% of vehicle cost, raise parts prices and require calibration, pushing average repair spend 31% above 2019 levels. Prolonged supply-chain disruptions amplify loss-adjustment expense, while social inflation lifts commercial auto liability loss ratios to 84.5%, the five-year high. Insurers recalibrate rating factors, incentivize safer driving through telematics, and prioritize parts-procurement partnerships to curb runaway costs. The resulting actuarial vigilance supports premium increases even as competition intensifies, preserving growth momentum for the United States car insurance market.
Growth in Vehicle Ownership and VMT
Vehicle-miles-traveled rebounded to pre-pandemic ranges in 2025, and new registrations continue a multi-year climb that broadens the overall premium base. Electric vehicles expand their share; however, claim frequency is 14% higher than for comparable internal-combustion models because high-voltage battery modules often cost more than USD 15,000 to replace, inflating severity. Commercial fleet growth, driven by e-commerce and last-mile delivery, fuels usage-based insurance programs that shave 10-15% off safe-driver premiums while giving players granular exposure insights. Sun Belt population inflows and economic expansion deepen penetration in historically lower-density markets, offsetting plateauing unit growth in the Northeast. Finally, an aging vehicle park, average age exceeds 12 years, creates a mix of lower total-loss values yet more frequent minor repairs, maintaining a steady demand current inside the United States car insurance market.
Mandatory Minimum-Liability Regulations
Four states raised minimum limits in 2025. California doubled bodily-injury thresholds to USD 30,000 per person and USD 60,000 per accident, its first adjustment in 56 years, while North Carolina adopted USD 50,000/100,000/50,000, now among the nation’s highest[1]State of California, “SB1107 Insurance Minimum Liability Limits,” ca.gov . Utah and Virginia followed with sizeable hikes that together impact millions of low-limit policies, delivering an immediate premium lift that feeds into statewide written premium growth. Although higher limits heighten affordability concerns for lower-income drivers, the structured phase-in provides players with predictable revenue curves and reduces under-insurance risk. The National Association of Insurance Commissioners is boosting oversight on rate adequacy reviews, adding transparency without dampening earnings prospects, thus reinforcing a positive outlook for the United States car insurance market[2]NAIC, “2025 Consumer Protection Priorities,” naic.org .
Declining Telematics Hardware Costs Boost UBI Adoption
Smartphone-based telematics reduces installation friction, allowing Progressive, Allstate, and newcomers alike to embed usage-based options in most auto policies. Richer data, acceleration, braking, cornering, and time-of-day, refine risk segmentation and let insurers reward safe behaviors with immediate premium credits. Commercial fleets adopt plug-and-play solutions that integrate route optimization, cutting fuel and crash costs while feeding actuarial models real-time risk insights. Younger consumers, predisposed to data sharing in exchange for savings, have accelerated take-up; Progressive’s direct-auto policy mix incorporating telematics climbed 25% in 2024 alone[3] Progressive Corporation, “2024 Annual Report,” progressive.com . Embedded telematics also enables automated first-notice-of-loss and proactive accident assistance, raising customer satisfaction and cementing stickiness inside the United States car insurance market.
Restraints Impact Analysis*
| Restraint | (~) % Impact on CAGR Forecast | Geographic Relevance | Impact Timeline |
|---|---|---|---|
| Rising insurance fraud & false claims | −0.7% | National, high-litigation states | Medium term (2–4 years) |
| Intensifying price competition | −0.5% | National, dense urban areas | Short term (≤ 2 years) |
| Consumer privacy backlash | −0.3% | Privacy-conscious regions | Medium term (2–4 years) |
| Climate-driven catastrophe losses | −0.4% | Southeast, Gulf Coast, wildfire zones | Long term (≥ 4 years) |
| Source: Mordor Intelligence | |||
Rising Insurance Fraud and False Claims
Roughly 10% of P&C claims contain fraudulent elements, draining USD 122 billion annually. Digital claim portals hastily adopted during the pandemic introduced vulnerabilities exploited by identity theft rings and staged-collision syndicates. Attorney representation appears in 93% of bodily injury claims in Florida and Louisiana, extending cycle times and inflating settlements. Crime rings now weaponize generative AI to craft deep-fake documents and video evidence, challenging legacy detection systems. In response, Deloitte estimates AI-based counter-fraud platforms could save USD 80-160 billion by 2032, yet near-term deployment costs and skills shortages still squeeze players' margins across the United States car insurance market.
Intensifying Price Competition Compresses Margins
Average annual premiums hit USD 2,543 in 2024, spurring 45% of active policies to be shopped at least once, the highest churn on record. Digital-native insurers and OEM-linked embedded offerings undercut traditional players by stripping distribution costs and leveraging proprietary vehicle data, shifting potentially USD 50 billion in premiums by 2030. Rising rate sensitivities push players into price wars, eroding underwriting margins even as loss trends remain adverse. Smaller mutuals pivot to affinity partnerships and customer-experience differentiation, whereas major publics rely on expense leverage and analytics to defend profitability. The competitive intensity marginally moderates aggregate growth but ultimately spurs innovation that can strengthen long-term prospects for the United States' car insurance market.
*Our forecasts treat driver/restraint impacts as directional, not additive. The impact forecasts reflect baseline growth, mix effects, and variable interactions.
Segment Analysis
By Coverage: Liability Dominance Amid Comprehensive Growth
Liability policies represented 45.92% of premiums in 2025, reflecting statutory purchase requirements and recent minimum-limit hikes that solidify their foundational role within the United States car insurance market. California’s doubled limits alone add hundreds of millions in additional written premiums, while states such as North Carolina and Massachusetts follow similar trajectories, locking in multi-year premium tailwinds. Comprehensive coverage drives a 6.28% CAGR, the fastest across major coverages. Collision faces widening loss-cost gaps as ADAS components demand specialized calibration; some players lift deductibles or restrict coverage for luxury brands to protect combined ratios. Personal injury protection retains high penetration in no-fault states but wanes elsewhere, where consumers instead raise bodily-injury limits. Uninsured-motorist endorsements grow as economic stress forces some drivers to lapse policies. Meanwhile, cyber-physical risk for connected cars surfaces as an emerging exposure, leading specialty underwriters to propose hybrid liability-cyber riders that could further diversify the United States car insurance market.
The United States car insurance market size for comprehensive coverage is projected to climb at a 6.28% CAGR through 2031, reflecting both rising average-vehicle values and greater climate volatility. Liability, while mature, will still deliver steady premium increments from regulatory-driven limit increases and expanding insured-vehicle counts in growth states. Market participants that align coverages with evolving risk profiles, particularly by integrating parametric hail add-ons and tiered ADAS repair endorsements, stand to capture outsized share gains and defend profitability in the United States car insurance market.


By Application: Commercial Fleets Drive Innovation
Personal lines dominated with 81.56% premium share in 2025, yet commercial auto outpaced at a 7.01% CAGR, propelled by e-commerce, gig-economy deliveries, and regional distribution booms. Fleet operators deploy telematics and driver coaching dashboards, yielding 20% crash reductions that unlock premium credits and operational savings, further reinforcing migration to usage-based products. Electrification accelerates within light-duty delivery fleets; insurers experiment with battery degradation warranties and downtime reimbursement, thus enriching coverage menus. Personal-auto insurers pivot toward embedded and subscription models: OEMs integrate quotes into financing portals, and ride-share platforms bundle micro-duration coverage that activates only during ride periods.
Commercial fleets introduce opportunities for mixed-form programs combining commercial general liability with auto covers, while autonomous vehicle pilots necessitate bespoke blends of product liability and commercial auto. The United States car insurance market size for mixed-mobility fleets could scale rapidly once regulatory clarity emerges, incentivizing insurers to refine scenario modeling around shared-ownership, vehicle-as-a-service, and urban-air-mobility concepts. Players that synchronize underwriting, real-time data ingestion, and claims automation are best positioned to convert these structural shifts into defensible margin in the United States car insurance market.
By Distribution Channel: Digital Transformation Accelerates
Intermediated sales retained a 34.12% share in 2025, serving complex commercial accounts and affluent personal lines through high-touch advisory. Nevertheless, direct-to-consumer channels, energized by frictionless quote-bind journeys, are expanding at 8.24% CAGR, redirecting premium flow toward web and mobile platforms. Progressive posted 25% growth in direct auto policies by coupling competitive pricing with user-centric interfaces and real-time telematics feedback. Embedded insurance resonates strongly, 84% of millennials and Gen Z prefer obtaining policies at the point of vehicle acquisition, prompting OEMs such as Hyundai, Tesla, and General Motors to launch in-house or partnered insurance units.
Bank-partnered distribution faces disruption as fintech lenders embed auto policies within digital loan processes, encroaching on the traditional bancassurance space. Independent agents respond by integrating comparative-rating tech and AI chatbots, shortening quote times and elevating personalized advice. Captive networks leverage brand trust and bundled discounts across home, life, and auto to reinforce retention. United States car insurance market size tied to direct digital channels could eclipse intermediated growth over the forecast horizon, yet hybrid service models blending human counsel with smart automation appear most resilient to competitive upheaval, underscoring the evolving multichannel fabric of the United States car insurance market.
Geography Analysis
The Northeast retained a 61.62% premium share in 2025, driven by dense urban driving, elevated vehicle values, and historically higher rate filings. Massachusetts will raise minimum limits in July 2025, adding a measurable premium uplift, while embedded insurance uptake among urban millennials introduces fresh growth vectors in an otherwise saturated pool. Extreme weather events—nor’easters, flash floods, and coastal storms—inflate comprehensive losses, spurring insurers to refine cat models and expand parametric offerings. Infrastructure congestion and complex traffic patterns sustain accident frequency, reinforcing liability demand and contributing to predictable growth in the United States car insurance market.
The South exhibits pronounced dynamism as population migration and economic diversification lift vehicle counts and miles driven. Catastrophe exposure remains acute: Florida’s hurricane zone and Texas’s hail alley challenge reinsurance budgets and prompt granular risk-mapping initiatives. Legislative shifts, such as Florida’s HB 837 tort reform, seek to temper social inflation pressures, improving underwriting visibility. Commercial auto expansion is notable around Gulf Coast energy corridors and logistics hubs, while ride-share and delivery platforms intensify personal-commercial boundary blurring. Modular policy designs that flex between personal and commercial use gain traction, broadening the United States car insurance market.
The Midwest delivers balanced growth; lower litigation rates and more moderate weather lower volatility, yet hail belts in Kansas, Missouri, and Nebraska still drive comprehensive losses. OEM-linked embedded offerings gain early traction in Illinois and Ohio, leveraging robust dealer networks. The West juxtaposes innovation with hazard: California’s wildfire threat raises reinsurance and non-renewal issues even as its technology ecosystem accelerates telematics and autonomous-vehicle pilots. Raising minimum limits injects revenue, whereas ongoing Department of Insurance scrutiny shapes future rate filings. Early adopters of manufacturer-provided coverage, such as Tesla’s Data-Driven Insurance, illustrate how regional tech clusters can redefine underwriting, adding fresh momentum to the United States car insurance market.
Competitive Landscape
Market concentration tightened as the top five players captured more than half of premiums in 2024, reflecting scale benefits in data analytics, capital, and brand reach. Progressive had a combined ratio under 90%, demonstrating disciplined growth. State Farm swung back in net profit after pandemic-era volatility, reinforcing its ability to fund modernization and marketing campaigns. GEICO trimmed advertising spend yet maintained price leadership through telematics-enabled discounts, preserving volume in key segments. Together, these leaders anchor pricing benchmarks and technological pace across the United States car insurance market.
Strategic differentiation now hinges on advanced analytics, AI-powered claims automation, and embedded partnerships. Root’s alliance with Hyundai embeds coverage at vehicle checkout, while GM Insurance transitions from agency to full-stack carrier in three states, signaling OEM ambitions to harvest data advantages. Sentry’s USD 1.7 billion acquisition of General consolidates the non-standard niche, giving it scale to negotiate reinsurance and refine pricing for high-risk drivers. InsureVision’s seed funding round, led by State Farm, underscores incumbents’ appetite for computer-vision tech that can reduce commercial-fleet collision frequency. These maneuvers illustrate how investment in digital assets, distribution ecosystems, and M&A activity defines success in the United States car insurance market.
AI-driven fraud detection and behavioral telematics tools constitute critical battlegrounds. Early pilots report 15-20% reductions in fraudulent payouts and 20% shorter claim cycles, translating into combined ratios advantages for adopters. Leaders build proprietary data warehouses ingesting vehicle, weather, and mobility data streams, while smaller players access comparable capabilities via white-label platforms and reinsurer-sponsored consortiums. White-space growth emerges in electric-vehicle total-battery replacement endorsements, autonomous-mobility commercial pools, and micro-duration coverage for gig workers. Players that marry actuarial rigor with agile product squads aim to convert these niches into sustainable revenue channels. Overall, scale leaders enjoy a structural edge, yet nimble specialists exploiting underserved pockets can still carve profitable franchises inside the United States car insurance market.
United States Car Insurance Industry Leaders
State Farm Mutual Automobile Insurance
Berkshire Hathaway Inc.
Progressive Corp.
Allstate Corp.
USAA Insurance Group
- *Disclaimer: Major Players sorted in no particular order

Recent Industry Developments
- June 2025: Goldman Sachs projects autonomous vehicles could halve auto-insurance expenditure by 2040, though liability complexity may elevate premiums in the interim.
- April 2025: Progressive nationwide rollout of Accident Response leverages smartphone sensors to trigger emergency services automatically.
- January 2025: Sentry has finalized its USD 1.7 billion acquisition of The General, a move that significantly expands its presence in the non-standard auto insurance market. This strategic deal enhances Sentry’s portfolio diversification and strengthens its foothold in high-risk policy segments.
- January 2025: Four states have raised their minimum auto liability insurance limits, with California doubling its coverage thresholds. This regulatory shift is expected to increase premium costs and impact insurer pricing strategies across affected markets.


Research Methodology Framework and Report Scope
Market Definitions and Key Coverage
Our study defines the United States car insurance market as all mandatory or voluntary policies that protect privately owned passenger cars against liability, collision, comprehensive, and personal-injury risks, measured by gross written premium. Policies sold through agents, direct online channels, and telematic programs are inside scope.
Scope Exclusion: Extended warranties, mechanical-breakdown insurance, and experimental pay-per-mile pilots are excluded.
Segmentation Overview
- By Coverage
- Liability
- Collision
- Comprehensive
- PIP/Med-Pay
- Uninsured/Under-insured Motorist
- By Application
- Personal Vehicles
- Commercial Fleets
- By Distribution Channel
- Direct-to-Consumer (DTC)
- Intermediated
- Embedded
- By US Region
- Northeast
- Midwest
- South
- West
Detailed Research Methodology and Data Validation
Primary Research
Mordor analysts interviewed underwriting heads, agents, insurtech founders, and actuaries across four census regions to confirm premium growth triggers and regulatory caps.
A policyholder survey clarified switching intent and discount uptake, filling gaps left by desk work.
Desk Research
We began with NAIC annual statements, Bureau of Transportation Statistics vehicle counts, and FHWA mileage trends to size exposure units and premium pools. Insurance Information Institute fact books, state regulator filings, and congressional briefs on auto-safety bills added regulatory and pricing context. According to Mordor Intelligence, carrier financials from D&B Hoovers, macro news from Dow Jones Factiva, and Questel patent analytics on telematics adoption enriched trend mapping. These examples are illustrative, and numerous other documents and trade journals were reviewed.
A second sweep of company 10-Ks, investor decks, and consumer-complaint data helped refine claim severity after severe weather, adjust loss ratios, and benchmark pricing cycles.
Market-Sizing & Forecasting
We built the topline first from a top-down reconstruction of gross written premiums using NAIC filings, adjusted for self-insured fleets and online direct sales. Selective bottom-up checks rolled up sampled carrier premiums against DMV vehicle counts. Key inputs include registered vehicles, average premium, claim frequency, claim severity, mandated coverage, and disposable income.
A multivariate regression projects these drivers to 2030, and when disclosures lack detail, region-specific penetration rates from interviews bridge gaps.
Data Validation & Update Cycle
Every model run passes variance checks against independent indicators, followed by peer and senior review. Reports refresh annually, with interim updates when major regulatory or catastrophe events shift the market.
Why Mordor's US Car Insurance Baseline Commands Reliability
Published estimates differ because firms choose dissimilar policy scopes, premium definitions, and refresh cadences. Our disciplined variable selection and consistent currency treatment yield a steady baseline decision-makers can trust.
Key gap drivers elsewhere include omission of commercial add-ons, reliance on direct rather than written premiums, and untested catastrophe-load assumptions.
Benchmark comparison
| Market Size | Anonymized source | Primary gap driver |
|---|---|---|
| USD 331.2 billion (2025) | Mordor Intelligence | - |
| USD 321.0 billion (2022) | Regional Consultancy A | Excludes commercial auto; no inflation alignment |
| USD 286.5 billion (2022) | Trade Journal B | Uses direct premiums only; mixed currency basis |
This comparison shows that Mordor's balanced scope, transparent assumptions, and faster refresh cadence deliver a reproducible benchmark closely aligned with actual premium flows.


Key Questions Answered in the Report
What factors are causing United States car insurance premiums to rise in 2025?
Average rates went up 15% in 2024 and another 10% in 2025 because accident severity is climbing, repair costs tied to advanced driver-assistance systems are 31% above 2019 levels, and climate-related catastrophe losses keep reinsurance prices high
How will the new mandatory minimum liability limits affect drivers?
Four states—including California, which doubled its bodily-injury limit to USD 30,000 per person—implemented higher minimums in 2025; millions of low-limit policies now must upgrade coverage, which immediately lifts premiums but also reduces the risk of being under-insured.
Why is usage-based insurance (UBI) gaining popularity so quickly?
Smartphone telematics has slashed hardware costs, letting insurers like Progressive embed real-time driving data into pricing; safe drivers can earn 10-15% discounts while fleets get actionable safety analytics.
Do electric vehicles cost more to insure?
Yes. In 2024 average EV premiums were 28% higher than comparable gasoline cars because battery replacement can run past USD 15,000 and claim frequency was 14% higher year-over-year.
Page last updated on:


