Market Overview
| Study Period | 2020 - 2031 |
|---|---|
| Forecast Data Period | 2026 - 2031 |
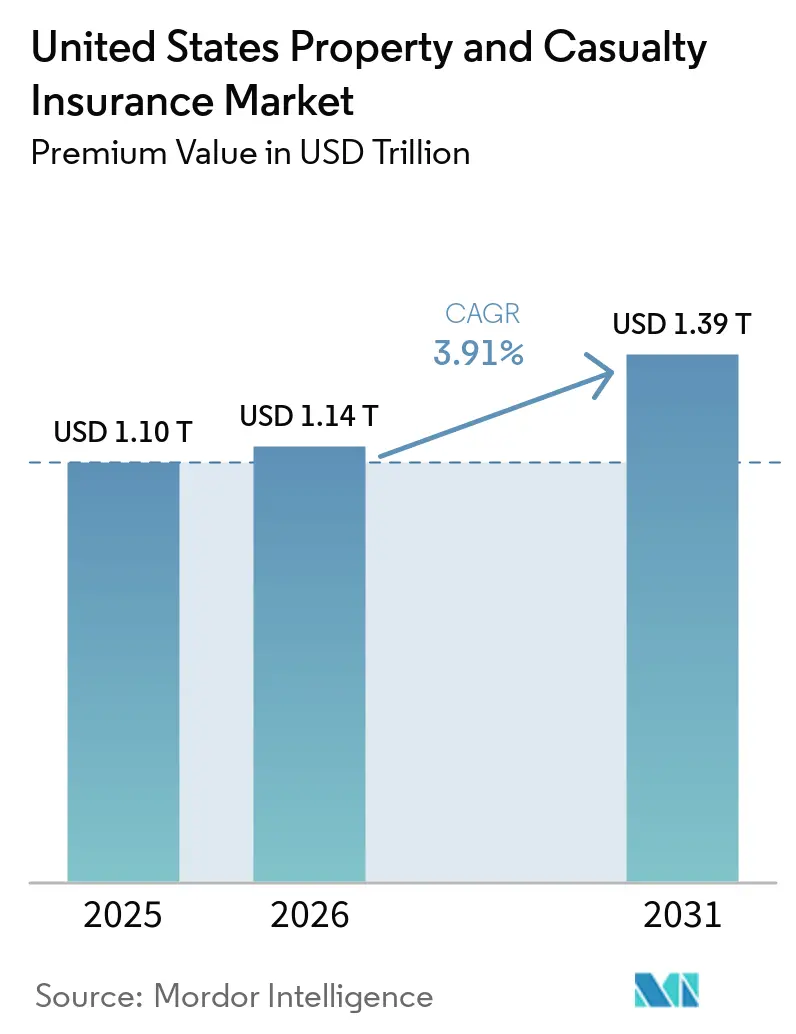
| Base Year Market Size (2025) | USD 1.10 Trillion |
| Market Size (2026) | USD 1.14 Trillion |
| Market Size (2031) | USD 1.39 Trillion |
| Growth Rate (2026 - 2031) | 3.91% CAGR |
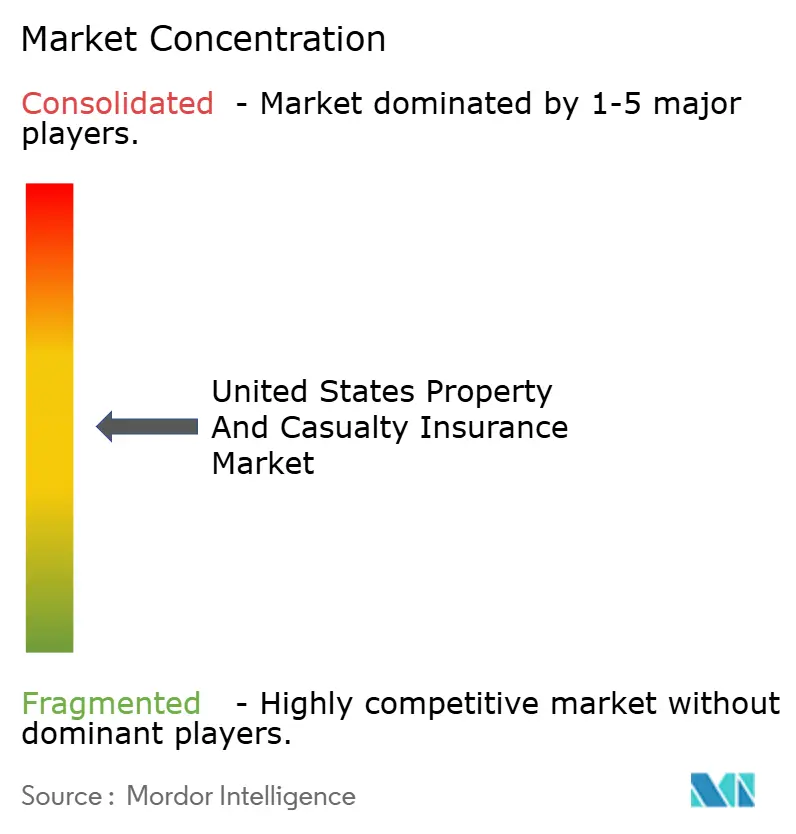
| Market Concentration | Medium |
Major Players *Disclaimer: Major Players sorted in no particular order Image © Mordor Intelligence. Reuse requires attribution under CC BY 4.0. | |
United States Property and Casualty Insurance Market Analysis by Mordor Intelligence
The United States Property And Casualty Insurance Market size in terms of premium value was valued at USD 1.10 trillion in 2025 and is estimated to grow from USD 1.14 trillion in 2026 to reach USD 1.39 trillion by 2031, at a CAGR of 3.91% during the forecast period (2026-2031).
Premium growth is chiefly a function of inflation-linked rate actions, with players focusing on margin preservation rather than pure volume expansion. A decisive return to underwriting profitability produced a gain in 2024 after a significant loss in 2023, underscoring the sector’s resilience. Technology investments in telematics, artificial intelligence, and embedded distribution models are reshaping pricing accuracy and customer acquisition strategies. Meanwhile, higher fixed-income yields widen investment spreads, giving insurers extra tolerance for near-term underwriting volatility. Competitive intensity is rising as the largest players leverage scale and data analytics to consolidate share, particularly within auto lines where telematics-based rating is now mainstream.
Key Report Takeaways
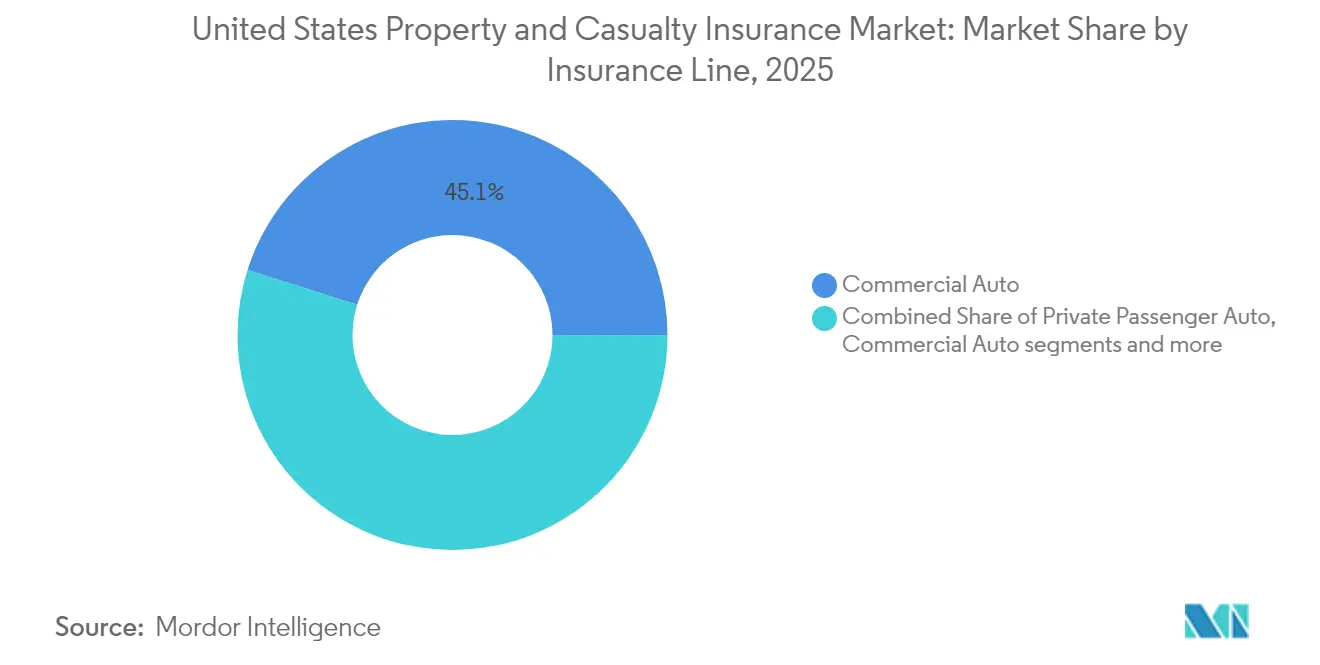
- By insurance line, commercial auto led with 45.12% revenue share in 2025; specialty lines are projected to expand at a 5.54% CAGR to 2031.
- By distribution channel, independent agents and brokers held 64.02% of the property and casualty insurance market share in 2025, while digital and insurtech platforms are forecast to grow at a 6.25% CAGR through 2031.
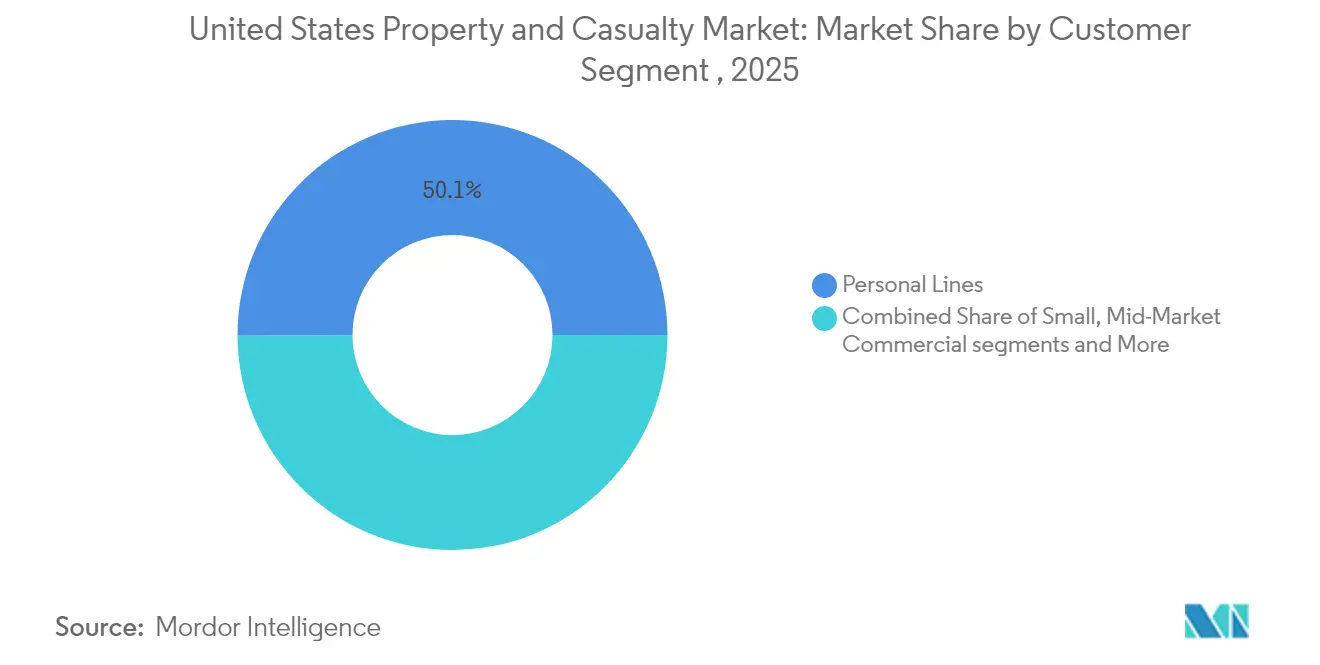
- By customer segment, personal lines accounted for 50.05% share of the property and casualty insurance market size in 2025, and small commercial is advancing at a 4.49% CAGR through 2031.
- By region, New York captured 32.10% revenue share in 2025; its market is expected to grow at a 4.28% CAGR to 2031.
Note: Market size and forecast figures in this report are generated using Mordor Intelligence’s proprietary estimation framework, updated with the latest available data and insights as of 2026.
United States Property and Casualty Insurance Market Trends and Insights
Drivers Impact Analysis*
| Driver | ( ~ ) % Impact on CAGR Forecast | Geographic Relevance | Impact Timeline |
|---|---|---|---|
| Inflation-linked premium growth | +1.2% | California, Texas, Florida, nationwide | Short term (≤ 2 years) |
| Telematics and usage-based insurance uptake | +0.8% | National, early leadership in Progressive and State Farm states | Medium term (2-4 years) |
| Federal Reserve rate tailwinds | +0.6% | National | Short term (≤ 2 years) |
| AI-driven underwriting and claims efficiency | +0.4% | Concentrated in major carriers | Long term (≥ 4 years) |
| Embedded insurance partnerships | +0.3% | Automotive and technology hubs | Medium term (2-4 years) |
| Rising cyber-liability demand | +0.2% | Technology and financial centers | Long term (≥ 4 years) |
| Source: Mordor Intelligence | |||
Heightened Inflation-Linked Premium Growth
Property insurance rates moved sharply higher in 2024 as insurers sought to align pricing with surging replacement-cost inflation, driving double-digit increases in catastrophe-exposed regions. Players leaned on real-time rating engines that adjust for commodity and labor inputs, creating a spread between preferred and distressed risks. The strategy strengthened underwriting margins and accelerated premium recognition while limiting new-business volumes. Customers with strong risk profiles benefited from modest adjustments, whereas challenged classes faced rapid escalation, reshaping acquisition tactics across the property and casualty insurance market. Ongoing building-cost inflation suggests that rate discipline will remain central to earnings stability through 2026.
Surging Telematics and UBI Adoption
Progressive disclosed that more than 60% of new auto policies now include telematics participation, signaling mainstream acceptance of usage-based insurance[1]Progressive Corporation, “2024 Annual Report,” progressive.com . Behavioral data enables granular segmentation, lowering loss ratios and permitting competitive pricing for low-risk drivers. Berkshire Hathaway reported growth in auto underwriting profit, attributing the gain to data-driven risk selection and individualized pricing. Machine-learning fraud analytics further trim claim leakage, saving players 15-20% on suspicious losses. As telematics spreads into commercial fleets, premium volume in the property and casualty insurance market is expected to follow miles driven rather than static vehicle counts, changing forecasting models for auto segments.
Fed-Rate Tailwinds Boosting Investment Income
Average portfolio yields climbed to 4.2% by December 2024, doubling the 2021 level and enhancing combined-ratio tolerance for multiline players[2]Federal Reserve, “Monetary Policy Release December 2024,” federalreserve.gov. Incremental investment income allows insurers to compete aggressively in growth areas while still meeting return-on-equity targets. Balance-sheet managers are laddering maturities and adding floating-rate positions to mitigate duration risk, should future hikes materialize. Firms with in-house asset managers are capturing liquidity premiums unavailable to peers, widening spread income by 20-30 basis points. The structural shift in yields underpins sustainable earnings growth for the property and casualty insurance market through the forecast horizon.
AI-Led Underwriting and Claims Efficiency Gains
Ninety-nine percent of surveyed players have active generative-AI programs that automate routine claims from first notice to settlement within hours[3]International Risk Management Institute, “2024 Insurance Market Conditions,” irmi.com. Early adopters reported 25-30% loss-ratio improvement within 18 months of deployment. AI systems evaluate thousands of variables simultaneously, reducing human bias and adverse selection. On the claims side, computer vision accelerates damage appraisal while predictive fraud scores route high-risk files to specialist teams. Cost savings flow through expense ratios, giving technology leaders pricing flexibility that extends competitive advantage across the property and casualty insurance market.
Restraints Impact Analysis*
| Restraint | ( ~ ) % Impact on CAGR Forecast | Geographic Relevance | Impact Timeline |
|---|---|---|---|
| Escalating catastrophe losses and reinsurance costs | -1.1% | Coastal states, California, Florida | Short term (≤ 2 years) |
| Reserve adequacy and loss-cost inflation | -0.8% | Nationwide | Medium term (2-4 years) |
| Nuclear-verdict social inflation | -0.6% | Plaintiff-friendly jurisdictions | Long term (≥ 4 years) |
| Increasing frequency of secondary perils | -0.4% | Midwest and Southeast | Medium term (2-4 years) |
| Source: Mordor Intelligence | |||
Escalating Catastrophe Losses & Reinsurance Costs
Insured natural-disaster losses touched USD 154 billion globally in 2024, with California wildfires alone accounting for up to USD 40 billion. Reinsurance treaty renewals reflected 15-25% rate hikes for catastrophe-exposed programs, compelling primary insurers either to cede more risk or pass higher costs to policyholders. The California FAIR Plan now carries USD 458 billion of exposure against USD 200 million of surplus, illustrating systemic stress in residual markets. Elevated catastrophe frequency is pressuring the property and casualty insurance market to adopt real-time modeling and dynamic pricing to maintain solvency margins.
Nuclear-Verdict Driven Social Inflation
Liability claim severity is rising 7% annually, propelled by expanded litigation funding and plaintiff-friendly venues. Commercial auto verdicts exceeding USD 10 million have shifted loss-cost curves, forcing players to trim limits and raise attachment points. Capacity in umbrella layers contracted 30-40% for high-risk sectors, with rate increases surpassing 35% in certain jurisdictions. Unless tort-reform momentum accelerates, social inflation will continue to erode underwriting margins across the property and casualty insurance market.
*Our forecasts treat driver/restraint impacts as directional, not additive. The impact forecasts reflect baseline growth, mix effects, and variable interactions.
Segment Analysis
By Insurance Line: Commercial Auto Maintains Leadership
Commercial auto generated 45.12% of 2025 direct premiums, anchoring the property and casualty insurance market through mandatory coverage requirements and escalating freight activity. Telematics-enabled fleets provide a data-rich environment that supports individualized pricing, restraining loss-ratio deterioration in a segment historically plagued by severity inflation. Specialty lines such as cyber, marine, inland, and surety are forecast to grow at a 5.54% CAGR through 2031 as businesses confront new digital and supply-chain risks. The property and casualty insurance market size for specialty products is expected to broaden meaningfully as federal infrastructure spending drives surety-bond demand.
Homeowners writers are curbing catastrophe-prone exposure, while private passenger auto faces parts-inflation headwinds that squeeze underwriting margins. Workers’ compensation continues its profitable run with a seventh consecutive combined ratio below 90% in 2024. Liability lines struggle under social-inflation pressure, pushing rate increases into the high single digits as players defend reserve strength. Surety growth is amplified by the USD 1.2 trillion Infrastructure Investment and Jobs Act, which requires performance guarantees on federally funded projects and expands the property and casualty insurance market share for bond specialists.


By Distribution Channel: Independent Agents Remain Pivotal
Independent agents and brokers captured 64.02% of the 2025 written premium, sustaining the relationship-centric fabric of the property and casualty insurance market. Their advisory role is valued in complex risk transfers, even as player self-service portals gain traction. Revenue data show that 75% of agencies posted top-line growth in 2024 despite a modest decline in total agency count. Digital platforms, however, are scaling at a 6.25% CAGR, converting price-sensitive buyers through streamlined interfaces and instantaneous binding.
Traditional agents are embracing e-signature and marketing-automation tools to preserve relevance, while captives battle margin compression as parent companies double down on direct-to-consumer spending. Wholesale and MGA channels profit from admitted-market capacity strain, funneling distressed classes into excess and surplus lines. The competitive interplay is broadening the property and casualty insurance market size available to tech-enabled intermediaries without eliminating the critical consultative role of local agents.
By Customer Segment: Personal Lines Hold Scale Advantage
Personal lines accounted for 50.05% of 2025 premiums, offering dependable cash flows and cross-sell potential in auto-home bundles. Catastrophe exposure continues to challenge profitability, yet mandatory auto coverage ensures baseline demand across economic cycles. Small commercial business is projected to expand at a 4.49% CAGR to 2031, propelled by simplified digital onboarding and embedded-insurance partnerships that lower acquisition costs. These gains are lifting the segment’s property and casualty insurance market share within a fragmented small-business universe.
Middle-market and large-commercial buyers face tighter underwriting scrutiny as nuclear verdict trends inflate casualty limits. Specialized accounts requiring global program coordination draw on the technical strength of multiline players, supporting premium adequacy despite competitive pressures. Expanded Small Business Administration bonding thresholds are stimulating surety issuance among trades previously underserved, enlarging the property and casualty insurance market size for bonding solutions.
Geography Analysis
New York contributed 32.10% of national premiums in 2025 and is projected to grow at a 4.28% CAGR through 2031, buoyed by balanced regulatory oversight and a diverse economic base. Dense urban property concentrations and a vibrant financial sector foster steady demand for liability, property, and specialty coverages. Legislative reforms encouraging rate adequacy have attracted additional players, keeping capacity ample and pricing disciplined.
California’s market contrasts sharply. Wildfire exposure and pricing constraints have driven major writers to curtail new business, increasing FAIR Plan policies by 276% between 2018 and 2024. Commissioner mandates requiring players to serve distressed zones seek to restore balance but face resistance over the capital strain. Texas premiums surged on severe-weather losses; homeowners' rates climbed 54.5% over five years and continue to outpace national averages. Florida shows tentative stabilization following 2023 tort reforms that curbed assignment-of-benefits abuse, attracting new entrants despite persistent hurricane volatility.
Growth pockets are emerging in the Mountain West and Southeast states as population migration fuels housing starts and vehicle registrations. However, rising secondary-peril frequency—hail, convective storms and flash floods—requires refined catastrophe modeling to sustain profitability. Geographic diversification remains a core strategic hedge, prompting players to redeploy capital from stressed coastal zones into interior markets where regulatory regimes permit risk-based pricing. The dynamic reinforces the importance of state-specific legislative and judicial climates in shaping the property and casualty insurance market.
Competitive Landscape
The ten largest players controlled more than half of direct premiums in 2024, indicating moderate concentration, while the top five auto insurers captured the majority of the segment premium, up 110 basis points from 2023. Scale economies in data analytics, marketing spends, and reinsurance purchasing continue to widen performance gaps. Progressive grew premiums 24.5% in 2024 by exploiting telematics and direct distribution prowess.
Strategic focus is diverging. Growth-oriented insurers are investing heavily in AI underwriting platforms, while profit-centric players are pruning unprofitable books and reallocating capital to specialty lines with disciplined rate adequacy. Embedded-insurance alliances with retailers and automakers open fresh revenue lanes for agile players, whereas laggards risk ceding share in fast-scaling niches such as cyber. M&A activity, exemplified by Marsh McLennan’s USD 7.75 billion purchase of McGriff Insurance Services, underscores the quest for distribution breadth and middle-market penetration. Smaller regional insurers face escalating technology costs that challenge standalone competitiveness, encouraging affiliation or niche specialization to remain viable within the property and casualty insurance market.
United States Property and Casualty Insurance Industry Leaders
State Farm Mutual Automobile Insurance Co.
Berkshire Hathaway Inc. (GEICO, National Indemnity)
The Progressive Corp.
Allstate Corp.
Liberty Mutual Holding Co.
- *Disclaimer: Major Players sorted in no particular order

Recent Industry Developments
- June 2025: Brown & Brown completed its acquisition of Risk Strategies and parent Accession, expanding its commercial brokerage footprint.
- February 2025: Nationwide agreed to buy Allstate’s employer stop-loss line for USD 1.25 billion, with closing expected in H2 2025.
- January 2025: SageSure acquired GeoVera Advantage Insurance Services, expanding catastrophe-exposed property capacity in California.
- March 2025: NAIC released its 2025 federal legislative agenda advocating for state regulatory primacy and catastrophe-resilience funding.


Research Methodology Framework and Report Scope
Market Definitions and Key Coverage
Our study defines the United States property & casualty (P&C) insurance market as the aggregate gross written and net written premiums generated by insurers that underwrite coverages protecting physical property and legal liabilities, including homeowners, private and commercial auto, commercial property, workers' compensation, general liability, and emerging specialty lines such as cyber.
Scope exclusion: life, annuity, and stand-alone health products fall outside this assessment.
Segmentation Overview
- By Insurance Line
- Homeowners
- Private Passenger Auto
- Commercial Auto
- Commercial Property
- Workers' Compensation
- General Liability
- Specialty (Cyber, Marine, Inland, Surety)
- By Distribution Channel
- Direct
- Independent Agents / Brokers
- Captive Agents
- Bancassurance
- Digital / Insurtech Platforms
- Wholesale / MGAs
- By Customer Segment
- Personal Lines
- Small Commercial (SME)
- Middle-Market Commercial
- Large Commercial & Specialty
- By Region
- California
- Texas
- Florida
- New York
- Others
Detailed Research Methodology and Data Validation
Primary Research
Mordor analysts conducted structured interviews and surveys with underwriting heads, actuarial chiefs, independent agents, MGAs, and insure-tech founders across California, Texas, New York, Illinois, Florida, and the Midwest. These discussions validated rate-change assumptions, digital-channel penetration, catastrophe normalization factors, and forward pricing sentiment that were only partially visible in public data.
Desk Research
We began by mapping publicly available regulatory and statistical sources, such as NAIC statutory statements, the Insurance Information Institute, the Federal Reserve's Financial Accounts, the U.S. Bureau of Economic Analysis, and select state insurance department databases, which give foundational premium totals, loss ratios, and macro indicators. These were complemented by sector commentary gathered from reputable business press, carrier 10-K filings, investor decks, and trade-association white papers.
To deepen competitive and financial intelligence, analysts tapped paid datasets within Mordor's tool kit, notably D&B Hoovers for carrier financials and Dow Jones Factiva for real-time news flow. Many other secondary inputs aided triangulation; the list above is illustrative, not exhaustive.
Market-Sizing & Forecasting
A top-down build starts with 2024 net written premiums reported to regulators, which are then projected through 2030 by linking premium pools to drivers such as housing starts, vehicle miles traveled, payroll growth, catastrophe-adjusted insured loss trends, interest-rate-sensitive investment income, and average filed rate changes. Select bottom-up checks, sampled carrier ASP × policy-count roll-ups and broker channel audits, help sanity-check totals. Forecasts employ multivariate regression blended with ARIMA to capture both structural and cyclical effects; scenario analysis adjusts for regulatory shocks or outsized catastrophe years before the numbers are finalized.
Data Validation & Update Cycle
Outputs pass a three-layer review: automated variance scans, peer review by a senior analyst, and final sign-off from the insurance practice lead. We refresh the full model annually and trigger interim updates if quarterly statutory filings, large-loss events, or material rate-filing shifts move the market by more than two percentage points.
Why Mordor's US Property And Casualty Insurance Industry Size & Share Analysis Baseline Earns Decision-Maker Trust
Published estimates differ because firms select varying premium bases, include or omit specialty classes, apply divergent catastrophe loadings, and refresh at different cadences. By anchoring on uniform statutory data, verifying with live carrier feedback, and updating each year, Mordor delivers a balanced, transparent baseline buyers can reliably track.
Benchmark comparison
| Market Size | Anonymized source | Primary gap driver |
|---|---|---|
| USD 1.10 trillion (2025) | Mordor Intelligence | - |
| USD 733.03 billion (2025) | Global Consultancy A | Excludes commercial specialty lines and uses booked, not written, premiums |
| USD 890 billion (2024) | Research Journal B | Stops at personal and small-commercial segments; older base year |
In short, competitors often narrow the scope or rely on lagged data, whereas Mordor's disciplined blend of timely regulatory filings and frontline validation yields a dependable view that decision-makers can use with confidence.


Key Questions Answered in the Report
What is the current size of the United States property and casualty insurance market?
The market stands at USD 1.14 trillion in 2026 and is forecast to reach USD 1.39 trillion by 2031, implying a 3.91% CAGR.
How dominant are independent agents in U.S. property and casualty distribution?
Independent agents and brokers held 64.02% of 2025 written premium, far outpacing digital channels despite the latter’s 6.25% CAGR growth
What factors are driving the rapid uptake of telematics programs?
Behavior-based pricing lowers loss ratios and offers personalized discounts, prompting 60% of Progressive’s new auto customers to enroll in 2024.
Which state currently commands the largest share of U.S. property and casualty premiums?
New York leads with 32.10% of national premiums and is forecast to grow at a 4.28% CAGR through 2031.
Page last updated on:


