Market Overview
| Study Period | 2020 - 2031 |
|---|---|
| Forecast Data Period | 2026 - 2031 |
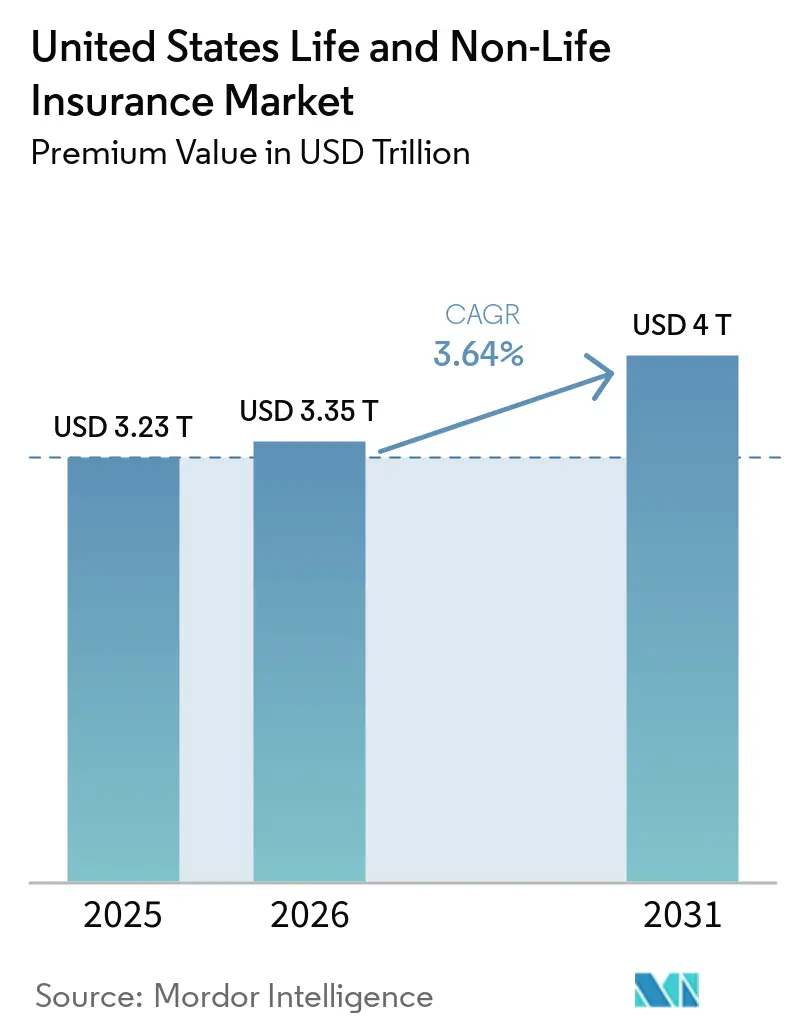
| Base Year Market Size (2025) | USD 3.23 Trillion |
| Market Size (2026) | USD 3.35 Trillion |
| Market Size (2031) | USD 4 Trillion |
| Growth Rate (2026 - 2031) | 3.64% CAGR |
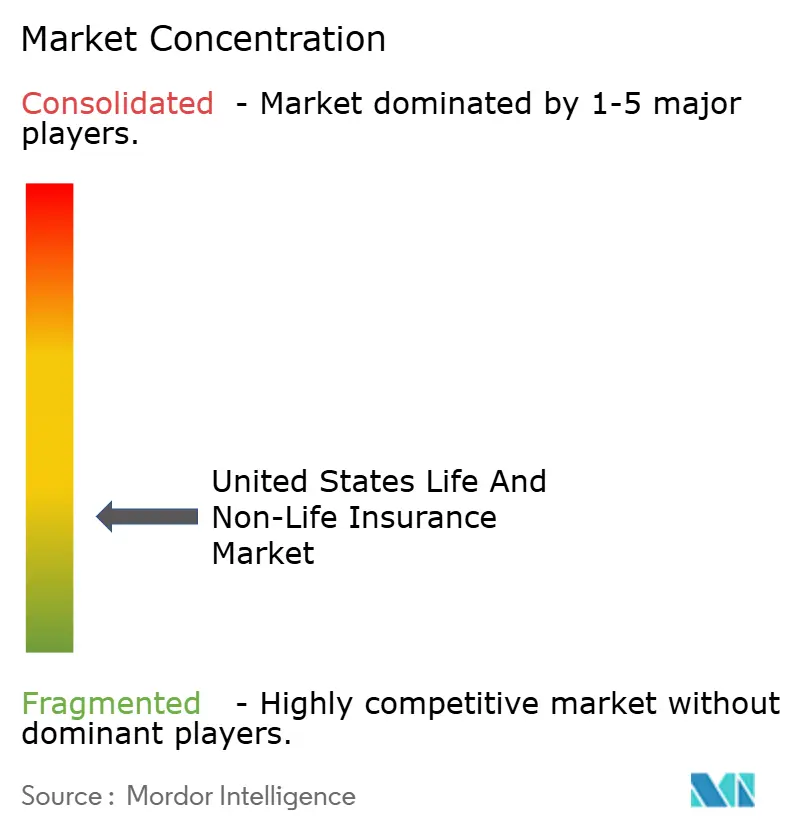
| Market Concentration | Low |
Major Players *Disclaimer: Major Players sorted in no particular order Image © Mordor Intelligence. Reuse requires attribution under CC BY 4.0. | |
United States Life and Non-Life Insurance Market Analysis by Mordor Intelligence
The United States Life And Non-Life Insurance Market size in terms of premium value was valued at USD 3.23 trillion in 2025 and is estimated to grow from USD 3.35 trillion in 2026 to reach USD 4 trillion by 2031, at a CAGR of 3.64% during the forecast period (2026-2031).
This growth path reflects rising health spending, stable to firm pricing in catastrophe-exposed property lines, and selective recovery in personal auto as loss-cost inflation moderates from prior peaks. The non-life segment anchors the base through sustained demand for accident and health coverage, supported by the federal outlook for national health expenditures and steady Medicare Advantage participation alongside Part D program redesign in 2026. Property and casualty dynamics continue to balance exposure to severe convective storms and wildfire events with disciplined underwriting and adjustments in reinsurance structures, which maintain rate adequacy in cat-prone areas even as affordability remains a concern. Personal auto premiums retreated in 2025 after a sharp upswing through 2024, yet repair expenses tied to ADAS components and higher EV repair costs keep pressure on claims severity and pricing decisions through the cycle. At the same time, regulatory change in Medicare Advantage risk adjustment and pharmacy benefit design, along with growing state oversight of AI in underwriting and claims, continues to influence product design, operations, and capital allocation across the United States life and non-life insurance market.
Key Report Takeaways
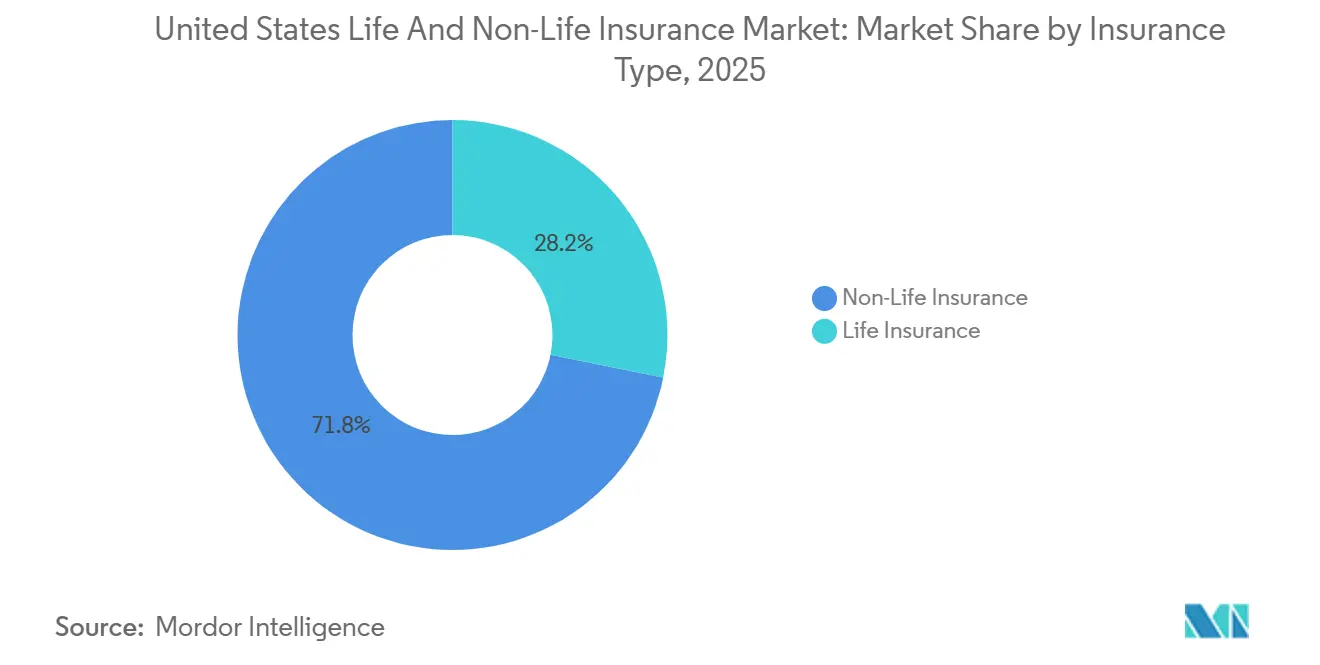
- By insurance type, non-life insurance accounted for 71.84% of the United States life and non-life insurance market share in 2025, whereas the non-life insurance (health-led) segment is advancing at a 5.37% CAGR through 2031.
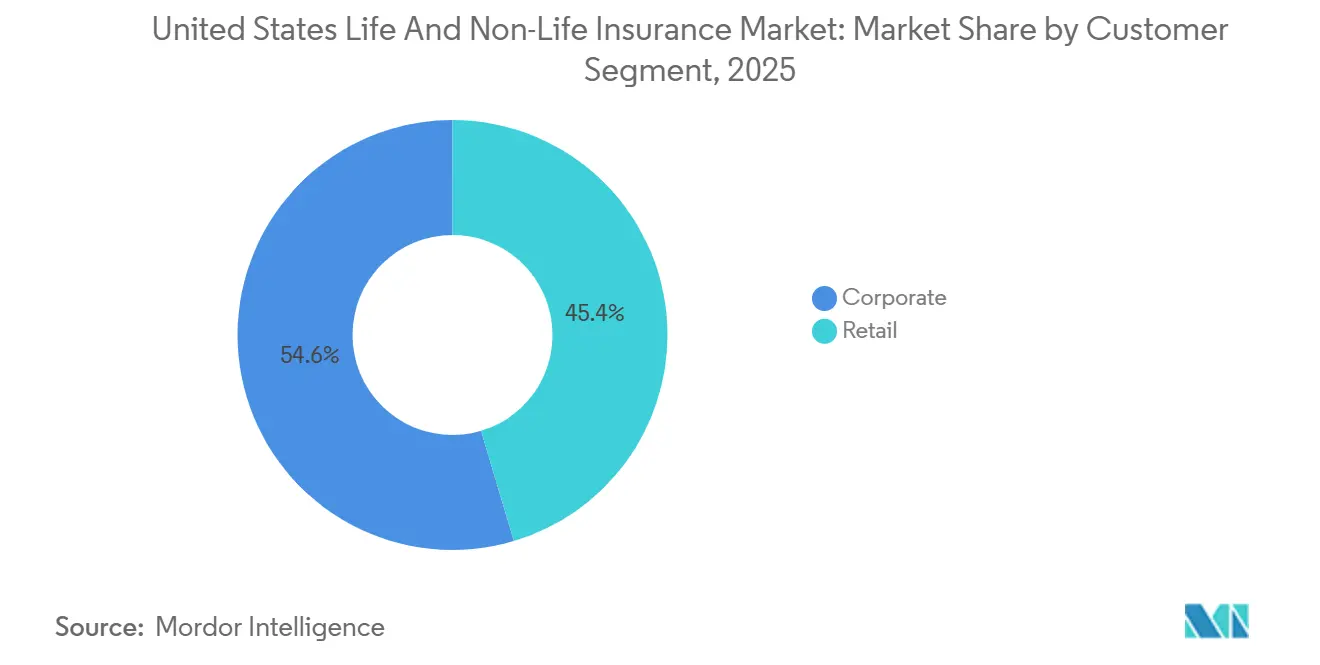
- By customer segment, corporate policyholders held 54.62% of the United States life and non-life insurance market share in 2025, while the retail segment is climbing at a 4.48% CAGR through 2031.
- By distribution channel, brokers retained 61.53% share of the United States life and non-life insurance market in 2025, whereas direct sales (digital/direct-to-consumer) channels are advancing at a 7.46% CAGR through 2031.
- By geography, the South led with 36.27% share of the United States life and non-life insurance market in 2025, and is projected to register the highest 4.12% CAGR through 2031.
Note: Market size and forecast figures in this report are generated using Mordor Intelligence’s proprietary estimation framework, updated with the latest available data and insights as of 2026.
United States Life and Non-Life Insurance Market Trends and Insights
Drivers Impact Analysis*
| Driver | (~) % Impact on CAGR Forecast | Geographic Relevance | Impact Timeline |
|---|---|---|---|
| Health spending growth drives accident and health premiums | +1.2% | National, particularly strong in Medicare Advantage-dense states (CA, FL, TX, NY) | Medium term (2-4 years) |
| Natural catastrophes and storms maintain P&C rate adequacy | +0.9% | National, with acute impact in the South and West regions exposed to hurricanes, wildfires, and tornadoes | Short term (≤ 2 years) |
| Auto loss-cost inflation leads to premium adjustments | +0.7% | National, with elevated impact in states with high EV adoption and urban centers (CA, TX, FL, WA) | Medium term (2-4 years) |
| Medicare Advantage and Part D redesign expands premiums | +0.6% | National, with concentration in states with high MA penetration (FL, CA, AZ, PA) | Medium term (2-4 years) |
| LDTI repricing reshapes life products and earnings patterns | +0.3% | National, primarily affecting large life insurers and reinsurers | Long term (≥ 4 years) |
| State AI governance accelerates model governance investments | +0.2% | State-specific initially (CO, NY, CA), with national spillover as NAIC model bulletin adoption spreads | Long term (≥ 4 years) |
| Source: Mordor Intelligence | |||
Health spending growth drives accidents and health premiums
National health expenditures reached USD 5.3 trillion in 2024 and are projected to continue rising through the next decade, reinforcing premium growth across accident and health lines as the cost trend pushes benefit values and risk charges higher in both commercial and government programs. CMS finalized a 5.06% average payment increase for Medicare Advantage in 2026, which supports revenue growth even as the risk adjustment transition to the v28 model lowers risk scores by 3.01% versus the prior blend. The Inflation Reduction Act’s Part D redesign for 2026 adds a USD 2,100 annual out-of-pocket cap for beneficiaries and revises liability shares across plan sponsors, manufacturers, and the federal reinsurance program, which changes the risk profile and pricing assumptions for drug coverage. Marketplace dynamics also factor in as plan premiums shift with utilization, subsidy design, and prescription drug mix, while employer family premiums reported by national surveys in 2025 highlighted continued increases borne by both employers and workers. Together, these forces sustain premium momentum in accident and health lines across the United States life and non-life insurance market as payers adapt to benefit redesign, regulatory oversight, and a mix of older and higher-acuity populations in public coverage.
Natural catastrophes and storms maintain P&C rate adequacy
The United States has carried the largest share of global insured catastrophe losses in recent years, with 2024 outcomes sustaining underwriting discipline and reinsurance demand in property programs exposed to wind, wildfire, and severe convective storms. Federal climate and weather data show a high cadence of billion-dollar convective storm events, which concentrates attention on risk selection, deductibles, and mitigation requirements to keep capacity aligned with exposure. California’s early 2025 wildfire experience illustrates capacity strain and the need for refined underwriting in wildland-urban interface zones with enhanced prevention and resilience investments [1]California Department of Insurance Editors, “Wildfire Insurance Resources,” California Department of Insurance, insurance.ca.gov. January renewals in 2025 reflected firmness in catastrophe-exposed reinsurance layers, with pricing and attachment adjustments that shift more retained risk to primary carriers and reinforce the need for balanced retentions. These conditions support rate adequacy in property and casualty lines and shape portfolio strategies across the United States life and non-life insurance market as carriers manage affordability, coverage terms, and capacity placement in exposed counties.
Auto Loss-Cost Inflation Leads to Premium Adjustments
Personal auto premiums declined in 2025 after sharp increases through 2024, yet carriers continue to face elevated loss costs tied to parts, labor, and technology-enabled repairs that increase claim severity and cycle time. Advanced driver-assistance systems increase repair complexity because sensors and cameras embedded in windshields, bumpers, and panels require calibration and higher-cost components, which raises the cost of collision repairs even when frequency moderates [2]National Highway Traffic Safety Administration Editors, “Road Safety and ADAS Resources,” National Highway Traffic Safety Administration, nhtsa.gov. Electric drivetrain and high-voltage system requirements also shape repair economics for newer vehicles, which keeps insurer attention on parts availability, technician capacity, and safety protocols during repairs. Theft trends improved from prior peaks in 2025, yet patterns remain uneven by model and region, which keeps anti-theft measures and recovery technologies in underwriting and pricing considerations. Commercial auto liability trends remain sensitive to litigation and injury severity, which supports disciplined pricing and attachment decisions even as telematics adoption expands. These dynamics sustain investment in usage-based insurance, segmentation, and claims automation across the United States life and non-life insurance market to align premiums with risk and manage volatility over the medium term.
State AI Governance Accelerates Model Governance Investments
Colorado enacted a comprehensive AI law covering consequential decisions that include insurance underwriting, pricing, and claims, with an effective date of June 30, 2026, which sets out duties of care for testing, documentation, disclosures, and bias risk mitigation [3]Colorado General Assembly Staff, “SB 24-205 Consumer Protections for Artificial Intelligence,” Colorado General Assembly, leg.colorado.gov. The NAIC Model Bulletin on AI Systems sets expectations for AI governance, model inventory, validation, and third-party oversight, and it is being adopted across multiple states to guide examinations and supervisory reviews. New York’s Department of Financial Services issued Circular Letter No. 7 in 2024, which requires testing, validation, and adverse decision rationales for AI-enabled underwriting and pricing systems in consumer lines. These measures shape investment in explainability, data quality, and fairness testing, and they influence vendor selection and contract terms for AI-based services used by carriers and distributors. Model governance now operates as a competitive capability in the United States life and non-life insurance market because it manages regulatory risk and improves trust in digital channels.
Restraints Impact Analysis*
| Restraint | (~) % Impact on CAGR Forecast | Geographic Relevance | Impact Timeline |
|---|---|---|---|
| The cat reinsurance hard market and capacity constraints pressure affordability | -0.6% | National P&C market, with acute pressure in cat-exposed states (FL, CA, TX, LA) | Short term (≤ 2 years) |
| Social inflation elevates liability severity across commercial lines | -0.8% | National, with hotspots in plaintiff-friendly jurisdictions (TX, CA, PA, FL, NY) | Medium term (2-4 years) |
| Medicaid redetermination reduces managed care enrollment, shifts risk pools | -0.5% | National, most pronounced in non-expansion states and those with higher procedural disenrollments (TX, FL, GA, MT) | Medium term (2-4 years) |
| MA risk model changes and Part D liability shift compress plan margins | -0.4% | National Medicare Advantage and Part D market | Medium term (2-4 years) |
| Source: Mordor Intelligence | |||
Social Inflation Elevates Liability Severity Across Commercial Lines
Behavioral research shows that juror attitudes toward punitive damage and corporate responsibility have shifted since 2016, which correlates with more severe liability outcomes and higher settlement benchmarks across certain venues. Commercial auto and general liability lines exhibit sensitivity to this trend, which prompts insurers to adjust attachment points, re-underwrite higher-risk classes, and expand claims analytics to identify early-stage severity risk indicators. Carriers are also investing in defense strategies that emphasize early resolution, expert selection, and trial preparedness to avoid nuclear verdict exposure in jurisdictions with a history of large awards. Rate adequacy remains a focus, and underwriting discipline helps stabilize combined ratios even as frequency and severity interact with economic and social trends. The net effect is a drag on growth in the United States life and non-life insurance market because increased liability costs lift pricing requirements and can reduce available capacity for classes most exposed to large verdict outcomes.
Medicaid Redeterminations Reduce Managed Care Enrollment, Shift Risk Pools
The unwinding of continuous enrollment beginning in 2023 led to large disenrollments through 2024 and into 2025, most of which were procedural, and this reshaped the composition of remaining Medicaid-covered populations and capitation dynamics for managed care. CMS reported lower aggregate enrollment by late 2025 relative to the pandemic peak, which reduced total spending growth at the program level while shifting cost burdens to states as enhanced federal matching phased down. Evidence from California showed an increase in uninsured emergency department visits after redetermination, which indicates that some disenrolled individuals did not transition to exchange coverage and that safety net providers absorbed more uncompensated care. State-level data demonstrate modest Marketplace take-up among those referred from Medicaid, which underscores the barrier effects of administrative processes on continuous coverage. These shifts pressure accident and health plan margins and require recalibration of networks, care management, and pricing across the United States life and non-life insurance market as program eligibility and budget settings evolve.
*Our forecasts treat driver/restraint impacts as directional, not additive. The impact forecasts reflect baseline growth, mix effects, and variable interactions.
Segment Analysis
By Insurance Type: Health-Led Growth Powers Non-Life Dominance
Non-life commanded 71.84% of the United States life and non-life insurance market in 2025, whereas the non-life insurance (health-led) segment is advancing at a 5.37% CAGR through 2031. Health coverage remains the central growth engine as national health expenditures rise and Medicare programs adjust benefits and plan payments in 2026. Property business reflects the interaction of exposure growth and severe weather patterns, and underwriting and reinsurance structures continue to support pricing power in catastrophe-prone areas subject to regulatory oversight on affordability. Personal auto premiums eased in 2025, yet claims severity reflects ADAS calibrations, labor rates, and parts trends that require refined segmentation and telematics to improve alignment between price and risk. Within the United States life and non-life insurance market, health, property, and auto together define the near-term premium path as carriers calibrate retention, capital, and distribution to protect earnings stability. These dynamics keep non-life in a leadership position while life portfolios adapt to the new accounting regime and to interest rate sensitivity that affects product economics.
Health insurance spans employer-sponsored benefits, individual marketplaces, Medicare Advantage, and Medicaid managed care, each with distinct pricing and utilization profiles that influence aggregate premium growth and margin patterns. Property carriers manage concentration risk and catastrophe exposure through reinsurance, geographic diversification, and increased use of deductibles and mitigation requirements to maintain availability, particularly in coastal and wildfire-prone areas. Auto lines invest in claims automation and straight-through processing to reduce cycle times, and they deploy usage-based insurance to mitigate affordability pressure while guiding safer behavior. Life insurers balance earnings with capital by tilting toward indexed and variable annuities and simplified term life sold via digital channels and advisory networks, seeking lower guarantee risk and better fee-based income across the cycle. Taken together, these shifts support steady gains in the United States life and non-life insurance market even as carriers refine product portfolios to reduce volatility and sustain consumer access.


By Customer Segment: Retail Gains Ground as Gig Economy and Direct Channels Expand
Corporate accounts held 54.62% of the United States life and non-life insurance market in 2025, reflecting the weight of employer health, commercial property, commercial auto, and group benefits in the premium base. Employers faced average family premiums of USD 26,993 in 2025, which sharpened focus on plan design, high-cost drug management, and network contracting that can improve cost and quality outcomes for covered employees. Corporate buyers rely on broker intermediation and analytics to place complex risks and to align coverage structures with risk tolerance, retention, and financing options, including captives, when market conditions warrant. Commercial property and liability placements continue to reflect severe weather and social inflation pressures, which require careful limit setting and attachment calibration. These corporate dynamics maintain a sizable share for enterprise buyers within the United States life and non-life insurance market, as rate adequacy and capacity allocation remain important to sustained coverage availability.
The retail segment is projected to grow faster at 4.48% through 2031 as individual enrollment expands in exchanges and Medicare Advantage, and as direct-to-consumer distribution improves shopping and service convenience. Marketplace participation increased in 2025, and plan choices and subsidy levels interact with utilization and pharmacy mix to shape premium trends and churn dynamics. In Medicare Advantage, the 2026 payment update provides support while risk model and Part D redesign changes push plans toward tighter benefit and formulary management to preserve margins and quality performance. Personal auto rate relief in 2025 improves affordability, and usage-based programs, mobile claims tools, and streamlined service support retention across demographics that prefer digital-first interactions. These elements together expand the retail footprint within the United States life and non-life insurance market as digital origination and service models gain traction with consumers.
By Distribution Channel: Direct Sales Surge as Digital and Embedded Models Disrupt Brokers
Brokers accounted for 61.53% of distribution in 2025, anchored by complex commercial risk placements, global program coordination, and employee benefits consulting that require tailored coverage and claims advocacy. Reinsurance and alternative risk transfer capabilities at global brokers support capacity access and multi-layer program design for catastrophe and specialty exposures. Agents remain prominent in personal lines and small commercials through local advice, bundling, and service that helps reduce churn. Bank and affinity channels enhance reach for credit-related products and embedded micro-covers that are packaged with financial services. These channels remain central in the United States life and non-life insurance market, where complexity and service needs outweigh simple price discovery.
Direct sales are the fastest-growing channel at 7.46% through 2031 as automated underwriting, instant quotes, and digital claims experiences expand across auto, renters, term life, and travel insurance. Embedded insurance at point-of-sale on e-commerce and platform ecosystems improves conversion and lowers acquisition costs by matching coverage to purchase context. Program administrators and delegated underwriting authorities expand product reach in niche segments, aligning carrier capacity with specialized risk selection and technology-driven workflows. As state expectations for AI governance grow, carriers and distributors strengthen model inventories, validation, and disclosures to balance speed and control in digital channels. These forces align channel economics with product design and support consistent gains for direct and embedded approaches across the United States life and non-life insurance market.
Geography Analysis
The South captured 36.27% of the United States life and non-life insurance market in 2025 and is projected to grow at a 4.12% CAGR through 2031, aided by population in-migration, housing formation, and retiree inflows that lift health and property exposures. Exposure to hurricanes and severe convective storms keeps property pricing firm and reinforces investments in mitigation, flood risk management, and resilient construction standards to stabilize loss outcomes. Residual market participation in Florida is elevated, which reflects both litigation reform effects and ongoing capacity and pricing constraints in coastal counties. Medicare Advantage enrollment is large in several Southern states, and the 2026 payment update supports plan revenue while v28 and Part D redesign changes push toward care and pharmacy management improvements. These southern-region attributes contribute to consistent gains in the United States life and non-life insurance market as demographics and exposure patterns align with premium growth.
The West faces volatility from wildfire and heavy precipitation that shape underwriting appetite, product terms, and the balance between admitted and surplus lines capacity in exposed counties. Reinsurance continues to anchor capacity outcomes, and attachment and pricing decisions in January renewals influence carrier retentions and coverage availability across property programs. Health coverage dynamics vary across Western states, and exchange participation and network structures affect accident and health premiums and member experience. State AI governance creates additional model validation and disclosure requirements, which change the compliance investment profile for digital distribution and claims operations. These conditions shape a measured yet resilient trajectory within the United States life and non-life insurance market as carriers manage event-driven volatility.
The Northeast and Midwest show steady demand supported by employer coverage, Medicare programs, and diversified economies that help balance risk across personal and commercial lines. Property results are more stable outside severe storm corridors, and reinsurance and mitigation strategies continue to manage accumulation risk and event exposure. Regulatory oversight remains robust, which sustains consumer protections and conservative rate practices that influence pricing cycles. Accident and health premiums track to utilization and pharmacy trends, with public program design changes affecting plan bids and benefits each year. Together, these regional features maintain a stable base of premium and exposure within the United States life and non-life insurance market.
Competitive Landscape
The United States life and non-life insurance market remains moderately fragmented, with diversified national carriers, regional specialists, and multiline groups competing across health, property, auto, and life. UnitedHealth Group leads in health coverage with significant Medicare Advantage, employer, and Medicaid footprints and integrates plan and care delivery capabilities to strengthen cost and quality performance. The group’s 2025 disclosures underscore the influence of risk adjustment changes and Part D redesign on plan bids, benefits, and margin outlooks for 2026. Berkshire Hathaway, through GEICO and General Re, emphasizes underwriting discipline, direct personal lines distribution, and telematics adoption to improve segmentation and loss performance. Property carriers continue to refine reinsurance programs and appetite in catastrophe-exposed states to manage capital and volatility.
Strategic moves emphasize vertical integration in health, data-enabled underwriting, and scaled model governance. Health insurers continue to invest in care management, home and ambulatory services, and pharmacy capabilities to bend cost trends, align network incentives, and improve Star Ratings under evolving federal rules. Property carriers leverage capital markets and multi-layer reinsurance designs to diversify risk transfer and align retentions with rate adequacy in regions exposed to hurricanes, wildfires, and convective storms. Carriers and MGAs deploy claims automation tools and digital FNOL pathways to reduce cycle times and improve customer experience in auto and home while documenting and validating models to meet AI governance standards. In life and annuities, portfolios tilt toward indexed and variable designs that carry less guaranteed risk and more fee income, which is better aligned with LDTI earnings dynamics.
Company disclosures and regulatory filings highlight investments that reshape cost structures and growth edges. UnitedHealth Group continues to integrate care delivery and pharmacy capabilities to manage the total cost of care and strengthen plan value propositions in Medicare Advantage and employer segments. Berkshire Hathaway reports progress on telematics adoption at GEICO, which supports improved segmentation and claims management in personal auto. Property carriers in California adjusted underwriting and capacity following early 2025 wildfire events, illustrating how event shocks propagate into pricing and availability through mid-year and January renewals. These strategic responses reinforce operational resilience and disciplined growth across the United States life and non-life insurance market.
United States Life and Non-Life Insurance Industry Leaders
UnitedHealth Group
CVS Health (Aetna)
Elevance Health
Humana
Centene
- *Disclaimer: Major Players sorted in no particular order

Recent Industry Developments
- February 2026: Concirrus introduced Concirrus Inspire, an AI-native underwriting platform designed to optimize specialty insurers' operations by streamlining workflows, embedding automation, and enabling data-driven decisions, ensuring scalability, operational clarity, and alignment with organizational objectives across the underwriting lifecycle.
- February 2026: Markel Group Inc.'s insurance division partnered with Upfort to offer eligible United States cyber policyholders advanced tools, including the AI-powered Upfort Shield platform and an endpoint detection and response solution, enhancing cyber threat protection and breach risk mitigation.
- January 2026: American International Group (AIG) announced a USD 3.5 billion partnership with CVC Capital Partners, committing USD 2 billion to CVC-managed funds and USD 1.5 billion to a new fund targeting high-net-worth investors, reflecting growing insurance-private markets collaboration.
- July 2025: Munich Re Group finalized the acquisition of NEXT Insurance, integrating it into ERGO Group AG's management structure. This strategic move enables ERGO to enter the United States SMB insurance market, leveraging NEXT’s digital platform and proprietary technology.


United States Life and Non-Life Insurance Market Report Scope
Insurance mitigates financial risks from unforeseen events, divided into life and non-life categories. Life insurance provides long-term coverage, ensuring payouts upon death or a specified date. Non-life insurance offers short-term indemnity for asset damage or liability, typically renewed annually under contractual terms.
The United States life and non-life insurance market report is segmented by insurance type (life insurance, non-life insurance), customer segment (retail and corporate), distribution channel (brokers, agents, banks, direct sales, and other channels), and geography (Northeast, Midwest, South, and West). The market forecasts are provided in terms of value (USD).
By Insurance Type
| Life Insurance | |
| Non-Life Insurance | Motor Insurance |
| Health Insurance | |
| Property Insurance | |
| Liability Insurance | |
| Other Insurance |
By Customer Segment
| Retail |
| Corporate |
By Distribution Channel
| Brokers |
| Agents |
| Banks |
| Direct Sales |
| Other Channels |
By Geography
| United States | Northeast |
| Midwest | |
| South | |
| West |
| By Insurance Type | Life Insurance | |
| Non-Life Insurance | Motor Insurance | |
| Health Insurance | ||
| Property Insurance | ||
| Liability Insurance | ||
| Other Insurance | ||
| By Customer Segment | Retail | |
| Corporate | ||
| By Distribution Channel | Brokers | |
| Agents | ||
| Banks | ||
| Direct Sales | ||
| Other Channels | ||
| By Geography | United States | Northeast |
| Midwest | ||
| South | ||
| West | ||


Key Questions Answered in the Report
What is the size and growth outlook for the United States life and non-life insurance market to 2031?
The United States life and non-life insurance market size was USD 3.23 trillion in 2025 and is projected to reach USD 4.00 trillion by 2031 at a 3.64% CAGR over 2026-2031.
Which insurance type leads and which grows the fastest in the forecast?
Non-life held 71.84% in 2025, and health coverage within non-life is the fastest-growing segment at a 5.37% CAGR through 2031.
How do Medicare Advantage and Part D changes affect health insurers in 2026?
CMS finalized a 5.06% average MA payment increase for 2026 and implemented the Part D redesign with a USD 2,100 out-of-pocket cap and rebalanced catastrophic liability, which requires tighter formulary and care management.
What are the main catastrophe-related pressures in property insurance?
Severe convective storms and wildfires continue to drive losses and sustain rate adequacy, while reinsurance pricing and attachments shape capacity outcomes in exposed regions.
What is happening with personal auto loss costs and premiums in 2026?
Premiums eased in 2025, yet loss costs remain elevated due to ADAS-related repair complexity, labor, and parts trends, which support continued segmentation and usage-based products.
Which United States region is expected to grow the fastest by 2031?
The South is forecast to grow fastest through 2031, driven by domestic migration, retiree inflows, and property exposure growth that sustains demand across lines.
Page last updated on:


