Car Insurance Market Size and Share
Market Overview
| Study Period | 2020 - 2031 |
|---|---|
| Market Size (2026) | USD 1.78 Trillion |
| Market Size (2031) | USD 2.41 Trillion |
| Growth Rate (2026 - 2031) | 6.21% CAGR |
| Fastest Growing Market | Asia-Pacific |
| Largest Market | North America |
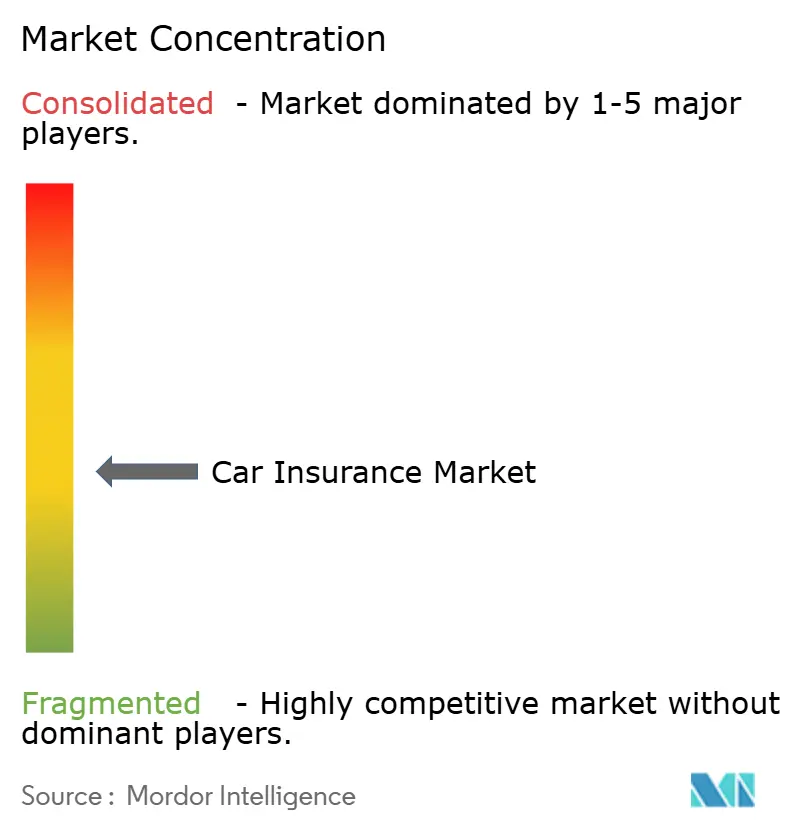
| Market Concentration | Medium |
Major Players *Disclaimer: Major Players sorted in no particular order Image © Mordor Intelligence. Reuse requires attribution under CC BY 4.0. | |
Car Insurance Market Analysis by Mordor Intelligence
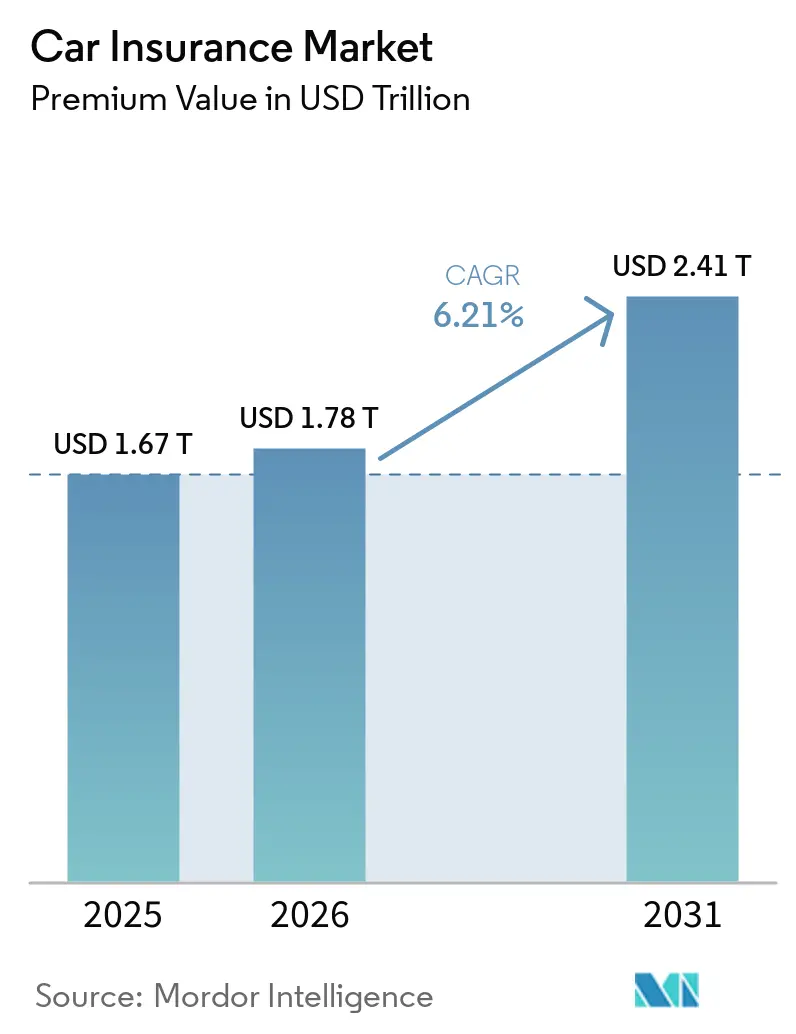
The Car Insurance Market size in terms of premium value is projected to be USD 1.67 trillion in 2025, USD 1.78 trillion in 2026, and reach USD 2.41 trillion by 2031, growing at a CAGR of 6.21% from 2026 to 2031.
Growing liability mandates, rising claims inflation, and rapid digitalization underpin this expansion of the car insurance market. New statutory minimum cover rules in multiple US states and several emerging economies are translating directly into premium volume gains. Climate-driven weather losses, which added USD 140 billion to global insured costs in 2024, are forcing price hardening even in highly penetrated regions. At the same time, direct-to-consumer platforms are winning share as younger buyers value price transparency and speed. Ongoing consolidation shows that scale matters for underwriting profitability and technology investment.
Key Report Takeaways
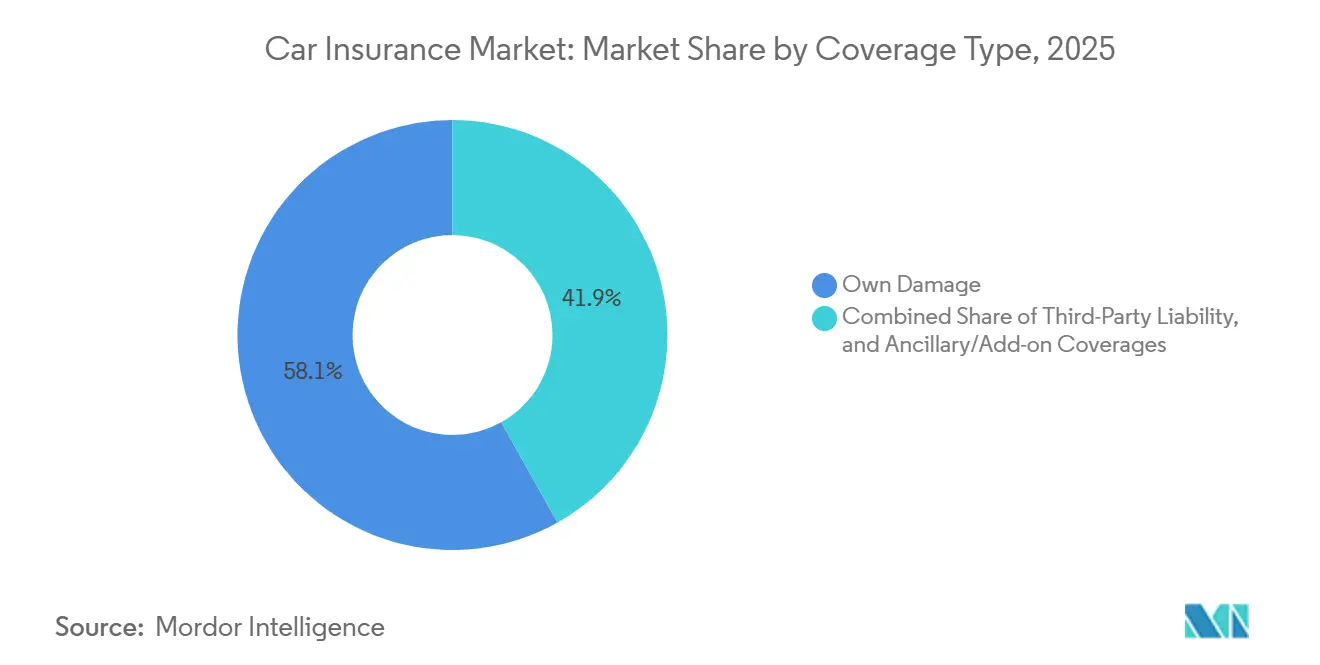
- By coverage, own damage accounted for 58.12% of the car insurance market share in 2025, while ancillary or add-on coverages recorded the fastest projected CAGR at 9.2% through 2031.
- By powertrain, ICE vehicles accounted for 82.19% of the premiums of the car insurance market share in 2025, while BEV insurance is forecast to grow at a 12.6% CAGR through 2031.
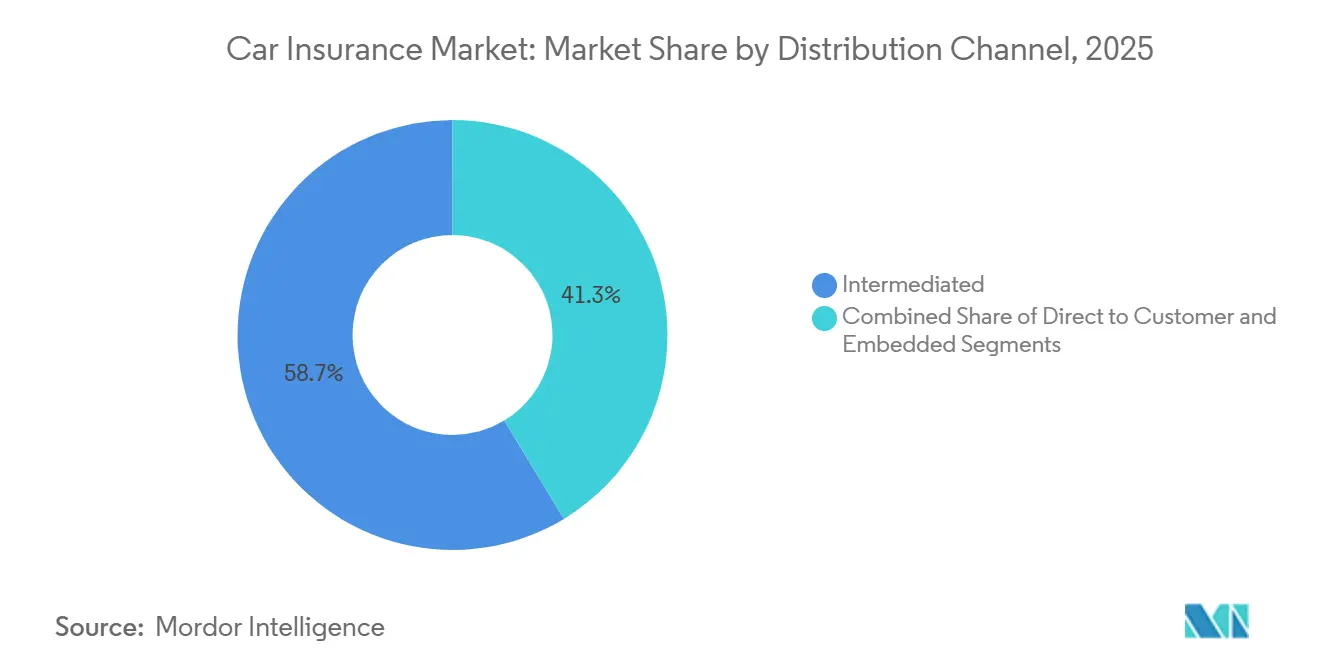
- By distribution channel, intermediated channels captured 58.67% of the car insurance market share in 2025, while embedded, affinity, and partnership models are advancing at an 8.9% CAGR through 2031.
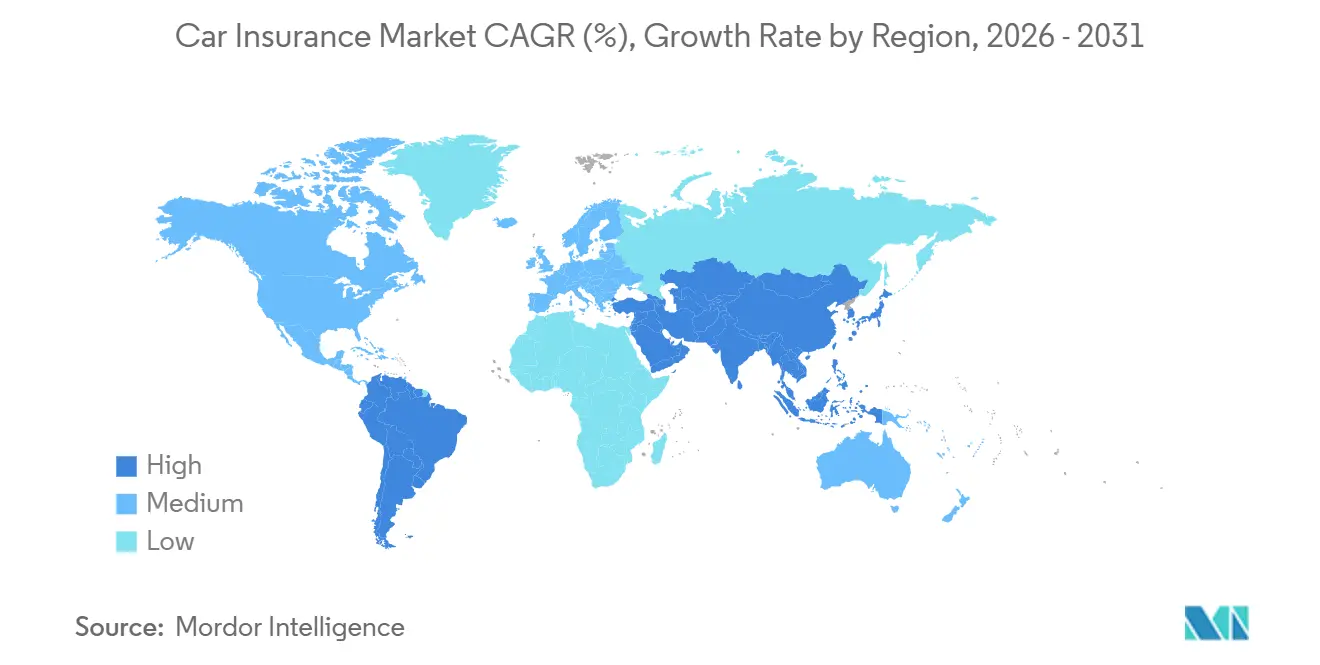
- By geography, North America accounted for 34.08% of the premiums of the car insurance market size in 2025, while Asia-Pacific is forecast to grow at 8.3% CAGR through 2031.
Note: Market size and forecast figures in this report are generated using Mordor Intelligence’s proprietary estimation framework, updated with the latest available data and insights as of 2026.
Global Car Insurance Market Trends and Insights
Drivers Impact Analysis*
| Driver | (~) % Impact on CAGR Forecast | Geographic Relevance | Impact Timeline |
|---|---|---|---|
| Mandatory Liability Laws Expanding In Emerging Markets | +1.2% | Asia-Pacific core, Latin America, Middle East and Africa | Medium term (2-4 years) |
| Rising Global Passenger-Vehicle Parc and New-Car Sales | +1.0% | Global, led by Asia-Pacific and Latin America | Long term (≥ 4 years) |
| Higher Accident Frequency and Claims Inflation | +0.8% | Global, acute in North America and Europe | Short term (≤ 2 years) |
| Accelerating Adoption of Digital and Direct Distribution Channels | +0.7% | Global, led by North America and Europe | Medium term (2-4 years) |
| OEM-Embedded Insurance Programs Scaling Up Rapidly | +0.5% | Early adoption in China, the United States, and Europe | Long term (≥ 4 years) |
| EV-Specific Coverages Gaining Traction | +0.4% | Asia-Pacific, North America, Europe | Medium term (2-4 years) |
| Source: Mordor Intelligence | |||
Rising Global Passenger-Vehicle Parc Widens the Insurable Base
Global vehicle production rose to 96.4 million units in 2025 from 92.7 million in 2024, and Asia-Pacific accounted for more than 61% of that output, which steadily expands the addressable base for the car insurance market. India recorded domestic passenger vehicle sales above 4.6 million units in fiscal 2025 to 2026, while Brazil produced 2.64 million vehicles in 2025, which shows that new premium pools are forming in both mature and emerging economies[1]International Organization of Motor Vehicle Manufacturers, “Auto Industry Growth Shifted East in 2025 Amid Global Repositioning,” OICA, oica.net. Every additional vehicle entering a market with mandatory liability rules creates a required policy opportunity, so fleet growth remains one of the most direct supports for the car insurance market. The mix of insured vehicles is also moving toward newer, higher-value models with more sensors and software, which lifts average premium value before rate revisions are applied. This means unit growth is still important, but underwriting performance in the car insurance market increasingly depends on how well carriers reflect repair complexity and vehicle technology in pricing.
Digital and Direct Distribution Reshaping Customer Acquisition Economics
Digital shopping behavior is changing how consumers enter the car insurance market, and carriers with simple quote-and-bind journeys are gaining a clear edge in acquisition. Customers increasingly compare multiple options before buying, which reduces the advantage of legacy distribution models that rely on slower, agent-led interactions. This shift is especially important among younger policyholders, who are more comfortable completing the full insurance journey on mobile or web interfaces. As a result, carriers that invest in real-time pricing, clean user interfaces, and faster policy issuance are improving both conversion rates and channel efficiency in the car insurance market. The same change is also putting pressure on slower incumbents, as digital comparison habits reduce loyalty and make pricing gaps easier for shoppers to detect.
OEM-Embedded Insurance Integrating Coverage Into the Purchase Journey
OEM-embedded programs are moving insurance closer to the vehicle purchase event, changing how the car insurance market reaches customers. In January 2025, Sony Honda Mobility of America partnered with MOTER Technologies to integrate insurance solutions directly into the AFEELA purchase process in the United States, which shows that insurance is becoming part of the vehicle transaction rather than a separate post-sale step[2]Sony Honda Mobility of America, “Sony Honda Mobility Partners with MOTER to Launch Insurance Solutions for AFEELA in the U.S.,” Sony Honda Mobility of America, shm-afeela.com. The model matters because it reduces acquisition friction, shortens the time between vehicle purchase and policy issuance, and gives insurers access to richer vehicle-level information earlier in the customer relationship. Embedded channels also support more tailored pricing because connected-vehicle data, diagnostics, and update histories can improve underwriting beyond standard driver-level variables. For the car insurance market, this channel is likely to matter most where EV adoption, digital vehicle finance, and OEM-led customer ecosystems are already scaling.
EV-Specific Coverages Addressing Gaps in Standard Policies
Battery-electric vehicle insurance is the fastest-growing powertrain segment in the car insurance market, with a forecast CAGR of 12.6% through 2031, reflecting the rapid expansion of EV fleets across multiple regions. China alone produced 16.626 million new-energy vehicles in 2025, up 29% year over year, and that scale is forcing carriers to adjust pricing for batteries, software risk, and high-voltage repairs. Standard policies have not fully kept pace with EV-specific exposures, especially where battery damage, thermal events, charging incidents, and advanced software functions create uncertainty around coverage scope. Ping An reported that NEV insurance premium income rose 16.1% year over year in Q1 2026, while underwriting profitability remained stable, suggesting that carriers with data scale and connected-vehicle insight can price this risk more effectively[3]Ping An Insurance Group, “Ping An Reports Steady 7.6% Growth in Operating Profit in Q1 2026,” Ping An Insurance Group, group.pingan.com. The gap is widening most for insurers that still rely on internal combustion assumptions, because EV claims behavior in the car insurance market is now diverging more clearly from legacy vehicle portfolios.
Restraints Impact Analysis*
| Restraint | (~) % Impact on CAGR Forecast | Geographic Relevance | Impact Timeline |
|---|---|---|---|
| Premium-Rate Caps and Solvency and Capital Requirements Squeezing Underwriting Margins | -0.9% | EU, North America, Southeast Asia | Short term (≤ 2 years) |
| Surging Repair Costs and Complexity For ADAS-Equipped And Modern Vehicles | -0.8% | North America, Europe, Asia-Pacific | Short term (≤ 2 years) |
| Data-Privacy Regulations Constraining Telematics and UBI Adoption | -0.6% | EU (GDPR zone), California (United States) | Medium term (2-4 years) |
| Evolving Liability Frameworks and Regulatory Uncertainty Around L3+ Autonomous Vehicles | -0.5% | EU, United States, China, United Kingdom | Long term (≥ 4 years) |
| Source: Mordor Intelligence | |||
ADAS-Driven Repair Complexity Eroding Underwriting Margins
ADAS-related repair work is becoming a more persistent cost issue for the car insurance market because newer vehicles require more calibration, more specialized labor, and more expensive parts. CCC highlighted in 2025 that changes in the vehicle fleet and repair ecosystem are increasing claim severity, while industry bodies in Europe are also pointing to sustained technology-led cost pressure. The Association of British Insurers stated in 2025 that motor claims inflation remains a serious issue for carriers, which shows that repair cost escalation is not limited to one market[4]Association of British Insurers, “Motor Claims Inflation, Causes, Consequences and What Comes Next,” Association of British Insurers, abi.org.uk. Germany's GdV expects repair costs to keep rising through 2040 because advances in vehicle technology continue to offset the savings from safer cars. Carriers that do not build repair-cost benchmarks specific to ADAS-equipped vehicles are likely to underprice claims severity as the fleet mix in the car insurance market shifts further toward technology-rich vehicles.
Data-Privacy Regulations Fragmenting UBI Deployment Across Jurisdictions
Usage-based insurance relies on continuous driving and vehicle data, but privacy rules are becoming more stringent and uneven across markets. The European Data Protection Board said in May 2026 that insurers must keep non-UBI alternatives available so consent can be freely given, and it also emphasized more limited data flows from connected vehicles to insurers. France's CNIL opened a public consultation in March 2025 on draft guidance for connected-vehicle location data, which points to tighter national interpretation of mobility data controls inside Europe. These rules matter because telematics programs lose some of their pricing value when raw behavioral data cannot be stored or processed consistently across jurisdictions. In the car insurance market, carriers that build privacy-by-design telematics systems with edge processing and limited data transfer are likely to manage compliance costs more effectively than firms that rely on centralized, data-heavy architectures.
*Our forecasts treat driver/restraint impacts as directional, not additive. The impact forecasts reflect baseline growth, mix effects, and variable interactions.
Segment Analysis
By Coverage: Add-On Products Narrowing the Gap With Core Protection
Own Damage coverage accounted for 58.12% of global premiums in 2025, which made it the largest coverage line by value in the car insurance market. The segment stays ahead because lenders and policyholders continue to prefer broader protection against collision, theft, and physical damage amid high repair costs. Third-Party Liability remains foundational in many markets because it is compulsory, but regulated pricing and lower average premium values often keep its premium share below Own Damage. This leaves the largest part of the car insurance market concentrated in products that respond to the high cost of repairing or replacing increasingly sophisticated vehicles.
Ancillary and add-on coverages are forecast to grow at a 9.2% CAGR through 2031, making them the fastest-growing coverage group in the car insurance market mix. These riders are gaining traction because standard policies do not always clearly cover roadside assistance, gap cover, EV battery protection, or cyber-related exposures. The pattern differs by region: emerging markets still lean more toward mandatory liability, while higher-income markets are adding optional layers as vehicle complexity rises. Over time, this means the car insurance industry is likely to see broader product unbundling, with carriers using modular riders to capture needs that no longer fit comfortably inside core policy forms.


By Powertrain: BEV Insurance Is Resetting Risk Models Across Vehicle Types
ICE vehicles accounted for 82.19% of premiums in 2025, giving them the largest share by far in the car insurance market by powertrain. That lead reflected fleet composition more than product preference because the global vehicle parc still contains a very large base of internal combustion vehicles. Hybrid vehicles sit between legacy and electric categories, and their repair profile is becoming more distinct as carriers track calibration frequency, software components, and dual-drivetrain complexity. This keeps ICE dominant in current premium terms, but it also shows that the powertrain mix inside the car insurance market is entering a longer transition phase.
BEV insurance is forecast to grow at a 12.6% CAGR through 2031, making it the fastest-growing powertrain segment in the car insurance market outlook. China's 16.626 million new-energy vehicle production in 2025 and the wider push for EV adoption across Asia and Europe are increasing the number of policies that require dedicated protection for batteries, charging, and software. The segment is still small in terms of premium share. Still, its pricing logic is already diverging from traditional vehicle books because high-voltage repairs and manufacturer-specific parts create a different severity profile. As battery costs gradually fall over the longer term, policy counts should keep rising even if average premium values begin to normalize, reshaping how the car insurance industry measures growth in EV portfolios.
By Distribution Channel: Embedded Models Are Building a Faster Route to Policy Issuance
Intermediated channels held 58.67% of premiums in 2025, making them the largest route to customer acquisition in the car insurance market. Agents, brokers, and bancassurance remain relevant because customers still rely on advice in complex cases, commercial lines, and higher-value personal cover. Direct-to-consumer models continue to expand because they reduce friction, lower servicing costs, and fit the expectations of digital-first buyers. Even so, the current premium base of the car insurance market still reflects the resilience of traditional intermediation rather than a completed channel shift.
Embedded, affinity, and partnership models are forecast to grow at a 8.9% CAGR through 2031, making them the fastest-growing distribution paths in the car insurance market. Sony Honda Mobility's partnership with MOTER Technologies illustrates how insurers can place coverage at the point of vehicle selection and financing rather than waiting for a separate shopping cycle. The appeal of this model is that it converts purchase moments into policies with less customer drop-off and richer vehicle data. The car insurance industry is therefore moving toward channel strategies that rely more on APIs, real-time underwriting, and modular products that can fit neatly into digital retail ecosystems.
Geography Analysis
North America accounted for 34.08% of global premiums in 2025, making it the largest regional share in the car insurance market. The region benefits from high vehicle density, high average repair bills, and a claims environment where bodily injury and litigation costs remain elevated. The United States and Canada drive most of this premium base, and the scale of their established carriers keeps competition intense even though leadership remains concentrated among a few large brands. Europe remains a mature region in the car insurance market, but margin pressure persists because repair inflation has not eased as quickly as capital reforms. The European Commission said in 2025 that the Solvency II delegated regulation reduced the cost-of-capital rate in the risk margin calculation from 6% to 4.75%, thereby providing capital relief without addressing the underlying repair cost issue.
Asia-Pacific is forecast to grow at a 8.3% CAGR through 2031, making it the fastest-expanding regional block in the car insurance market. The region combines fast vehicle sales growth, high EV adoption, and lower insurance penetration across several markets, creating a broad runway for premium expansion. China remains central because NEV production is reshaping risk pricing, while Japan, South Korea, and Australia contribute stable premium pools with more mature underwriting structures. Ping An reported Q1 2026 premium income of RMB 90,951 million, equal to USD 12.5 billion, and said NEV insurance premium income rose 16.1% year over year with stable underwriting profitability. India is also becoming more important because vehicle scale, mandatory liability rules, and foreign capital activity are widening access to the car insurance market.
South America, the Middle East, and Africa remain smaller in premium terms, but they provide some of the clearest white space in the car insurance market. Brazil's 2.64 million vehicle production in 2025 and Africa's 1.29 million vehicle sales in the same year show that fleet expansion is outpacing full insurance penetration in several markets. South Africa and Nigeria anchor much of the African opportunity, while the Gulf markets stand out for stronger comprehensive take-up because vehicle values and income levels are higher. These corridors should remain important because digital distribution and compliant low-cost products can unlock premium growth where vehicle ownership is rising faster than policy density.
Mordor Intelligence provides coverage of the car insurance market across other key regional markets, including Asia and Europe, each with their regulatory frameworks and demand patterns. Detailed country-level analysis extends to Japan, Germany, China, India, France, Brazil, Russia, and United Kingdom incorporating local coverage and market participation, as required.

Competitive Landscape
The car insurance market is moderately consolidated at the top and fragmented below, because national regulation keeps competition localized even as a handful of large carriers lead premium volumes across major regions. The strongest competitors are building an advantage through pricing precision, distribution control, and better use of connected-vehicle data rather than relying only on scale. Telematics, embedded partnerships, and faster digital servicing are now separating carriers that can protect margin from those that still depend on older operating models. This is why the car insurance market is seeing leadership pressure even among long-established brands. It is also why competitive standing now depends as much on technology architecture as on brand recognition or branch reach.
Strategic moves in 2026 show how incumbents are reacting to that shift. In March 2026, Cambridge Mobile Telematics received a USD 350 million investment led by TPG and Allianz X, with State Farm participating, to support the wider use of AI-driven crash detection and portable driving scores across retail and OEM programs. In April 2026, Allianz and Jio Financial Services agreed to form a 50:50 primary insurance joint venture in India, which shows how global carriers are using partnerships to enter high-growth markets more quickly. In January 2025, Sony Honda Mobility of America partnered with MOTER Technologies to embed insurance into the AFEELA purchase process, reflecting how OEM-led channels are becoming commercially relevant.
The most attractive white space remains in EV-native underwriting, embedded distribution, and digital-first entry into underinsured markets across Asia and Africa. Carriers that can price battery risk, software-related exposures, and privacy-sensitive telematics more accurately should gain share faster than firms that apply legacy models to newer vehicle categories. At the same time, incumbents that remain tied to slow agency workflows, limited API capability, or generic severity curves are more exposed to margin erosion. Competitive outcomes in the car insurance market are therefore likely to favor insurers that combine underwriting discipline with flexible technology and region-specific partnerships.
Car Insurance Industry Leaders
State Farm
GEICO
Progressive Corporation
Allianz SE
Ping An Insurance
- *Disclaimer: Major Players sorted in no particular order

Recent Industry Developments
- March 2026: Cambridge Mobile Telematics (CMT) received a USD 350 million strategic investment led by TPG's The Rise Fund and Allianz X, with State Farm participating. The funding targets global expansion of CMT's AI-driven crash detection and Universal Driving Score platforms. It includes long-term commercial agreements with Allianz entities across Europe for retail and OEM-facing programs. This positions telematics analytics as a shared infrastructure layer rather than a carrier-exclusive asset.
- April 2026: Jio Financial Services Limited (JFSL) and Allianz Group entered a binding agreement to form a 50:50 primary insurance joint venture covering general and health insurance in India, formalizing a partnership announced in July 2025. The two entities also established Allianz Jio Reinsurance Limited as a 50:50 JV and signed a non-binding agreement to explore life insurance opportunities.
- March 2025: Liberty Mutual completed the acquisition of LMG Insurance in Thailand, with the Liberty Insurance Vietnam acquisition expected to close later in 2025 or early 2026, pending regulatory approvals. The moves reflect a broader strategy to build owned-equity positions across Southeast Asia's rapidly growing non-life insurance markets.
- January 2025: Sony Honda Mobility of America (SHMA) partnered with MOTER Technologies to integrate insurance solutions directly into the AFEELA vehicle purchase process in the United States, leveraging MOTER's edge computing platform to deliver coverage options at the point of sale.


Research Methodology Framework and Report Scope
Market Definitions and Key Coverage
Our study defines the car-insurance market as every gross written premium for private-passenger and commercial car policies that safeguard owners against third-party liability as well as own-damage risks, including collision, comprehensive, personal injury, and optional add-ons sold through licensed channels worldwide.
Scope Exclusion: Two-wheelers, heavy trucks, life or health covers, and extended-warranty products lie outside this report.
Segmentation Overview
- By Coverage
- Third-Party Liability
- Own Damage
- Ancillary / Add-on Coverages
- By Powertrain
- Internal Combustion Engine (ICE)
- Hybrid
- Battery Electric Vehicle (BEV)
- Others
- By Distribution Channel
- Direct-to-Consumer (DTC)
- Intermediated (includes agents, brokers, bancassurance, etc.)
- Embedded / Affinity / Partnership
- By Geography
- North America
- United States
- Canada
- Rest of North America
- South America
- Brazil
- Argentina
- Rest of South America
- Europe
- Germany
- United Kingdom
- France
- Italy
- Spain
- BENELUX (Belgium, Netherlands, and Luxembourg)
- Nordics (Sweden, Norway, Denmark, Finland)
- Rest of Europe
- Asia-Pacific
- China
- India
- Japan
- South Korea
- Australia
- South East Asia
- Indonesia
- Rest of Asia-Pacific
- Middle East and Africa
- United Arab Emirates
- Saudi Arabia
- South Africa
- Nigeria
- Rest of Middle East and Africa
- North America
Detailed Research Methodology and Data Validation
Primary Research
Mordor analysts interviewed underwriting heads, telematics vendors, regulators, and broker networks across North America, Europe, Asia-Pacific, and the Gulf. Insights on retention ratios, average premium per policy, embedded insurance uptake, and regulatory timing filled data gaps and refined assumptions.
Desk Research
We mapped premium pools by mining regulator yearbooks, trade association statistics, and multilateral datasets such as NAIC, EIOPA, IRDAI, OECD Insurance Statistics, World Bank, OICA, and WHO road safety files. Company 10-Ks, tariff filings, and peer-reviewed papers on telematics pricing provided cycle context. Paid assets like D&B Hoovers and Dow Jones Factiva supplied carrier splits and deal flow. These sources illustrate breadth, and many additional publications informed validation.
Market-Sizing & Forecasting
We first applied a top-down rebuild of national premium pools from regulator filings, harmonizing figures to 2024 USD and normalizing divergent liability mandates. Select bottom-up checks, including sampled average premiums multiplied by insured vehicle counts and intermediary commission roll-ups, tempered totals. Key variables in our multivariate regression include vehicle parc growth, new car sales, claims severity inflation, telematics penetration, and minimum coverage shifts; scenario analysis captured high EV adoption and advanced ADAS repair costs.
Data Validation & Update Cycle
Outputs face a three-layer review: analyst, senior domain lead, and editorial. Deviations beyond two standard deviations trigger re-estimation. Reports refresh annually, with interim updates after material regulatory or catastrophe events.
Why Mordor's Car Insurance Baseline Commands Reliability
Published estimates vary because firms pick different coverage mixes, exchange rate snapshots, and refresh cadences. By anchoring totals to regulator-reported premiums and then tempering them with on-ground price and policy insights, Mordor delivers a balanced midpoint clients can trust.
Ultimately, our disciplined scope selection, blended modeling, and timely refresh ensure decision-makers receive the most transparent and actionable baseline available.
Benchmark comparison
| Market Size | Anonymized source | Primary gap driver |
|---|---|---|
| USD 2.01 B | Mordor Intelligence | - |
| USD 0.97 B | Global Consultancy A | Excludes commercial fleets; conservative claims inflation path |
| USD 0.91 B | Trade Journal B | Omits embedded insurance premiums; 2024 exchange rates |
Ultimately, our disciplined scope selection, blended modeling, and timely refresh ensure decision-makers receive the most transparent and actionable baseline available.


Key Questions Answered in the Report
What is the size outlook for the car insurance market through 2031?
The car insurance market size is projected at USD 1.78 trillion in 2026 and is expected to reach USD 2.41 trillion by 2031, growing at a 6.21% CAGR.
Which coverage segment leads global premiums in 2025?
Own Damage leads with 58.12% of global premiums in 2025 because broader physical damage protection remains important as repair costs rise.
Which powertrain type is growing fastest in vehicle insurance?
BEV insurance is growing the fastest, with a projected 12.6% CAGR through 2031, as EV fleets expand and require more specialized protection.
Which region is expanding the fastest for car insurance demand?
Asia-Pacific is the fastest-growing region, with an 8.3% CAGR through 2031, supported by strong vehicle sales and lower insurance penetration in several markets.
Why are claims costs rising for insurers?
Claims costs are rising because ADAS-equipped vehicles need more specialized repairs, calibration work, and higher-value parts, which raises severity even when accident frequency is stable.
Page last updated on:


