Canada Home Insurance Market Size and Share
Market Overview
| Study Period | 2020 - 2031 |
|---|---|
| Forecast Data Period | 2026 - 2031 |
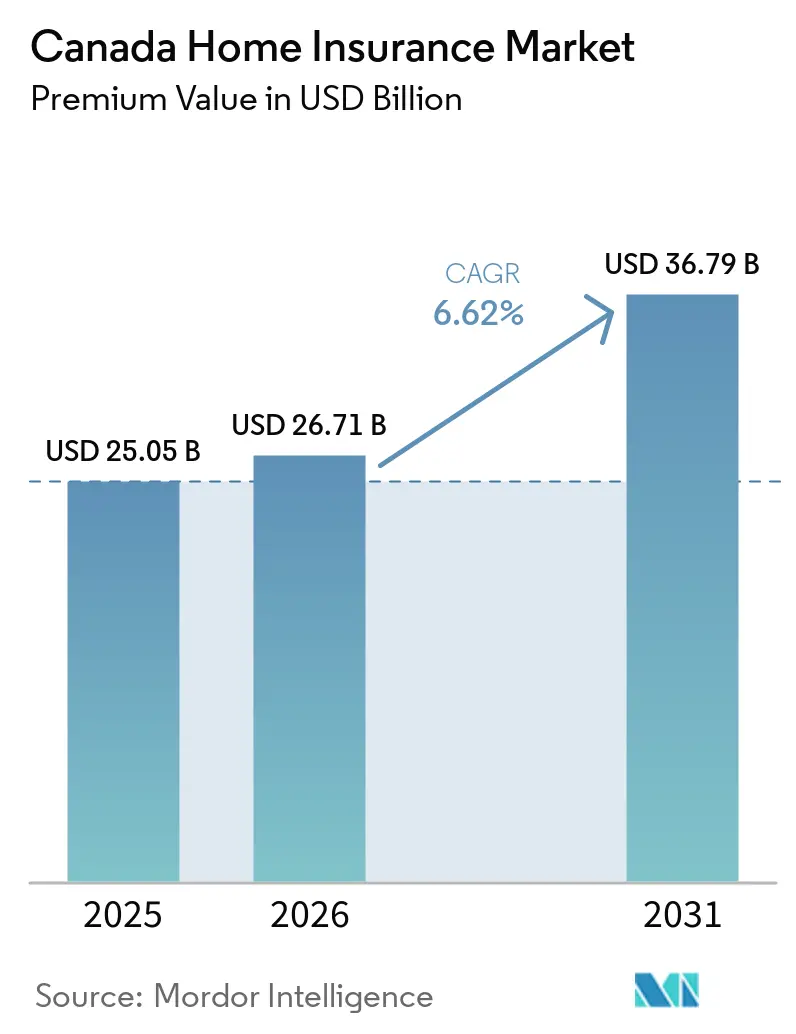
| Base Year Market Size (2025) | USD 25.05 Billion |
| Market Size (2026) | USD 26.71 Billion |
| Market Size (2031) | USD 36.79 Billion |
| Growth Rate (2026 - 2031) | 6.62% CAGR |
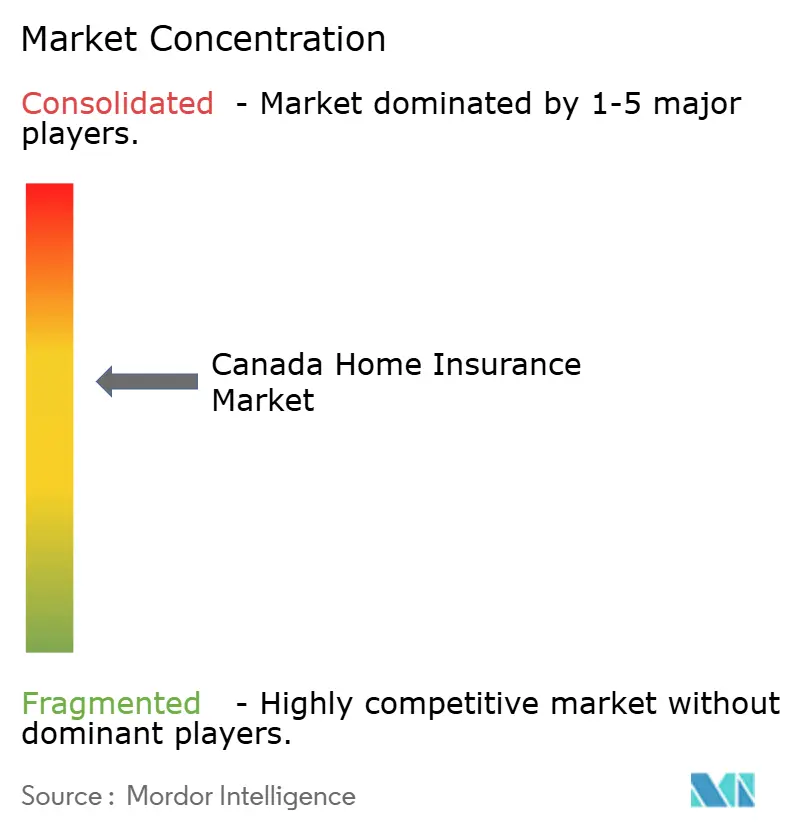
| Market Concentration | Medium |
Major Players *Disclaimer: Major Players sorted in no particular order Image © Mordor Intelligence. Reuse requires attribution under CC BY 4.0. | |
Canada Home Insurance Market Analysis by Mordor Intelligence
The Canada Home Insurance Market size in terms of premium value is expected to increase from USD 25.05 billion in 2025 to USD 26.71 billion in 2026 and reach USD 36.79 billion by 2031, growing at a CAGR of 6.62% over 2026-2031.
Premium momentum is supported by higher catastrophe frequency, a larger insured mortgage pool, and digital uptake that lowers distribution costs. Average rates moved 5.28% nationally in 2025 as carriers recalibrated risk, while Alberta posted a 9.07% increase after the 2024 hail event. Construction-cost inflation elevated replacement-cost values, expanding written premiums in every province. Although climate volatility and reinsurer pricing pressure threaten profitability, the Canada home insurance market continues to show resilience as risk-based capital rules improve solvency buffers.
Key Report Takeaways
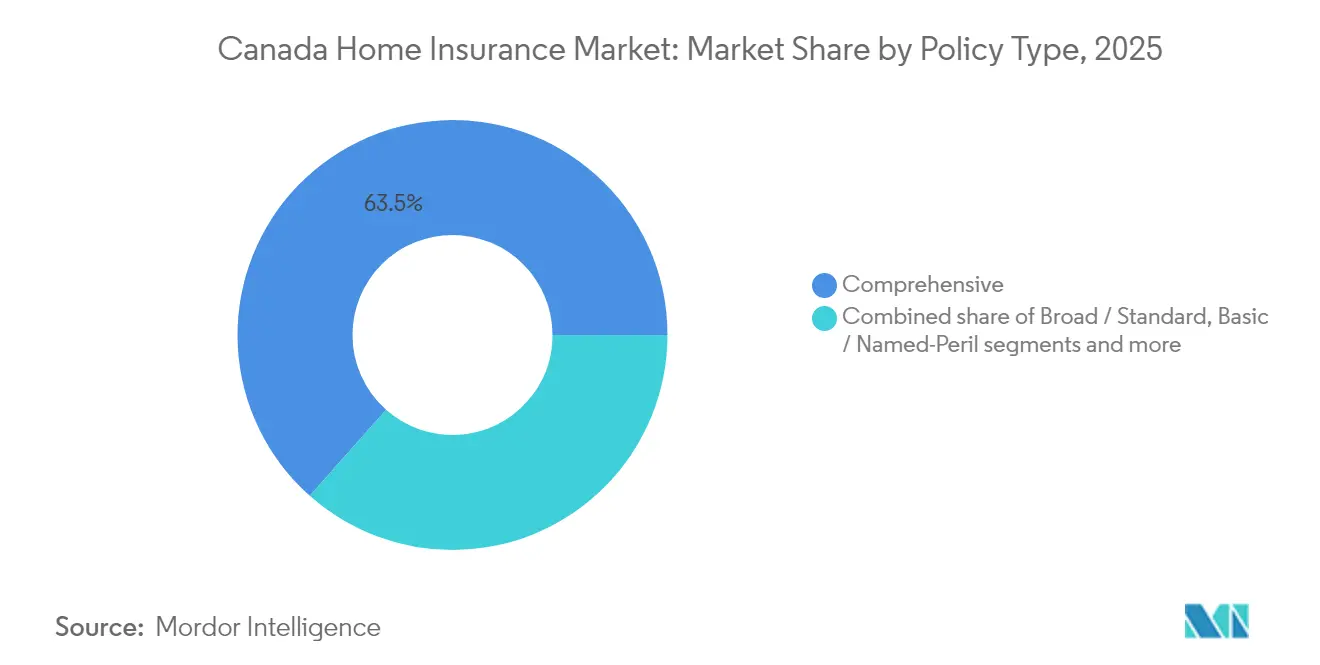
- By policy type, comprehensive coverage led with 63.45% of the Canada home insurance market share in 2025 and is forecast to advance at a 7.39% CAGR through 2031.
- By coverage component, building protection accounted for 36.12% of the Canada home insurance market size in 2025, while contents coverage is on track for a 4.12% CAGR to 2031.
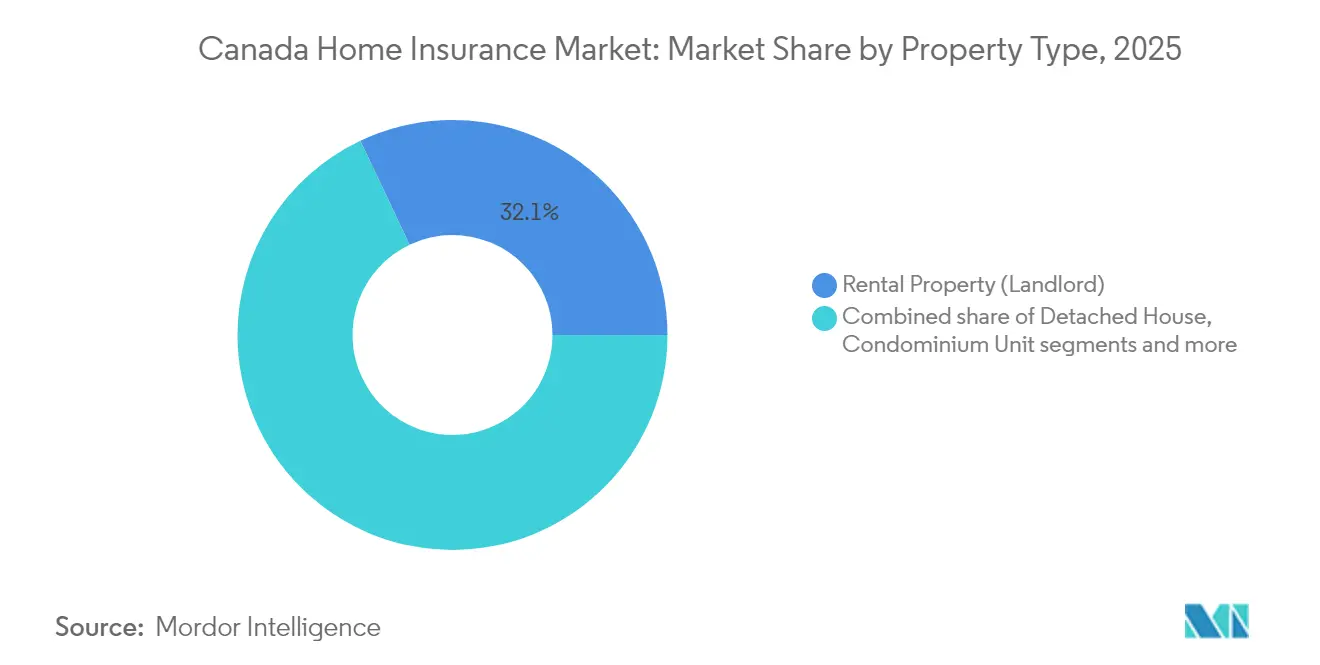
- By property type, rental properties captured 32.05% of the Canada home insurance market share in 2025; seasonal and cottage properties are poised for the fastest 4.90% CAGR by 2031.
- By distribution channel, banks controlled 31.60% of the Canada home insurance market size in 2025, whereas online and direct digital channels exhibit the strongest 11.02% CAGR to 2031.
- By province, Ontario retained a 36.85% share in 2025, while Alberta is projected to record a 4.66% CAGR across the forecast window.
Note: Market size and forecast figures in this report are generated using Mordor Intelligence’s proprietary estimation framework, updated with the latest available data and insights as of 2026.
Canada Home Insurance Market Trends and Insights
Drivers Impact Analysis*
| Driver | (~) % Impact on CAGR Forecast | Geographic Relevance | Impact Timeline |
|---|---|---|---|
| Rising climate-related catastrophes | +2.1% | National; peak exposure in Alberta, BC, Ontario | Long term (≥ 4 years) |
| Growth in housing stock & property values | +1.8% | National; highest in Ontario, Quebec, BC | Medium term (2-4 years) |
| OSFI risk-based capital & pricing reforms | +1.2% | National | Medium term (2-4 years) |
| Mandatory insurance tied to mortgage originations | +0.9% | National | Short term (≤ 2 years) |
| Parametric flood-cover pilots | +0.6% | Atlantic Canada; Quebec | Long term (≥ 4 years) |
| IoT-enabled “connected-home” discounts | +0.4% | Urban centres | Medium term (2-4 years) |
| Source: Mordor Intelligence | |||
Rising Climate-Related Catastrophes
Severe weather losses hit USD 6.29 billion in 2024, triple the prior year and far above historical norms[1]Insurance Bureau of Canada, “Severe Weather in 2024 Cost Canadian Insurers USD 6.29 billion,” ibc.ca. The Calgary hailstorm alone generated USD 2.22 billion in claims and spurred over 250,000 individual filings. Insurers now embed long-range climate projections in pricing models and have reduced capacity in the riskiest postal codes. Without resilient public infrastructure, annual losses could reach unsustainable levels, according to the Insurance Bureau of Canada. These dynamics keep upward pressure on premiums and push carriers toward sophisticated catastrophe modeling, which is central to the Canadian home insurance market.
Growth in Housing Stock & Property Values
An expanding housing base and rising property values broaden the premium pool. Federal rules now allow insured mortgages up to USD 1.1 million, bringing higher-value homes into compulsory coverage[2]Department of Finance Canada, “Insured Mortgage Changes,” finance.canada.ca. Quebec’s rental-unit construction continues despite a softer home-purchase market, illustrating consistent insurance demand. Construction-cost inflation raises dwelling limits and drives additional rate increases. Together, these factors ensure steady volume growth for the Canadian home insurance market.
OSFI Risk-Based Capital & Pricing Reforms
The 2025 capital adequacy framework requires supervisory target capital ratios of 150% for mortgage insurers, along with annual Own Risk and Solvency Assessment filings[3]Office of the Superintendent of Financial Institutions, “Capital Adequacy Requirements 2025,” osfi-bsif.gc.ca. Compliance costs favor carriers with larger balance sheets, encouraging mergers such as Definity’s USD 3.31 billion purchase of Travelers Canada. Enhanced solvency oversight strengthens consumer confidence and stabilizes underwriting capacity across the Canadian home insurance market.
Mandatory Insurance Tied to Mortgage Originations
By raising the insured mortgage ceiling and extending amortizations to 30 years for first-time buyers, the pool of borrowers required to maintain property insurance has broadened. This change increases accessibility for new buyers, enabling more individuals to enter the housing market while simultaneously driving demand for property insurance. Banks, capitalizing on their mortgage relationships, actively cross-sell homeowners' policies, bolstering their 32.1% share of the channel. These measures not only promise immediate premium inflows but also solidify the foundational demand for home insurance in Canada, ensuring sustained growth opportunities for insurers in the market.
Restraints Impact Analysis*
| Restraint | (~) % Impact on CAGR Forecast | Geographic Relevance | Impact Timeline |
|---|---|---|---|
| Escalating catastrophe claim costs | -1.4% | National; high-risk zones | Long term (≥ 4 years) |
| Price competition from digital insurers | -0.8% | Urban markets | Medium term (2-4 years) |
| Re-insurance capacity tightening | -0.7% | National | Long term (≥ 4 years) |
| Data-privacy limits on granular usage data | -0.5% | National | Medium term (2-4 years) |
| Source: Mordor Intelligence | |||
Escalating Catastrophe Claim Costs
In 2024, property sums insured surged to USD 14.06 trillion, amplifying loss severity during events. This increase in insured values has heightened the financial impact of claims, particularly during catastrophic occurrences. Due to reinsurer rate hardening, carriers are compelled to retain more risk, leading to elevated deductibles and tighter coverage terms. These adjustments are aimed at mitigating financial exposure but often result in reduced coverage options for policyholders. Concurrently, labor shortages are extending rebuild durations, thereby escalating loss-adjustment expenses. The prolonged timelines for repairs and reconstruction increase costs and also delay claim settlements, further straining the market. This confluence of challenges squeezes profitability and emerges as the primary constraint on Canada's home insurance market.
Price Competition From Digital Insurers
Digital-only platforms swiftly process quotes in mere minutes, challenging the traditional cost structures of legacy players, especially in urban locales. These platforms leverage advanced technologies and streamlined operations to offer competitive pricing and faster services, making them increasingly attractive to consumers. With online distribution expanding at a robust 11.43% CAGR, established players find themselves compelled to invest heavily in IT upgrades to remain competitive. However, these investments often tighten margins, particularly during tumultuous cycles marked by frequent catastrophes. While technology undeniably elevates the customer experience through personalized offerings and improved accessibility, an unyielding price war continues to cast a shadow on short-term earnings within Canada's home insurance landscape.
*Our forecasts treat driver/restraint impacts as directional, not additive. The impact forecasts reflect baseline growth, mix effects, and variable interactions.
Segment Analysis
By Policy Type: Comprehensive Coverage Holds Its Edge
Comprehensive policies claimed 63.45% of the Canadian home insurance market share in 2025 and are forecast at a 7.39% CAGR by 2031. Borrowers and lenders increasingly prefer all-perils protection that addresses water damage, theft, and wildfire risk. Mortgage clauses mandate sufficient limits, while consumers benefit from bundling discounts of up to 15%. Standard policies appeal to cost-sensitive owners in lower-risk areas, yet their share erodes as weather volatility widens. Endorsements for cyber or home-business risks open incremental premium streams that deepen carrier relationships.
Comprehensive demand also rides on smart-home adoption. Sensors detect leaks or fire hazards and qualify policyholders for 5-20% savings, accelerating take-up among urban dwellers. As claims data confirms mitigation benefits, insurers promote device installation to protect loss ratios. These trends consolidate comprehensive dominance within the Canadian home insurance market.


By Coverage Component: Building Limits Drive Written Premiums
Building cover represented 36.12% of the Canadian home insurance market size in 2025, fuelled by inflationary material and labor expenses. Replacement-cost calculators now reset annually, nudging policy limits higher to avoid underinsurance. Contents insurance advances at a 4.12% CAGR as households acquire higher-value electronics and furnishings. Liability limits trend upward in response to larger court awards tied to home-sharing and remote-work exposures.
Extended displacement after catastrophes elevates the Additional Living Expenses cover. Carriers encourage periodic coverage reviews through digital portals, aligning insured values with market conditions and safeguarding solvency under OSFI rules. These practices increase average premiums yet protect consumer balance sheets, reinforcing sustainable growth in the Canadian home insurance market.
By Property Type: Rental Demand Underpins Expansion
Rental-property insurance captured 32.05% of the Canadian home insurance market share in 2025 as affordability issues push more Canadians into tenancy. Investors adopt tailored policies covering loss of rent and landlord liability, which carry higher average premiums than owner-occupied homes. Detached houses still command the largest premium pool by absolute volume, but seasonal and cottage properties are set for a 4.90% CAGR due to climate migration and remote-work flexibility.
In response to shifting housing preferences, insurers are crafting products tailored for tiny homes and accessory dwelling units. These housing types are gaining popularity due to their affordability and flexibility, prompting insurers to address their unique insurance needs. To tackle the specific challenges associated with seasonal dwellings, insurers are enhancing underwriting practices for unoccupied periods and implementing advanced tools to mitigate water damage claims. These strategic innovations fuel growth in the segment and also expand the potential market for home insurance in Canada, enabling insurers to cater to a broader range of customers.
By Distribution Channel: Banks Retain Scale as Digital Accelerates
In 2025, banks commanded a 31.60% share of Canada's home insurance market, skillfully bundling policies with mortgage origination. This strategy allows banks to leverage their existing customer base and cross-sell insurance products effectively. While brokers and advisers play a crucial role in navigating complex risks, such as high-value properties or unique coverage needs, they are feeling the pinch as carriers introduce direct portals that simplify the purchasing process for consumers. Online channels, surging at an 11.02% CAGR, underscore the growing consumer preference for seamless and low-friction purchasing experiences, driven by advancements in digital platforms and increasing internet penetration.
Captive-agent networks are evolving, merging traditional in-person consultations with the convenience of mobile apps to cater to a broader demographic. This hybrid approach ensures personalized service while meeting the demand for digital accessibility. Meanwhile, aggregators and affinity groups are streamlining acquisitions, enabling smaller carriers to penetrate new provinces and compete with established players. This diverse channel landscape mitigates concentration risks by reducing reliance on a single distribution method and broadens consumer choices, fostering competition and innovation across the Canadian home insurance market.
Geography Analysis
Ontario generated 36.85% of written premiums in 2025, supported by high housing valuations in the Greater Toronto Area and a sophisticated regulatory regime that balances consumer protection with market-based pricing. Flood-risk refinement is a priority following the 2024 GTA event that swelled provincial loss totals. Digital uptake is highest in urban Ontario, where consumers readily adopt IoT devices that qualify for premium credits.
Quebec holds the second-largest footprint, benefitting from steady construction and a regulatory framework that recently streamlined licensing for out-of-province representatives. Incentivized rental-unit development maintains premium growth despite demand softening in owner-occupied segments. Provincial authorities emphasize affordable flood coverage, spurring pilots that may evolve into a national program.
Alberta records the fastest 4.66% CAGR as hail and flood exposure push premiums upwards, even while challenging affordability. The 2024 Calgary hailstorm marked Canada’s costliest convective event and highlighted the province’s vulnerability. Western neighbor British Columbia contends with wildfire and earthquake risks, prompting layered cover structures and uptake of parametric add-ons.
Atlantic Canada’s hurricane profile and inland flood susceptibility drive federal funding for a proposed national flood scheme. Smaller prairie provinces, though less populous, post stable demand as agriculture-driven economies sustain housing construction. Collectively, regional distinctions compel carriers to localize pricing and coverage design, reinforcing the diverse growth paths within the Canadian home insurance market.
Competitive Landscape
The Canada home insurance market exhibits moderate concentration. Intact Financial Corporation, Desjardins Group, and Aviva Canada anchor leadership through scale, diversified product suites, and advanced catastrophe models. Consolidation accelerates as OSFI capital rules reward heft; Definity’s deal for Travelers Canada will enlarge its market presence upon the 2026 close.
Digital challengers such as Sonnet deploy AI underwriting to cut expense ratios and attract tech-savvy urban customers. Incumbents answer with omnichannel portals and partnerships that embed value-added services. Intact’s 2024 purchase of Jiffy integrates preventative maintenance data, enabling proactive loss control and deeper customer engagement.
Reinsurer capacity tightens after successive loss years, raising ceded-premium costs and encouraging quota-share arrangements. Carriers invest in granular data analytics to secure capacity on favorable terms. This arms race for technology and talent reshapes competitive boundaries while keeping the customer at the center of innovation across the Canadian home insurance market.
Canada Home Insurance Industry Leaders
Intact Financial Corporation
Desjardins Group
Aviva Canada
The Co-operators Group
Lloyd’s Underwriters
- *Disclaimer: Major Players sorted in no particular order

Recent Industry Developments
- May 2025: Definity Financial Corporation agreed to acquire Travelers Canada for USD 3.3 billion, adding USD 1.6 billion in gross written premiums and targeting USD 100 million.
- April 2025: Bamboo Insurance launched its Ting fire-prevention program, offering free electrical hazard sensors and service credits.
- February 2025: SGI partnered with FRISS to embed AI fraud analytics in claims processing.
- December 2024: Beneva and Gore Mutual announced a merger to form Canada’s largest mutual insurer, pending regulatory and member approvals.
- November 2024: Intact Financial Corporation acquired Jiffy, a home-maintenance app with 450,000 completed jobs, to bolster digital engagement.


Research Methodology Framework and Report Scope
Market Definitions and Key Coverage
Our study defines the Canada home-insurance market as the total direct written premium that domestic and foreign insurers collect on policies protecting owner-occupied, rental, seasonal, and condominium dwellings against structural loss, contents loss, and personal liability. Policy forms covered include comprehensive, broad/standard, basic named-peril, and riders; premiums are converted to constant 2025 U.S. dollars for cross-year comparability.
Scope Exclusion: Stand-alone flood policies backed exclusively by federal or provincial disaster programs are outside our scope.
Segmentation Overview
- Segmentation by Policy Type
- Comprehensive
- Broad / Standard
- Basic / Named-Peril
- Endorsements & Riders
- Segmentation by Coverage Component
- Building / Dwelling
- Contents
- Personal Liability
- Additional Living Expenses (ALE)
- Segmentation by Property Type
- Detached House
- Semi-Detached / Townhouse
- Condominium Unit
- Rental Property (Landlord)
- Seasonal / Cottage
- Segmentation by Distribution Channel
- Independent Advisers / Brokers
- Banks
- Company (Captive) Agents
- Online / Direct Digital
- Other Channels (Affinity, Aggregators)
- Segmentation by Region
- Ontario
- Québec
- British Columbia
- Alberta
Detailed Research Methodology and Data Validation
Primary Research
Interviews were conducted with underwriting managers, regional brokers, reinsurers, and consumer advocates across Ontario, Québec, Alberta, and British Columbia. Insights from these conversations helped us reconcile carrier-reported premium growth with street-level rate increases, verify deductible trends, and refine assumptions on digital-channel uptake.
Desk Research
We relied on public data sets from Statistics Canada, the Insurance Bureau of Canada, the Office of the Superintendent of Financial Institutions, and Environment Canada to size the dwelling stock, claims frequency, and insured-loss trends. Annual reports and statutory filings from leading underwriters allowed our analysts to benchmark average written premium and loss ratios across policy types. Trade literature such as Canadian Underwriter and Insurance Business Canada provided monthly rate change snapshots and broker channel shifts. To validate carrier revenue and policy mix, our team accessed D&B Hoovers for company-level financials and Dow Jones Factiva for earnings-call transcripts. This list is illustrative; many additional secondary sources were reviewed to complete fact finding and cross-checks.
Market-Sizing & Forecasting
Mordor analysts apply a top-down reconstruction that begins with provincial dwelling counts, rebuild cost indices, and average premium per peril, which are then overlaid with penetration rates for landlords, seasonal homes, and condo units. Results are corroborated through selective bottom-up checks, sampled carrier premium roll-ups and broker channel surveys, before adjustments. Key variables in our model include catastrophe-adjusted loss costs, housing starts, mortgage originations, replacement-cost inflation, and channel-specific acquisition expenses. A multivariate regression links these drivers to premium growth, while scenario analysis tests high-loss and soft-market cases.
Data Validation & Update Cycle
Outputs pass three layers of triangulation, variance testing against peer filings, and senior-analyst review. The data set refreshes annually; mid-cycle updates are triggered when catastrophe losses, regulatory caps, or macroeconomic shocks move premiums materially. Before publication, an analyst performs a fresh sense check so clients receive our latest view.
Why Our Canada Home Insurance Baseline Commands Reliability
Published estimates often differ because firms vary in scope, currency basis, and refresh cadence.
Key gap drivers include mixed treatment of rental and seasonal dwellings, conversion of CAD to USD at inconsistent rates, and whether liability riders are folded into premium totals. Mordor's disciplined inclusion criteria, annual rebuild-cost recalibration, and dual-track modeling keep our baseline balanced and traceable.
Benchmark comparison
| Market Size | Anonymized source | Primary gap driver |
|---|---|---|
| USD 25.05 B (2025) | Mordor Intelligence | |
| USD 13.4 B (2024) | Regional Consultancy A | Excludes tenant and seasonal policies; static average premium assumption |
| CAD 25 B (2025) | Industry Association B | Combines commercial property with homeowner lines; values left in CAD |
| USD 15.0 B (2024) | Global Consultancy C | Reports homeowner segment only; conservative catastrophe load factor |
These comparisons show that when variables are aligned, Mordor's numbers sit at the midpoint of plausible ranges, giving decision-makers a dependable, transparent anchor.


Key Questions Answered in the Report
How big is the Canada home insurance market in 2026?
The Canada home insurance market is worth USD 26.71 billion in 2026 and is forecast to reach USD 36.79 billion by 2031 at a 6.62% CAGR.
Which policy type holds the largest Canada home insurance market share?
Comprehensive coverage leads with a 63.45% share in 2025 owing to its all-perils protection, and it is growing at a 7.39% CAGR through 2031.
Why are premiums rising faster in Alberta?
Alberta experiences higher hail and flood exposure, and the 2024 hailstorm triggered 9.0% average premium increases as carriers priced at greater risk.
What role do banks play in the distribution landscape?
Banks control 31.60% of the market by bundling home policies with mortgages, yet online channels are expanding the fastest at an 11.02% CAGR.
How are regulators influencing the market?
OSFI’s 2025 capital rules require higher catastrophe reserves and robust solvency assessments, prompting consolidation and more accurate risk-based pricing.
Are smart-home devices really lowering insurance costs?
Yes. Insurers offer 5-20% discounts for monitored leak sensors, smoke alarms, and security cameras, which reduce claim frequency and severity.
Page last updated on:


