Market Overview
| Study Period | 2020 - 2031 |
|---|---|
| Forecast Data Period | 2026 - 2031 |
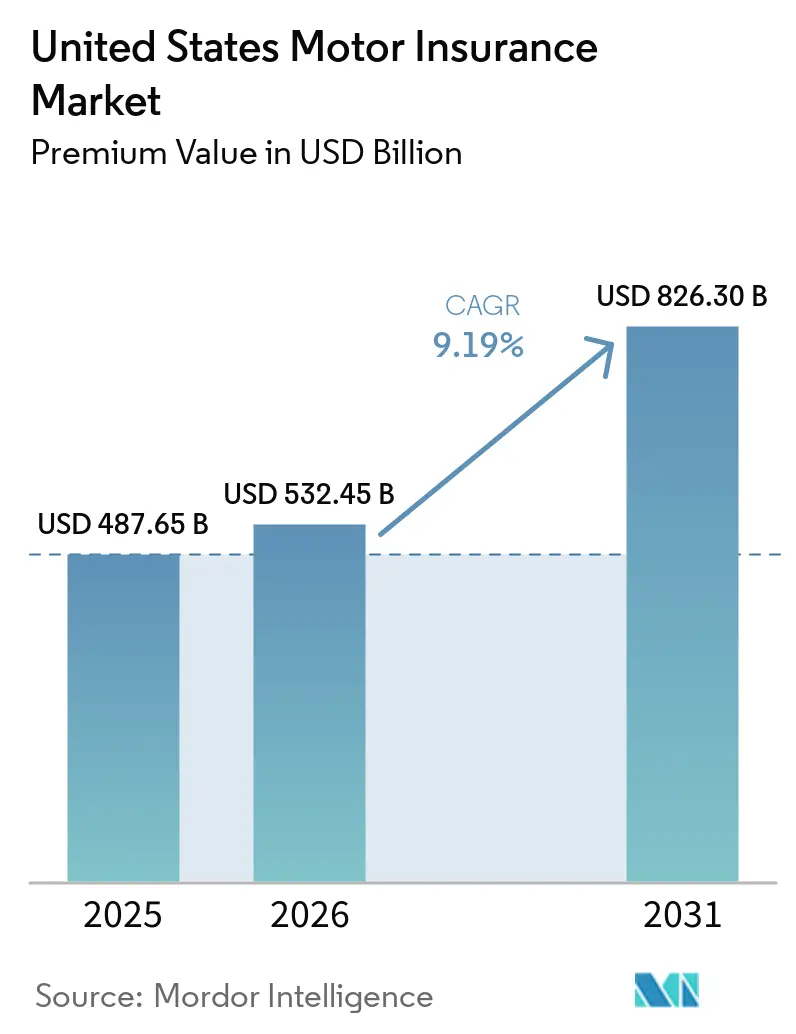
| Base Year Market Size (2025) | USD 487.65 Billion |
| Market Size (2026) | USD 532.45 Billion |
| Market Size (2031) | USD 826.30 Billion |
| Growth Rate (2026 - 2031) | 9.19% CAGR |
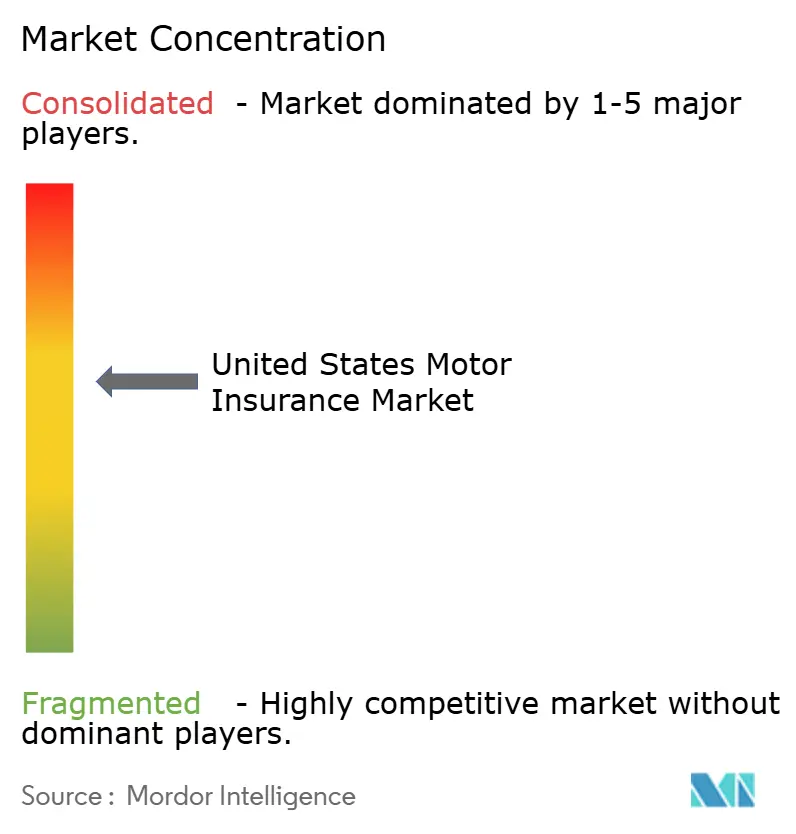
| Market Concentration | Medium |
Major Players *Disclaimer: Major Players sorted in no particular order Image © Mordor Intelligence. Reuse requires attribution under CC BY 4.0. | |
United States Motor Insurance Market Analysis by Mordor Intelligence
The United States Motor Insurance Market size in terms of premium value is projected to expand from USD 487.65 billion in 2025 and USD 532.45 billion in 2026 to USD 826.30 billion by 2031, registering a CAGR of 9.19% between 2026 to 2031.
Personal motor policies remain the revenue anchor, yet commercial motor insurance is scaling faster on fleet growth, safety technology adoption, and telematics requirements that enable real-time driver monitoring and maintenance verification. Liability lines dominate due to state minimum limits and the continued escalation of bodily injury severity, even as national fatalities decline, a trend that reinforces rate adequacy needs and claims management discipline. The distribution mix is shifting as agencies hold a sizable presence while digital and InsurTech channels capture momentum through embedded offerings at dealerships and connected-vehicle programs that reduce acquisition friction and improve pricing precision. Adoption of artificial intelligence is changing underwriting and claims operations, with carriers reporting measurable improvements in speed, cost, and service quality from generative and agentic AI deployments. Regional performance is influenced by catastrophe volatility in coastal states, regulatory timelines in California and New York, and electric vehicle adoption in the West, which together shape rate actions, product mix, and capital allocation decisions across the United States motor insurance market.
Key Report Takeaways
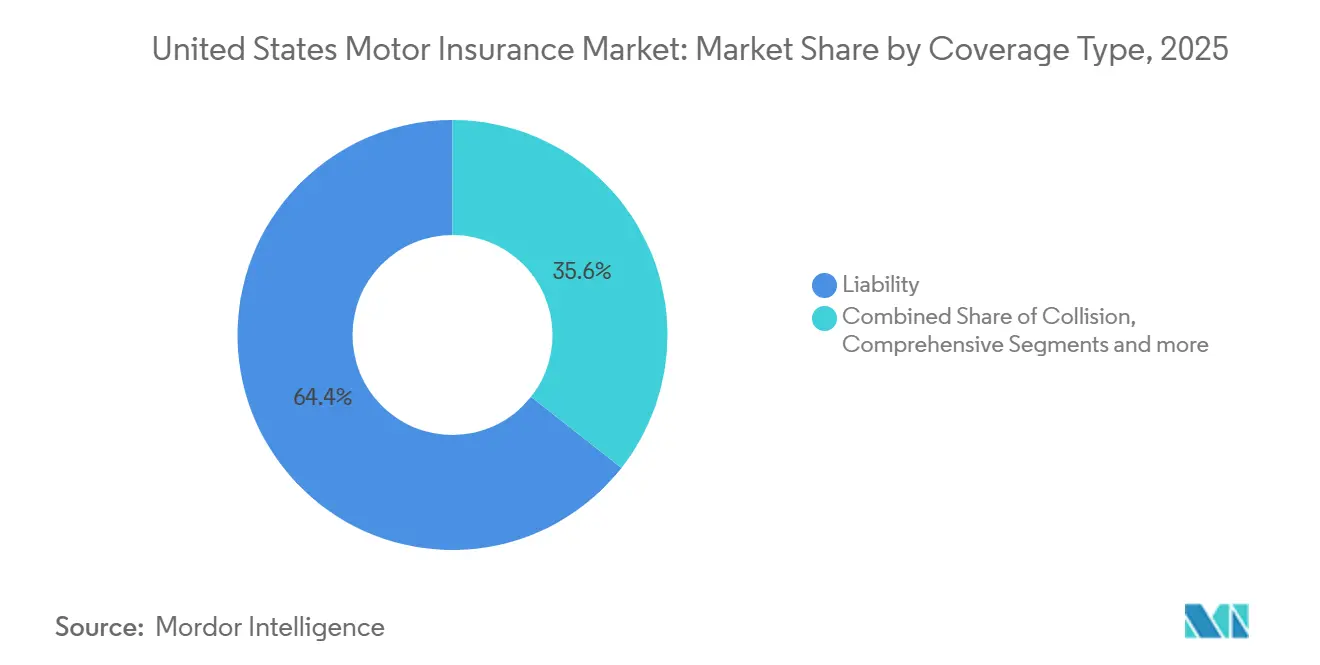
- By coverage type, liability led with 64.39% of the United States motor insurance market share in 2025, while comprehensive is projected to expand at a 6.77% CAGR through 2031.
- By vehicle type, passenger cars accounted for 69.76% of the United States motor insurance market share in 2025, and motorcycles are forecast to grow fastest at a 7.39% CAGR to 2031.
- By policy type, personal motor held 76.35% of the United States motor insurance market share in 2025, while commercial motor is projected to grow at a 9.38% CAGR through 2031.
- By distribution channel, the agency channel held 44.39% of the United States motor insurance market share in 2025, and digital or insurtech platforms are expected to grow at an 11.37% CAGR through 2031.
- By geography, the South commanded 33.37% of the United States motor insurance market share in 2025, while the West is projected to grow fastest at an 8.39% CAGR through 2031.
Note: Market size and forecast figures in this report are generated using Mordor Intelligence’s proprietary estimation framework, updated with the latest available data and insights as of January 2026.
United States Motor Insurance Market Trends and Insights
Drivers Impact Analysis*
| Driver | (~) % Impact on CAGR Forecast | Geographic Relevance | Impact Timeline |
|---|---|---|---|
| Rising Severity & Frequency of Auto Accidents in Urban Corridors | +1.2% | National, with a concentration in metropolitan statistical areas (MSAs) | Medium term (2-4 years) |
| Regulatory Approval of Telematics-Based UBI Across 48 States | +1.8% | National, early leadership in California, New York, Texas | Short term (≤ 2 years) |
| Higher Vehicle Transaction Prices Elevating Insured Values | +1.5% | National, accelerated in the West and Northeast regions | Medium term (2-4 years) |
| Growth of EV Fleet Driving Specialized Coverages | +1.3% | National, with early gains in California, Washington, and Nevada | Medium term (2-4 years) |
| Embedded Insurance Partnerships with OEMs & Digital Dealers | +1.1% | National, the strongest adoption among Generation Y/Z buyers | Short term (≤ 2 years) |
| AI-Driven Claims Automation Lowering LAE | +2.3% | National | Short term (≤ 2 years) |
| Source: Mordor Intelligence | |||


Rising Severity & Frequency of Auto Accidents in Urban Corridors
Traffic fatalities fell 8.2% in the first half of 2025 to 17,140 deaths, and the fatality rate per 100 million vehicle miles travelled declined to 1.06, the lowest mid-year level since 2014, while urban corridors still present elevated risk concentrations that pressure pricing and claims handling [1]Source: National Highway Traffic Safety Administration, “NHTSA Reports Sharp Drop in Traffic Fatalities in First Half of 2025,” National Highway Traffic Safety Administration, nhtsa.gov. Bodily injury claim severity continued to rise, with the average third-party bodily injury payout reaching USD 29,900 per injured party in the second quarter of 2025, up 9.6% from the second quarter of 2024[2]Source: CCC Intelligent Solutions, “Crash Course Q4 2025,” CCC Intelligent Solutions, cccis.com. As of the second quarter of 2025, bodily injury indemnity accounted for 52% of all liability dollars paid, highlighting the shift toward casualty exposure in insurer loss costs. Work zone crashes show higher rear-end involvement and noticeable links to distraction compared to non-work zone crashes, heightening attention to roadway context and time-of-day patterns in pricing models. Carriers are tightening underwriting, expanding telematics-based risk scoring, and deploying advanced analytics to refine urban exposure segmentation as the United States motor insurance market seeks sustained loss ratio improvement.
Higher Vehicle Transaction Prices Elevating Insured Values
Average new vehicle selling prices exceeded USD 50,000 in the third quarter of 2025, while new loans averaged USD 42,600 at 7% APR, and used loans averaged around USD 30,000 at nearly 11% APR, changes that lift insured values and premium needs for physical damage coverages. Parts inflation moved from around 7% in August 2025 to 9% to 10% in September 2025, adding pressure to claim severity in collision and comprehensive lines[3]Source: Polly Insurance, “Embedded Car Insurance Study 2025,” Polly Insurance, polly.co. The Bureau of Labor Statistics continues to flag elevated cost levels across motor-vehicle-related categories, reinforcing the inflationary backdrop for claim costs and policy pricing. Negative equity on trade-ins rose to 28% in the third quarter of 2025, and repossessions reached their highest level in 15 years, developments that can influence coverage selections and gap-related protections. Claims analytics teams continue to factor these cost layers into rating and reserving practices to keep pace with shifting severity dynamics.
Embedded Insurance Partnerships with OEMs & Digital Dealers
Evidence of rising interest in point-of-sale insurance is strong, with survey data showing that 84% of younger buyers want embedded insurance in the dealership, 69% would upgrade vehicles if they could save on insurance, and 73% would buy extra protection products if insurance savings were available[4]Source: Volvo Cars Media, “Volvo Car Financial Services Introduces Independent Insurance Agency…,” Volvo Cars, volvocars.com. The premium averaged USD 198 per month in 2024, up 9.2% from the prior year, a dynamic that has car buyers seeking at-purchase options that bundle coverage and lower the total monthly payment. Volvo Car Financial Services launched Volvo Car Insurance Services in August 2025, enabling consumers to obtain quotes and manage policies through the Volvo Cars app and website across multiple initial markets. GEICO and Daimler Truck Financial Services introduced a connected insurance solution for commercial trucks in October 2025 that uses real-time telematics data to assess risk and can deliver up to 10% premium savings for eligible customers who share driver data. Partnerships at the point of vehicle sale are streamlining quoting, improving conversion, and lowering acquisition costs as the United States motor insurance market builds new embedded distribution rails.
AI-Driven Claims Automation Lowering LAE
A broad majority of auto insurers are now using, planning to use, or exploring artificial intelligence and machine learning for underwriting, pricing, and claims handling, reflecting 88% adoption intent in recent federal analysis. The Travelers Companies invested more than USD 1.5 billion in 2024 on information technology modernization, with approximately half aimed at cloud, analytics, data, and AI to digitize the value chain and accelerate speed to market. While regulators continue to flag risks related to bias, transparency, cybersecurity, and privacy, operational gains from fast triage, automated communications, and predictive analytics are compressing loss-adjustment expenses and improving cycle time. These process improvements strengthen pricing and reserving discipline and free specialist resources for complex claims across the United States motor insurance market.
Restraints Impact Analysis*
| Restraint | (~) % Impact on CAGR Forecast | Geographic Relevance | Impact Timeline |
|---|---|---|---|
| Margin Compression from Direct-Writer Insurtechs | -0.8% | National, concentrated in urban markets with high smartphone penetration | Medium term (2-4 years) |
| Rising Repair Costs for ADAS-Equipped Vehicles | -1.4% | National, intensified in states with high vehicle age and calibration requirements. | Long term (≥ 4 years) |
| Cat-Loss Volatility from Severe Weather in Coastal States | -1.1% | South and West regions, particularly Florida, Texas, California, and the Gulf Coast states | Short term (≤ 2 years) |
| Rate-Filing Caps & Delays in CA and NY | -0.6% | California and New York | Medium term (2-4 years) |
| Source: Mordor Intelligence | |||
Cat-Loss Volatility from Severe Weather in Coastal States
The United States recorded 27 billion-dollar weather and climate disasters in 2024 with total costs of USD 182.7 billion, reflecting a sustained pattern of severe convective storms, tropical cyclones, and other extremes that shape premium and capacity decisions in coastal states. Global insured catastrophe losses were elevated in 2025, and the early 2025 Palisades Fire in Southern California was reported as the costliest wildfire event on record globally with USD 40 billion in insured losses, underscoring the volatility facing carriers with Western exposure. Insurers have responded by tightening underwriting appetites in certain high-risk areas and revisiting reinsurance arrangements, which influence rate actions and product availability for households and small businesses. Catastrophe modelling and granular geospatial analytics remain central to capacity deployment and deductible strategies in the South and West. These volatility dynamics feed directly into comprehensive pricing and coverage terms across the United States motor insurance market.
Rate-Filing Caps & Delays in CA and NY
California increased minimum auto liability limits effective January 1, 2025, raising bodily injury and property damage minimums and reinforcing the primacy of liability coverage in consumer portfolios. California’s regulatory cadence also affects rate timing, with State Farm filing for a 6.2% rate reduction effective February 23, 2026, if approved, following a 17.7% increase less than a year earlier, steps that show the interplay between claims costs and consumer pricing in a heavily regulated market. New York’s proposed discount-only telematics framework would prohibit premium increases due to telematics program results and could prompt base rate adjustments to sustain revenue under more constrained pricing rules. These dynamics slow the response to medical and repair cost inflation and catastrophe losses, which in turn influences carrier participation and product design. As a result, the United States motor insurance market navigates uneven regulatory timeframes that affect rates, underwriting, and the pace of innovation in key states.
*Our forecasts treat driver/restraint impacts as directional, not additive. The impact forecasts reflect baseline growth, mix effects, and variable interactions.
Segment Analysis
By Coverage Type: Liability Dominates, Comprehensive Accelerates Amid Catastrophe Pressure
Liability coverage held 64.39% of the United States motor insurance market in 2025, as state minimum limits and rising injury severity continue to elevate liability exposure for carriers and policyholders. The increase in minimum bodily injury limits in California, effective January 2025, illustrates how regulation supports higher coverage adoption and larger limit selection for households and small fleets. The average third-party bodily injury payout rose to USD 29,900 per injured party in the second quarter of 2025, a 9.6% year-over-year increase that influences liability rate filings and reserve practices across the United States motor insurance market. Comprehensive coverage growth is supported by catastrophe volatility, with the nation experiencing 27 billion-dollar weather and climate events in 2024 and sustained severe storm activity that lifts physical damage claims. Collision premiums remain sensitive to repair complexity, as average repair costs approached USD 5,000 in the third quarter of 2025, and calibration requirements increased with the spread of advanced driver assistance technologies.
Comprehensive is projected to be the fastest-growing coverage line at a 6.77% CAGR to 2031 as climate-driven events and vehicle technology costs reinforce the case for broad physical damage protection in the United States motor insurance industry. Personal injury protection and uninsured or underinsured motorist coverages are expanding in jurisdictions with affordability challenges and high litigation risk, informed by federal and state analyses of market behaviour and consumer protections. The calibration burden from advanced driver assistance systems is altering severity for both collision and comprehensive claims, which encourages carriers to steer repairs into certified facilities and to adjust labour allowances and parts sourcing strategies. These shifts underpin a more granular coverage mix as the United States motor insurance market aligns pricing and product options with loss experience and regulatory obligations.


By Vehicle Type: Passenger Cars Lead, Motorcycles Surge on Leisure Demand
Passenger cars accounted for the largest share of the United States motor insurance market in 2025, supported by a car parc exceeding 295 million vehicles in the second quarter of 2025 and an average vehicle age of 12.7 years that shapes repair and replacement dynamics. Commercial fleets in light and heavy commercial vehicle categories face elevated frequency and severity risk, but the rate environment in 2026 is moderating, with many insureds seeing increases in the 10% to 15% range compared to the 20%-plus hikes common in recent years. Motorcycle policies are posting the fastest growth within vehicle types on the back of leisure demand and specialized coverage options that focus on accessories and seasonal usage patterns. Specialty and recreational vehicles add niche opportunities as underwriters tune products for collector, off-road, and limited-use risk profiles, which call for precise valuation and agreed value options. Electric and hybrid vehicles accounted for a rising share of repairable claims among newer vehicles in 2025, introducing distinct labour and parts requirements for claims operations in the United States motor insurance market.
The United States motor insurance market size for motorcycles is projected to expand at a 7.39% CAGR between 2026 and 2031 as product breadth and pricing sophistication improve in line with rider demographics and seasonality. Commercial fleet growth and safety technology mandates are propelling the adoption of telematics, GPS tracking, dash cameras, and maintenance documentation that are increasingly expected by underwriters in their risk reviews. EV repair demands nearly 4 additional labour hours and higher labour costs versus internal combustion vehicles, and the parts count per repair also differs, which changes the claims cost structure at the vehicle line level. Insurers are refining total loss thresholds and certified network strategies to mitigate cycle time and improve outcomes for high-tech vehicle segments across the United States motor insurance market. These shifts suggest vehicle type risk segmentation will continue to evolve as fleet electrification, ADAS penetration, and niche segments reshape loss patterns in the United States motor insurance industry.
By Policy Type: Personal Motor Leads, Commercial Motor Outpaces on Fleet Growth
Personal motor insurance held 76.35% of the United States motor insurance market in 2025, while direct written premiums in personal auto grew 13.6% to USD 359 billion in 2024 as carriers priced for severity and catastrophe exposure. Shopping activity rose to historic highs, and retention dropped, raising acquisition costs and pushing carriers to make targeted rate filings and product changes to balance growth and profitability. Commercial motor insurance is poised to outpace personal lines through 2031 as fleets deploy telematics, onboard cameras, and driver coaching programs that reduce frequency and provide credible safety data to underwriters. Rate increases in commercial auto are moderating in 2026 for many insureds, aided by better data visibility and risk control adoption. These dynamics shape retention, customer lifetime value, and the mix of coverage limits within the United States motor insurance market as policyholders calibrate price to protection.
The United States motor insurance market size for commercial motor is projected to expand at a 9.38% CAGR from 2026 to 2031, led by safety technology adoption and insurer expectations for real-time driver monitoring and documented maintenance. Commercial combined ratios remain above 100 while personal auto results improved in 2025, reflecting different severity drivers and legal environments that affect pricing action and underwriting margin. Businesses with strong safety programs, consistent hiring practices, and embedded telematics are more likely to secure favourable terms and steady renewal outcomes. Over the forecast period, rising EV and ADAS penetration in both personal and commercial books will continue to influence coverage design and claims practices across the United States motor insurance market.

By Distribution Channel: Agencies Hold, Insurtech Platforms Disrupt
Agencies retained 44.39% of the United States motor insurance market in 2025, with independent agents delivering personalization, carrier choice, and advisory support in a complex rate and product environment. Independent agents’ personal lines share rose to 39.0% in 2024 from 38.7% in 2023 and 35.7% in 2020, which shows continued relevance for the channel in auto risk placement. Agency expansion remains active, illustrated by Smart Choice signing a record 577 new agencies in the first four months of 2024, momentum that benefits carrier distribution reach. Direct and owned distribution channels are investing more in marketing and analytics to improve conversion, cross-sell, and retention in the United States motor insurance market.
Digital and insurtech platforms are projected to grow fastest at an 11.37% CAGR through 2031 as embedded insurance gains traction at dealerships and within OEM ecosystems. GEICO and Daimler Truck Financial Services launched a connected commercial truck insurance solution in October 2025 that can save eligible customers up to 10% by sharing telematics data, a proof point for integrated distribution and pricing. Volvo Car Financial Services introduced Volvo Car Insurance Services in August 2025, offering digital quoting and policy management, which aligns financial services and risk protection at the point of sale. Marketing investment by large carriers continues to scale in support of digital acquisition, with Allstate disclosing a significant increase over the last 12 months to support growth and service improvements. These shifts indicate a durable hybrid distribution model where agencies, direct channels, and embedded partners each play distinct roles in the United States motor insurance market.
Geography Analysis
The South commanded 33.37% of 2025 premiums in the United States motor insurance market, supported by larger populations and higher vehicle exposure in states such as Texas and Florida. Florida’s legislative reforms reduced litigation costs and supported rate relief, with the state’s largest carriers initiating cuts and Progressive announcing a nearly USD 1 billion policyholder credit for around 2.7 million customers in October 2025. Florida’s auto liability loss ratio fell to 53.3% in 2024, the lowest nationally, down from 80.5% in 2022, while total litigation filings were reported to have declined in that period, though carriers continue to monitor fraud and attorney involvement closely. Texas remains litigious with elevated claim costs, and rate increases in commercial auto average 8% to 10%, a factor in capital allocation and pricing discipline for fleets in the region. The West is projected to grow fastest at an 8.39% CAGR to 2031 as EV adoption and embedded partnerships scale, which elevates the need for specialized underwriting and claims capabilities in that region. These dynamics illustrate how catastrophe risk, legal environment, and technology adoption drive regional variance within the United States motor insurance market.
The Midwest contributes a stable share of premiums with balanced loss ratios in several states. Ohio recorded more than USD 9 billion in direct written premiums, with independent agents writing 64.5% of all property and casualty policies, underscoring the channel’s strength in the state. Ohio’s personal auto premiums rose in recent years, averaging 9.5% annual growth, while loss ratios stayed in the mid-60% range compared with nearly 70% nationally, giving carriers room to compete on service and bundling. The state’s market leaders included State Farm at 21%, Progressive at 19%, and Allstate at 11% as of 2025, a distribution that shapes competitive tactics and product positioning. Catalytic converter thefts fell to 77 incidents in 2024, though the state still appears in the top ten nationally for such claims and remains vigilant about theft-prevention strategies. Illinois has seen increased loss frequency in certain risk segments, which has pushed rates higher for some risks placed in the London market, a development that affects cross-border and specialty placements for regional carriers.
The Northeast faces complex regulatory oversight and high repair costs, with New York considering discount-only telematics rules that would bar premium increases due to telematics scores and push some carriers to adjust base rates to maintain overall rate adequacy. New Jersey raised the minimum financial responsibility limit to USD 1.5 million in July 2024 for larger commercial vehicles, leading some carriers to require excess layers or scale back appetite in certain segments. Pennsylvania’s EV adoption rate reached 0.69% with registrations concentrated in major urban areas, which influences charging infrastructure risk and vehicle repair networks. In the West, California’s EV adoption rate was the highest in the nation at 3.41% while the state increased minimum liability limits in January 2025, both affecting pricing and coverage take-up. The Palisades Fire in early 2025 produced USD 40 billion in insured losses in Southern California, shining a spotlight on the need for robust reinsurance and risk selection in Western portfolios within the United States motor insurance market.
Competitive Landscape
The United States motor insurance market exhibits moderate concentration, with Progressive Insurance Group rising to number one in 2024 by capturing 16.4% of direct written premiums compared to State Farm’s 16.2% while Berkshire Hathaway, Allstate, and USAA comprised the remainder of the top five. The total automobile sector’s direct written premiums increased 12.8% to USD 431.69 billion in 2024, while the adjusted loss ratio improved to 67.4% from 75.4% in 2023, indicating underwriting repair in personal auto and ongoing adjustments in commercial segments. Carriers are investing in brand and acquisition, with Allstate disclosing increased marketing investments over the last 12 months to support customer growth and strengthen service outcomes. State Farm filed for a 6.2% rate reduction in California, effective February 23, 2026, if approved, reflecting a response to moderating physical damage claims and the state’s evolving regulatory setting.
Technology and data are critical to competitiveness, with federal analysis showing 88% of surveyed auto insurers using or exploring AI for underwriting, pricing, and claims handling. Travelers invested more than USD 1.5 billion in 2024 to modernize technology, with nearly half directed to cloud, analytics, data modernization, and AI, reinforcing a long-term platform for product speed and personalized underwriting. Direct-writing InsurTech reinforces competitive pressure on price and experience, with Lemonade improving its car gross loss ratio to 76% in the third quarter of 2025 and accelerating expansion into new states. The United States motor insurance market is therefore balancing scale efficiencies and digital transformation with targeted product and segment strategies to defend and grow share.
White-space product opportunities are most visible in EV coverages, embedded insurance at the point of sale, and connected commercial fleet offerings that reward safe behaviours and maintenance discipline. GEICO and Daimler Truck Financial Services launched a data-driven telematics product for commercial trucking that can deliver up to 10% premium savings for eligible data-sharing customers, which demonstrates how partnerships can lift value and retention while lowering loss costs. GEICO also partnered with Motive in November 2025 to expand fleet safety and savings as part of its national commercial trucking expansion, connecting operational data to pricing and risk management. Volvo Car Insurance Services launched in August 2025 to provide digital access and bundling options that integrate with vehicle financing and servicing, a template that other OEMs are exploring. These initiatives show how partnerships, telematics, and digital quoting can produce tangible advantages in acquisition cost, conversion, customer experience, and loss performance within the United States motor insurance market. Competitive intensity remains moderate as top-tier carriers scale platforms and midsize companies and insurtechs attack niches where mobile-first buying and embedded options unlock new growth.
United States Motor Insurance Industry Leaders
GEICO (Berkshire Hathaway Inc.)
Progressive Corp.
Allstate Corp.
United Services Automobile Association (USAA)
Liberty Mutual Holding Co. Inc.
- *Disclaimer: Major Players sorted in no particular order

Recent Industry Developments
- November 2025: GEICO partnered with Motive to deliver insurance savings and safer roads for organizations managing commercial fleets, expanding its commercial trucking insurance nationwide, and leveraging connected vehicle data for efficiency, cost savings, and enhanced safety.
- October 2025: GEICO and Daimler Truck Financial Services launched a new data-driven telematic insurance product in the United States, a connected insurance solution for commercial truck customers using real-time telematics data from Daimler Truck's platform to assess risk and reward safe driving, targeting owner-operators and small fleets with Freightliner and Western Star trucks, with eligible customers able to save up to 10% on insurance premiums by sharing driver data.
- August 2025: Volvo Car Financial Services launched Volvo Car Insurance Services, the company's first-ever independent insurance agency in the United States, to provide a seamless ownership experience with tailored coverage, nationwide repair access, and a simplified digital quoting process, offering auto, home, umbrella, and select specialty products through the Volvo Cars App and company website, with initial markets including Alabama, Arizona, Idaho, Illinois, Indiana, Kentucky, Maryland, Maine, Montana, New Hampshire, New Mexico, Ohio, Oregon, Pennsylvania, Tennessee, Utah, Vermont, and Wyoming, and plans for expansion.
- March 2025: Liberty Mutual Insurance announced the planned consolidation of all personal lines products under the Liberty Mutual brand starting in 2026, retiring the Safeco Insurance brand, which has operated through the independent agent channel since its 2008 acquisition and generates over USD 13 billion in annual premiums across 48 United States states via 22,000 independent agencies, with the move aiming to fully leverage the Liberty Mutual brand value, simplify the business, dedicate marketing power to a single brand, and scale technology for unified products across channels.


Research Methodology Framework and Report Scope
Market Definitions and Key Coverage
Our study defines the U.S. motor insurance market as all direct written premiums generated by policies that protect passenger cars, motorcycles, light and heavy commercial vehicles against liability, collision, comprehensive, personal-injury protection, and uninsured or under-insured risks, across personal and commercial lines and through every distribution channel.
Scope exclusion: ancillary products such as mechanical-breakdown warranties, roadside-assistance memberships, and OEM extended-service contracts are outside this study.
Segmentation Overview
- By Coverage Type
- Liability
- Collision
- Comprehensive
- Personal Injury Protection (PIP)
- Uninsured / Under-insured Motorist
- By Vehicle Type
- Passenger Cars
- Light Commercial Vehicles
- Heavy Commercial Vehicles
- Motorcycles
- Specialty & Recreational Vehicles
- By Policy Type
- Personal Motor Insurance
- Commercial Motor Insurance
- By Distribution Channel
- Agency Channel
- Independent Agents
- Captive/Exclusive Agents
- Direct Response (Company-Owned)
- Bancassurance & Affinity Partnerships
- Digital / Insurtech Platforms
- Agency Channel
- By US Region
- Northeast
- Midwest
- South
- West
Detailed Research Methodology and Data Validation
Primary Research
Structured interviews with underwriting managers, claims leaders, state regulators, collision-repair networks, and insurtech executives across all four U.S. census regions allowed us to test rate-hike assumptions, telematics penetration, average insured values, and self-insured fleet prevalence before locking the model.
Desk Research
We began with NAIC statutory filings, Federal Highway Administration vehicle-parc records, Bureau of Labor Statistics repair-cost indices, and NHTSA crash files to anchor frequency, severity, and exposure curves. Trade bodies such as the Insurance Information Institute and American Property Casualty Insurance Association provided loss-ratio and rate-approval context.
Our team then mined carrier 10-Ks and investor decks via D&B Hoovers and Dow Jones Factiva, while Questel patent alerts on telematics and Volza shipment data for replacement parts spotlighted emerging cost drivers. The sources named are illustrative; many additional open and licensed references were consulted for corroboration.
Market-Sizing & Forecasting
A top-down rebuild starts with NAIC direct-written totals, adjusted for captives, self-insured fleets, and unreported digital programs, then is cross-checked through sampled average-selling-price × in-force-vehicle calculations. Bottom-up carrier roll-ups act as a control, and any gaps are closed through iterative triangulation. Five core variables, new-vehicle sales, vehicle miles traveled, bodily-injury severity, approved rate changes, and telematics enrollment, feed a multivariate regression that projects premiums, which, according to Mordor Intelligence, should reach a significant value in the forecast period. Scenario analysis captures swings from repair-cost inflation and severe-weather loss spikes.
Data Validation & Update Cycle
Outputs pass automated variance checks and a multi-analyst peer review. Reports refresh annually, and we trigger interim updates when limit hikes, catastrophes, or major M&A materially shift the baseline.
Why Mordor's US Motor Insurance Baseline Is Dependable
Published estimates often diverge because analysts apply different coverages, currency dates, or refresh cadences.
Key gap drivers here include our inclusion of both personal and commercial lines, our adjustment for self-insured fleets, and our yearly refresh that folds in every state's latest rate filings, while others lean on static snapshots or omit commercial-auto volatility.
Benchmark comparison
| Market Size | Anonymized source | Primary gap driver |
|---|---|---|
| USD 466 B (2025) | Mordor Intelligence | - |
| USD 430 B (2024) | Regional Consultancy A | Excludes physical-damage cover on small fleets |
| USD 359 B (2024) | Trade Journal B | Omits commercial auto and self-insured conversions |
| USD 198 B (2024) | Industry Association C | Uses net earned premiums rather than direct written |
These contrasts confirm that Mordor Intelligence's disciplined scope choices and timely refresh give decision-makers a transparent, repeatable baseline they can trust.


Key Questions Answered in the Report
What is the current size and outlook of the United States motor insurance market?
The United States motor insurance market size is USD 532.45 billion in 2026 and is forecast to reach USD 826.30 billion by 2031 at a 9.19% CAGR.
Which coverage lines are leading and which are growing fastest in the United States motor insurance market?
Liability leads with a 64.39% share due to state minimums, while comprehensive is projected to grow fastest at a 6.77% CAGR through 2031, supported by catastrophe volatility and repair complexity.
How are telematics and AI changing pricing and claims in the United States motor insurance market?
Telematics programs are approved in 48 states and enable behaviour-based pricing, while AI supports faster, lower-cost claims and service, with 88% of insurers using or exploring AI and leading carriers reporting measurable productivity gains.
Which regions are most influential in the United States motor insurance market?
The South commands the largest premium share while the West is the fastest-growing region due to EV adoption and embedded distribution, with catastrophe exposure and regulatory timelines shaping outcomes across both regions.
Which distribution channels are gaining ground in the United States motor insurance market?
Agencies hold 44.39% share and remain central for advice and carrier choice, while digital and insurtech channels are growing fastest as embedded programs at OEMs and dealers expand.
Page last updated on:


