Market Overview
| Study Period | 2020 - 2031 |
|---|---|
| Forecast Data Period | 2026 - 2031 |
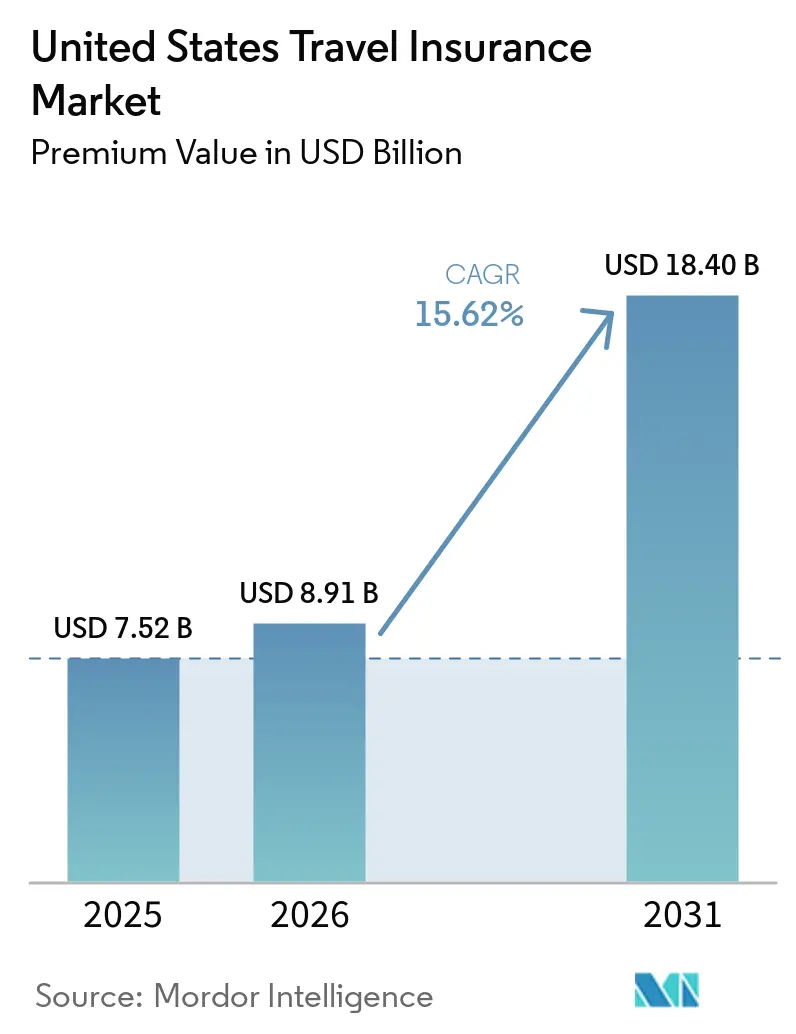
| Base Year Market Size (2025) | USD 7.52 Billion |
| Market Size (2026) | USD 8.91 Billion |
| Market Size (2031) | USD 18.40 Billion |
| Growth Rate (2026 - 2031) | 15.62% CAGR |
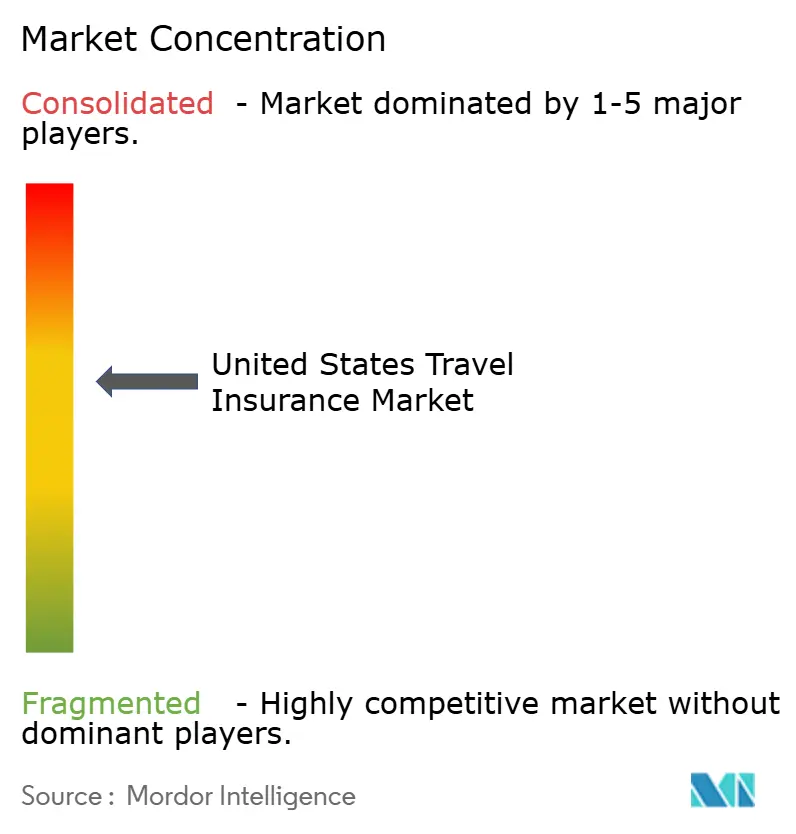
| Market Concentration | Medium |
Major Players *Disclaimer: Major Players sorted in no particular order Image © Mordor Intelligence. Reuse requires attribution under CC BY 4.0. | |
United States Travel Insurance Market Analysis by Mordor Intelligence
The United States Travel Insurance Market size in terms of premium value is projected to expand from USD 7.52 billion in 2025 and USD 8.91 billion in 2026 to USD 18.40 billion by 2031, registering a CAGR of 15.62% between 2026 to 2031.
Driven by heightened risk awareness and a resurgence in outbound leisure travel, the US travel insurance market is witnessing a notable uptick. Sales surged by 15% year on year, with coverage extending to over 148 million Americans. Concerns over extreme weather events further bolster demand, the absence of international coverage under Medicare, and corporate duty-of-care policies. Digital distribution channels play a pivotal role, enhancing the accessibility and reach of these insurance products. Yet, the industry grapples with challenges: premium benefits from credit cards, a patchwork of state regulations, and legal disputes stemming from the pandemic. In response, insurers are not only refining policy language but also channeling investments into trust-building service enhancements, ensuring the market's momentum remains unshaken.
Key Report Takeaways
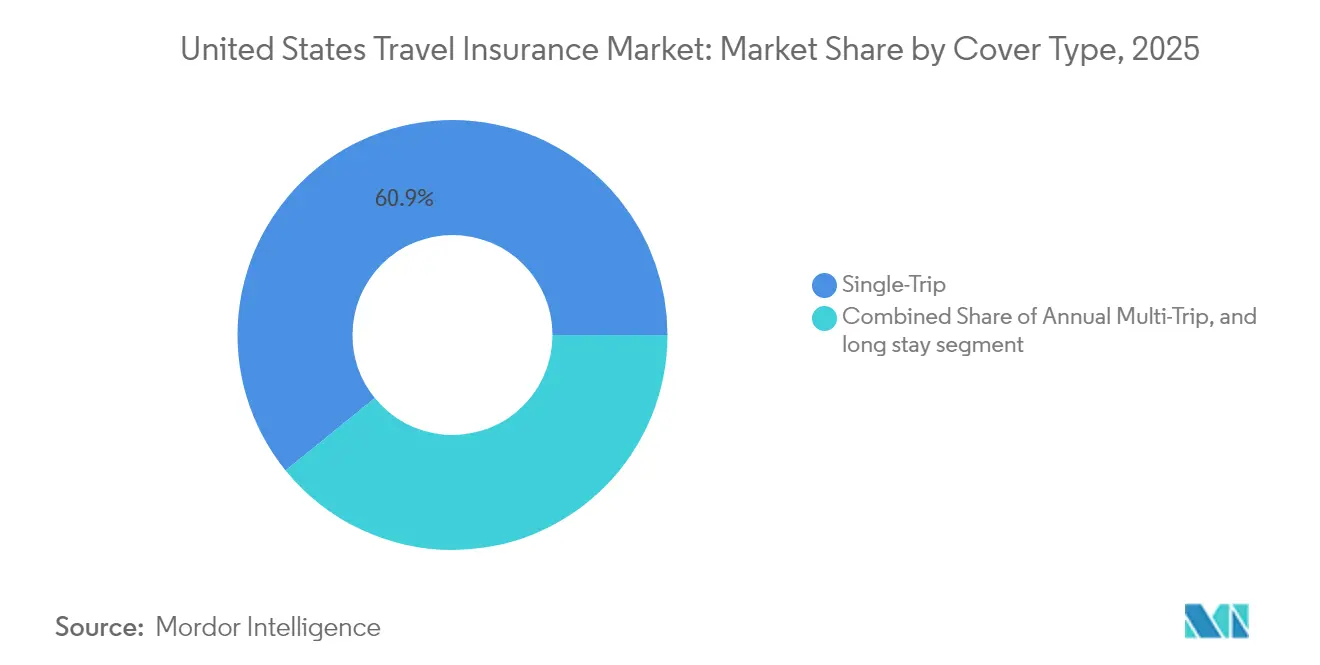
- By insurance cover type, single-trip policies led with 60.85% of United States travel insurance market share in 2025 and annual multi-trip products are projected to grow at 15.94% CAGR through 2031.
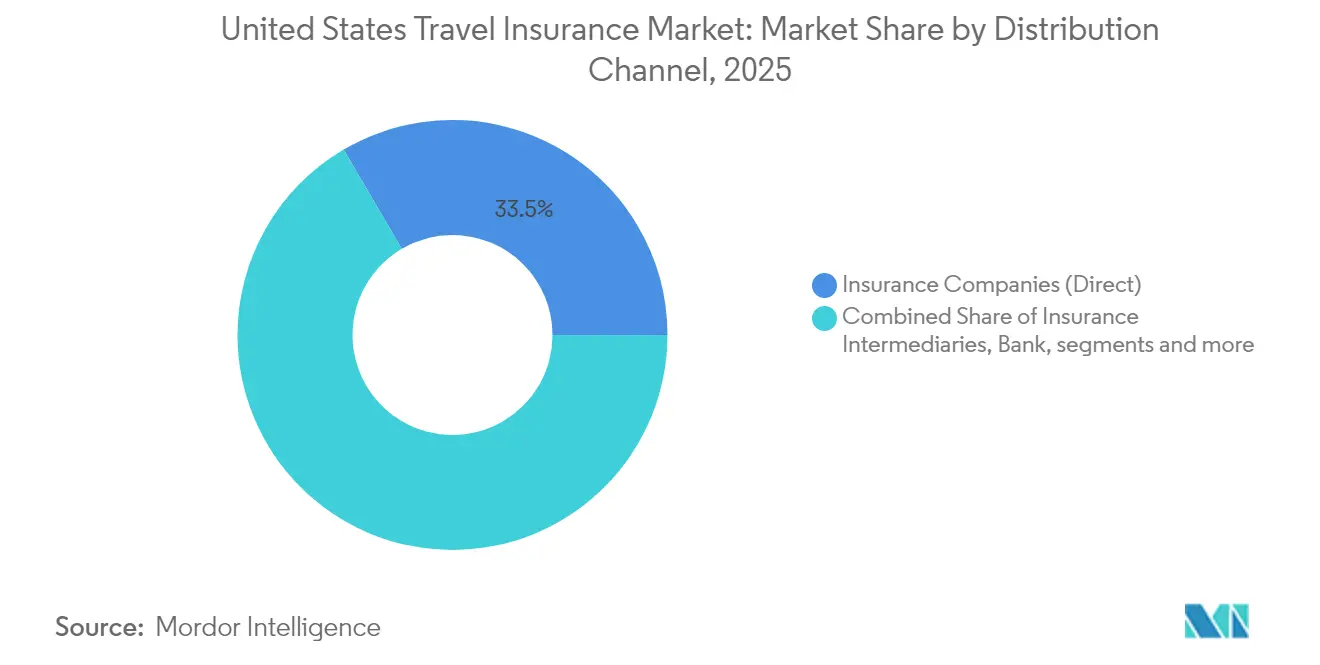
- By distribution channel, insurance Companies (Direct) held 33.45% United States travel insurance market share in 2025, on the contrary banks and credit unions show the highest forecast CAGR at 17.68% to 2031.
- By end user, senior citizens captured 29.85% United States travel insurance market share in 2025 and business travellers post the fastest growth outlook at 21.97% CAGR from 2026-2031.
- By coverage type, emergency medical benefits generated 26.9% of 2025 claims, while trip cancellation and interruption combined for over 40% of payouts.
Note: Market size and forecast figures in this report are generated using Mordor Intelligence’s proprietary estimation framework, updated with the latest available data and insights as of 2026.
United States Travel Insurance Market Trends and Insights
Driver Impact Analysis*
| Driver | (~) % Impact on CAGR Forecast | Geographic Relevance | Impact Timeline |
|---|---|---|---|
| Surge in outbound U.S. leisure travel | +4.2% | National; higher in coastal states | Medium term (2-4 years) |
| Embedded cover via OTAs & airlines | +3.8% | National; strongest in tech-forward urban centers | Short term (≤ 2 years) |
| Extreme weather-related trip disruption | +2.7% | Coastal, hurricane, and wildfire zones | Long term (≥ 4 years) |
| Medicare gaps abroad for retirees | +2.3% | National; emphasis on Florida, Arizona, California | Medium term (2-4 years) |
| Premium credit-card "top-up" awareness expanding voluntary uptake | +1.6% | National, with concentration in high-income urban areas | Short term (≤ 2 years) |
| Affluent Baby-Boomer retirements boosting senior travel frequency | + 1.1% | National, with higher impact in retirement destinations | Medium term (2-4 years) |
| Source: Mordor Intelligence | |||
Surge in Outbound U.S. Leisure Travel
Outbound leisure travel from the U.S. has rebounded, surpassing pre-pandemic levels. Notably, 50% of these travelers are now opting for travel insurance, a significant rise from just 20% in 2020. Furthermore, 15% of travelers are insuring every trip. Financial-loss protection stands out as the primary reason for this coverage, highlighted by 41% of buyers. Younger generations are at the forefront of this trend: 60% of Gen Z and 54% of Millennials are purchasing travel insurance. In contrast, only 45% of Gen X and 43% of Boomers are doing the same, underscoring a generational shift that could reshape long-term demand. Moreover, airlines, cruise lines, and tour operators are witnessing a notable uptick in insurance attachment rates, especially when coverage is bundled during the booking process, bolstering the market's growth trajectory.
Embedded Cover via OTAs & Airlines
The seamless integration of travel insurance into the booking process especially via online travel agencies (OTAs) and airlines has made it notably easier for occasional travelers to opt for coverage. Consequently, 45% of consumers now favor buying insurance directly from their travel providers, moving away from the limited benefits of credit card offerings. Real-time, personalized pricing through API-driven platforms has heightened relevance and boosted conversion rates. In a significant move, PassportCard acquired Pattern in May 2025, propelling the global adoption of embedded insurance solutions among OTAs. As more airlines roll out integrated coverage, insurers are not just increasing customer uptake but are also aiding carriers in turning insurance into a lucrative ancillary revenue stream, further propelling the growth of the U.S. travel insurance market.
Extreme Weather Driving Demand
60% of travelers experienced trip disruption in the past year, and 44% blamed weather. Women (61%) and Boomers (66%) display the highest caution, pushing uptake of cancellation and delay benefits. Claims data mirror the trend: weather-linked delay claims climbed 15% in 2024, with average payouts rising to USD 370. With the 2025–2026 hurricane season forecast as severe, insurers emphasize early-purchase rules and parametric triggers for rapid settlement.
Medicare Gaps Abroad Push Retirees Toward Specialized Coverage
Medicare covers virtually no medical bills outside the US, and Medigap’s foreign emergency benefit caps at USD 50,000 lifetime. The liability gap steers retirees toward bespoke medical plans with higher limits and pre-existing-condition waivers. Senior citizens already account for 30% of written premium, and global senior travel medical sales are forecast at USD 16.7 billion by 2032. Tailored products strengthen customer loyalty and lift the long-term ceiling of the US travel insurance market.
Restraints Impact Analysis*
| Restraint | (~) % Impact on CAGR Forecast | Geographic Relevance | Impact Timeline |
|---|---|---|---|
| Credit-card benefit perception | -1.8% | Affluent urban markets | Medium term (2-4 years) |
| Fragmented state insurance regulation | -1.2% | National; varies by state | Long term (≥ 4 years) |
| Price-sensitive > 70-year travelers | -0.9% | Retirement-heavy states | Medium term (2-4 years) |
| COVID-19 claim litigation | -0.7% | National | Short term (≤ 2 years) |
| Source: Mordor Intelligence | |||
Credit-Card Benefits Suppressing Standalone Sales
Premium cards such as Chase Sapphire Reserve include trip-cancellation limits up to USD 10,000 and delay reimbursement of USD 500, fostering a “free coverage” mindset. Yet exclusions for pre-existing conditions, medical costs, and extended trip lengths dilute actual protection. Insurers counter by marketing “top-up” products that fill card gaps and by highlighting claims-service advantages over bank administrators. Consumer education is repositioning credit-card coverage as a baseline rather than a substitute, slowly easing the drag on the US travel insurance market.
COVID-19 Litigation Eroding Trust
Pandemic claim denials spawned lawsuits and eroded confidence, prompting buyers to scrutinize contract language. Research links higher policy literacy to stronger purchase intent, pushing carriers to simplify wording and publish plain-English summaries. The share of Cancel For Any Reason (CFAR) sales more than doubled to 11.57% by February 2025. underscoring consumer demand for broad, transparent protection.
*Our forecasts treat driver/restraint impacts as directional, not additive. The impact forecasts reflect baseline growth, mix effects, and variable interactions.
Segment Analysis
By Insurance Cover Type: Single-Trip Dominance Faces Multi-Trip Challenge
Single-trip protection held 60.85% US travel insurance market share in 2025 as occasional vacationers favored one-off policies for budget clarity. Purchases spiked during the “revenge-travel” wave, reinforcing the segment’s prominence. However, annual plans are expanding at a 15.94% CAGR, above the overall US travel insurance market. Demand originates from frequent flyers, digital nomads, and families seeking administrative ease over multiple journeys. Providers tempt customers with unlimited-trip scopes, concierge services, and bundled medical telehealth, eroding the legacy cost gap. Some carriers tier annual packages to align premiums with trip frequency, broadening appeal while defending profitability.
Travel patterns signal continued convergence. Corporate road-warriors, now pairing business and leisure stays, discover that annual coverage reimburses both trip types. Remote work visas fuel longer overseas stints, nudging travelers toward plans that accommodate extended calendar spans without repeat paperwork. The eventual equilibrium may see single-trip policies remain the entry point while annual products capture loyalty among upwardly mobile demographics, reshaping both retention economics and the US travel insurance market size at segment level.


By Benefit Type: Medical Expenses Drive Core Demand
Emergency treatment claims accounted for 26.9% of 2025 submissions, with average payouts at USD 1,654. The figure underscores travelers’ primary fear: unexpected healthcare bills abroad. Among retirees, awareness of Medicare’s overseas void further concentrates interest in high-limit medical benefits. Trip cancellation and interruption coverages follow closely, representing more than 40% of aggregate claims as travelers hedge prepaid, non-refundable costs. In both categories, simple wording and instant-claim apps differentiate carriers in the competitive field.
Technology catalyzes new sub-features. Parametric flight-delay add-ons trigger automatic wallet credits when airline data confirm Schedule-B breaches, shrinking claims cycles to minutes. Cybersecurity riders protect personal data and devices, reflecting the modern traveler’s reliance on connected gadgets. Innovation within core benefit types expands perceived value and elevates policy penetration, extending the US travel insurance market size across broadening demand curves.
By Distribution Channel: Digital Transformation Reshapes Sales
Insurers’ proprietary web and mobile portals retained 33.45% US travel insurance market share in 2025, leveraging brand recall and 24/7 service to attract direct buyers. AI chatbots guide quote journeys, while e-wallet claim disbursements cut friction. Yet banks and credit unions post the fastest growth at 17.68% CAGR to 2031, bundling policies with premium checking or wealth-management products. Consumer trust in financial institutions offsets inertia that previously stalled first-time purchases.
Embedded sales through airlines, OTAs, and cruise lines accelerate conversion via context-aware offers. A traveler selecting a Caribbean flight in September sees hurricane add-on prompts; another booking a ski package receives mountain rescue coverage suggestions. Aggregators such as TravelInsurance.com boost transparency by displaying side-by-side prices and verified reviews, steering value-seeking segments to niche underwriters. Seamless APIs, open-banking connections, and white-label dashboards together widen reach and propel the US travel insurance market.
By End User Type: Senior Citizens Lead While Business Travelers Surge
Seniors secured 29.85% US travel insurance market share in 2025, far exceeding their proportion among outbound passengers because of elevated medical risk and coverage gaps. Affluent Boomers view travel as a core retirement pursuit; insurers court them with higher cancellation limits, stability waivers, and a 24-hour medical concierge. Global health crises highlighted the importance of evacuation coverage, nudging older travelers toward premium tiers that raise average policy value.
Business travelers outpace every other cohort with a 21.97% CAGR outlook. Corporations reinstate face-to-face meetings, but duty-of-care protocols now mandate insurance, including mental-health teleconsults and crisis-response features. Hybrid “bleisure” itineraries lengthen stay durations, increasing exposure days and policy spend. Students, adventure tourists, and family groups remain substantive niches; each pushes insurers to refine activity riders, group discounts, or semester-length medical plans. Heterogeneous needs enlarge the total US travel insurance industry while preserving room for specialization.
Geography Analysis
Regional uptake tracks a mosaic of travel habits, demographic profiles, and climate exposure. Coastal states such as New York, California, and Florida generate the highest outbound requirements and thus anchor premium flows. Retirement hubs—Florida tops the list, followed by Arizona and California—show elevated penetration because resident seniors lack overseas Medicare protection and take longer, multi-season journeys. The US travel insurance market size for Florida alone is forecast to top USD 1.12 billion by 2031, expanding at a pace as inbound retirees.
Climate risk sharpens geographic disparities. Hurricane-prone Gulf and Atlantic coasts, alongside wildfire-vulnerable Western states, record the strongest growth in cancellation and delay policy adoption. Fifty-six percent of Americans now rethink visits to weather-exposed locales, seven points above 2019 levels. When storms intensify, booking engines report double-digit jumps in insurance attachment rates for affected routes within 24 hours of National Weather Service alerts. Insurers respond with dynamic pricing that embeds NOAA feeds, but rising claim costs may elevate premiums in the highest-risk ZIP codes.
Regulation compounds geographic nuance. Thirty-six states adopted the NAIC Travel Insurance Model Law by May 2024, advancing toward harmonization, yet filing processes, fee schedules, and producer-licensing rules still vary. Larger underwriters absorb compliance overhead; smaller firms restrict product rollouts, creating uneven consumer choice. Continued alignment would reduce friction and, by unlocking the multistate scale, enlarge the US travel insurance market.
Competitive Landscape
Market structure remains moderately concentrated: the five leading brands accounted for close to 40% of the 2024 written premium. Allianz Partners, AIG Travel Guard, Berkshire Hathaway Travel Protection, Generali Global Assistance, and Seven Corners Inc. rely on balance-sheet strength, extensive broker networks, and recognizable branding. Their combined heft earns preferred placement in airline and OTA checkouts, reinforcing visibility across the US travel insurance market.
Digital-first entrants attack pain points. WorldTrips pushes instant quote journeys under 60 seconds. Squaremouth’s metasearch garners 130,000 verified reviews, steering price-sensitive shoppers to best-fit products. Insurtechs deploy AI to triage underwriting and accelerate claims: 76% of US insurance executives report live generative-AI initiatives by late 2024. Parametric triggers and blockchain smart contracts further shrink settlement times, key for flight-delay or baggage-loss micro-claims.
Strategic alliances reshape channel control. PassportCard’s Pattern purchase arms the carrier with embedded APIs that slot natively into booking sites. Allegiant Travel Company noted a 26.2% rise in third-party revenue after adding insurance to its ancillary bundle. Banks such as JPMorgan embed trip-protection top-ups into wealth-client dashboards, while health-insurer Cigna partners with AXA Assistance to bolt travel medical onto corporate expatriate plans. M&A activity is poised to continue as incumbents source tech capabilities and distribution scale.
United States Travel Insurance Industry Leaders
Allianz Partners
American International Group Inc.
Berkshire Hathaway Travel Protection
Generali Global Assistance
Seven Corners Inc.
- *Disclaimer: Major Players sorted in no particular order

Recent Industry Developments
- May 2025: PassportCard acquired Pattern Insurance Services, boosting embedded distribution firepower
- April 2025: Integrated Specialty Coverages bought TravelInsurance.com to expand direct-to-consumer reach
- March 2025: Allianz Partners rolled out its 2025 travel-trends initiative and enhanced AllTrips annual plan
- November 2024: Allegiant Travel Company recorded a 26.2% gain in third-party product revenue after introducing travel insurance


Research Methodology Framework and Report Scope
Market Definitions and Key Coverage
Our study defines the United States travel insurance market as the gross written premium (and related assistance fees) generated from every standalone or embedded policy bought by U.S. residents for domestic or outbound leisure, business, education, or cruise travel. Policies that bundle medical, trip-cancellation, baggage, emergency evacuation, or adventure-sports riders are fully counted once the premium is booked, irrespective of channel, tenure, or currency of travel.
Scope exclusion: captive self-insured corporate travel risk pools and credit-card chargeback guarantees are not sized.
Segmentation Overview
- By Insurance Cover Type
- Single-Trip Travel Insurance
- Annual Multi-Trip Travel Insurance
- Long-Stay / Extended-Stay Travel Insurance
- By Coverage (Benefit) Type
- Medical & Emergency Care Expense
- Trip Cancellation & Interruption
- Baggage & Personal Effects Loss
- Flight / Travel Delay
- Other Add-On Coverage (Adventure Sports, Rental Car, etc.)
- By Distribution Channel
- Insurance Companies (Direct)
- Insurance Intermediaries & Agents
- Banks & Credit Unions
- Online Aggregators & Comparison Portals
- Travel Agencies & OTAs
- Airlines & Cruise Lines (Embedded)
- By End User Type
- Senior Citizens (65+)
- Family Travelers
- Business Travelers
- Student / Educational Travelers
- Solo Backpackers & Adventure Travelers
- By Geography
- Northeast
- Midwest
- South
- West
Detailed Research Methodology and Data Validation
Primary Research
Our analysts spoke with underwriting managers, affinity brokers, online travel agencies, airline ancillaries heads, and seasoned travelers across all U.S. census regions. These conversations validated policy-take-up ratios, embedded-offer conversion rates, average premium dispersion, and typical claim frequencies, allowing us to stress-test desk findings and refine model drivers.
Desk Research
We began with publicly accessible datasets such as the U.S. Department of Transportation's monthly enplanement statistics, the National Travel & Tourism Office's outbound departures, NAIC travel-insurance premium filings, and United States Travel Insurance Association policy-count surveys. Broader context came from Bureau of Economic Analysis household spending tables, Federal Reserve exchange-rate files, and Centers for Disease Control travel-health advisories. Company financials from D&B Hoovers and press releases, together with investor decks and reputable trade journals, helped us benchmark channel mix and average selling prices. The sources named above are illustrative; many additional databases and publications were reviewed to cross-check figures and fill gaps.
Market-Sizing & Forecasting
The market baseline is established through a top-down construct that multiplies domestic and outbound trip volumes by policy penetration and calibrated average premiums. Supplier roll-ups from a sampled set of insurers act as the bottom-up check. Key variables include: (1) air and cruise passenger growth, (2) share of trips purchased through digital channels, (3) age-cohort mix, (4) inflation-adjusted premium per trip, (5) claim incidence trends, and (6) embedded insurance share in airline and OTA bookings. Multivariate regression, with GDP per capita and airline seat-miles as lead indicators, projects each driver to 2030, after which scenario analysis adjusts for major regulatory or pandemic shocks.
Data Validation & Update Cycle
Outputs pass a three-layer review where automated variance flags, peer review, and senior analyst sign-off eliminate anomalies. Reports refresh annually, and any material event, such as a pandemic rule change or merger, triggers an interim update before client delivery.
Why Mordor's US Travel Insurance Baseline Commands Reliability
Published estimates often diverge because firms use different scope filters, premium definitions, and refresh cadences.
Key gap drivers include whether embedded airline offers are counted, whether domestic-only trips are excluded, the treatment of assistance-fee revenue, and the currency/inflation adjustments applied. Mordor's model captures the full policy universe, applies live exchange rates, and is refreshed every twelve months, whereas other publishers frequently rely on static post-pandemic baselines or narrow channel cuts.
Benchmark comparison
| Market Size | Anonymized source | Primary gap driver |
|---|---|---|
| USD 7.71 B (2025) | Mordor Intelligence | - |
| USD 3.39 B (2024) | Regional Consultancy A | Excludes embedded airline & OTA sales; conservative premium escalation |
| USD 5.03 B (2024) | Trade Journal B | Counts premiums only, omits assistance fees and CFAR riders |
| USD 3.02 B (2023) | Global Consultancy C | Uses pre-pandemic baseline, no inflation adjustment, limited age segments |
Taken together, the comparison shows that Mordor's disciplined scope choices, variable-level transparency, and timely updates provide decision-makers with a balanced baseline that is both traceable and readily reproducible.


Key Questions Answered in the Report
How big is the United States travel insurance market in 2026?
The United States travel insurance market is worth USD 8.91 billion in 2026 and is projected to reach USD 18.4 billion by 2031.
Which coverage types generate the highest claim payouts?
Trip cancellation and interruption combine for over 40% of 2025 claim payouts, while emergency medical benefits account for 26.9% of claims at an average USD 1,654 per incident.
Why are seniors such a large share of policyholders?
Medicare covers almost no overseas medical costs, so seniors buy supplemental travel medical plans, pushing their segment to 29.85% of 2025 premium volume.
How is embedded insurance changing the market?
Airlines and OTAs integrate policies into booking paths, removing purchase friction; 45% of travelers now prefer obtaining coverage from their travel provider at checkout.
Page last updated on:


