Market Overview
| Study Period | 2020 - 2031 |
|---|---|
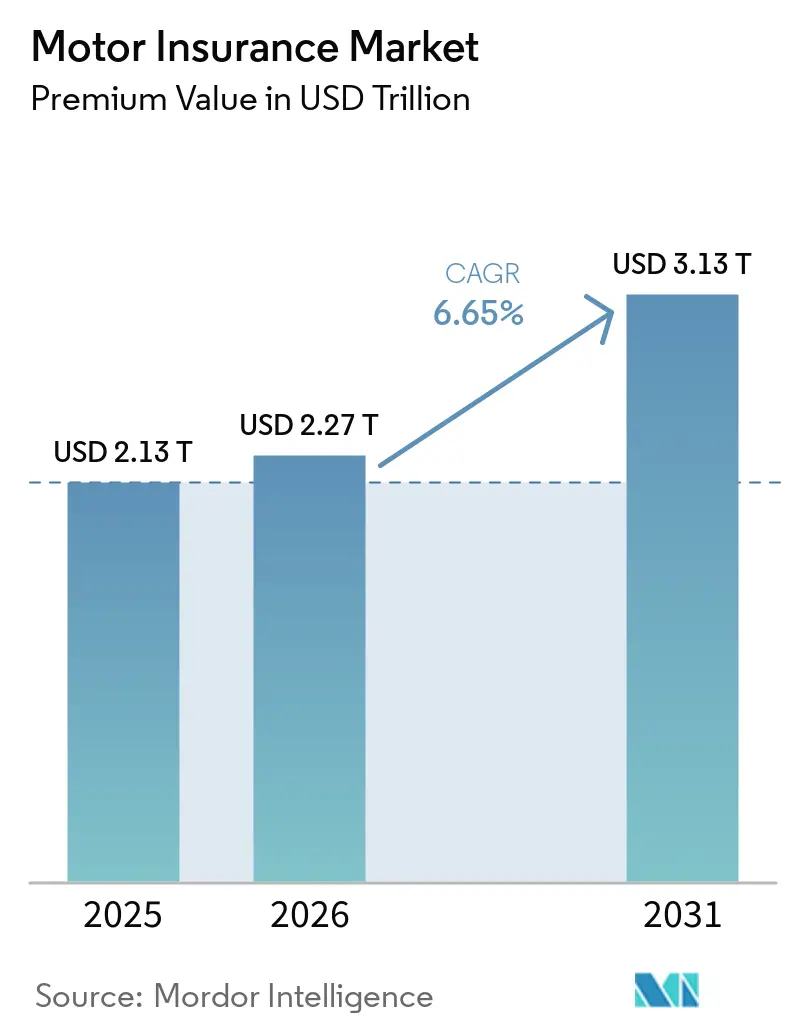
| Market Size (2026) | USD 2.27 Trillion |
| Market Size (2031) | USD 3.13 Trillion |
| Growth Rate (2026 - 2031) | 6.65% CAGR |
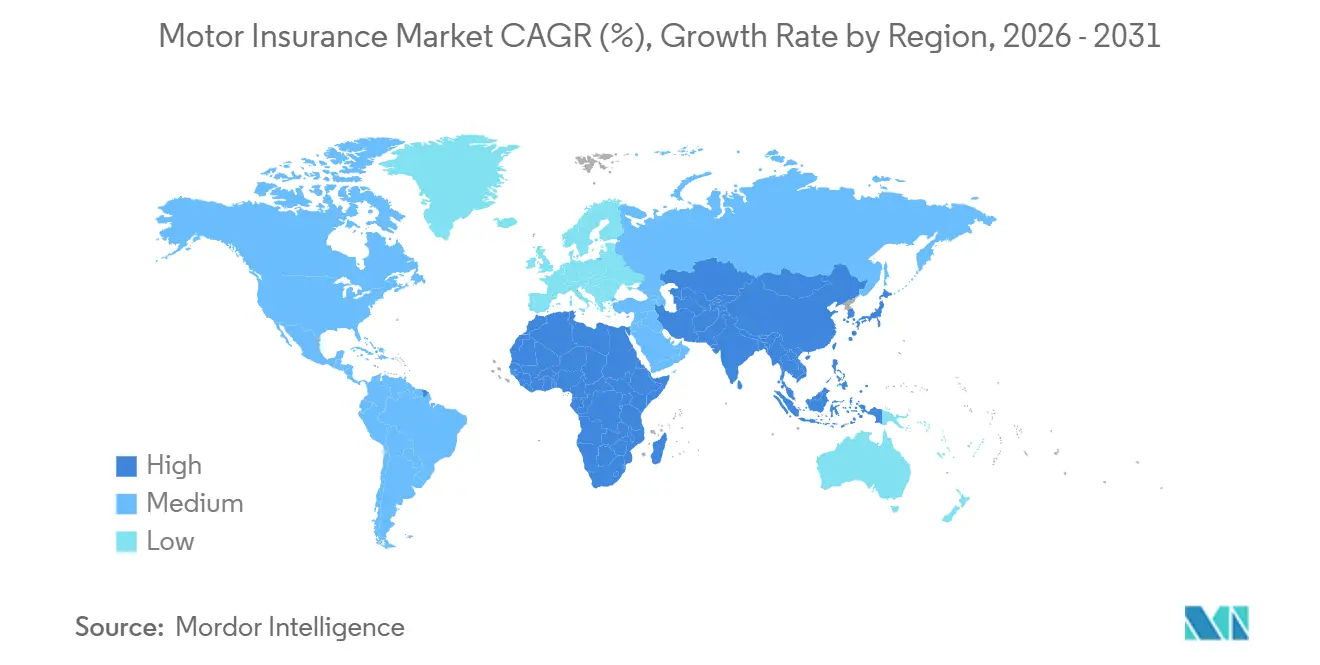
| Fastest Growing Market | Asia Pacific |
| Largest Market | North America |
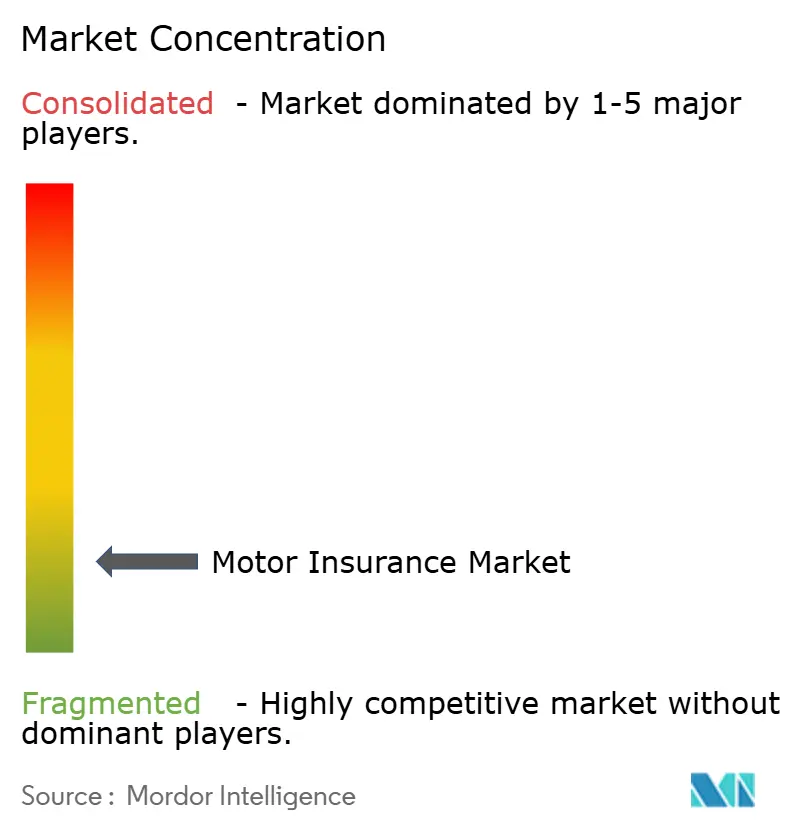
| Market Concentration | Low |
Major Players *Disclaimer: Major Players sorted in no particular order Image © Mordor Intelligence. Reuse requires attribution under CC BY 4.0. | |
Motor Insurance Market Analysis by Mordor Intelligence
The Motor Insurance Market size in terms of premium value is projected to expand from USD 2.13 trillion in 2025 and USD 2.27 trillion in 2026 to USD 3.13 trillion by 2031, registering a CAGR of 6.65% between 2026 to 2031.
Insurers are focusing on underwriting discipline after two years of elevated claims severity linked to parts inflation, ADAS recalibration, and EV repair complexity, with North American carriers improving personal-auto combined ratios in 2025 through rate adequacy and operational efficiency. Repair cost inflation and calibration intensity continue to influence pricing, while claims handling benefits from AI-enabled triage and parts sourcing that shorten cycle times in select lines. Asia-Pacific is now the fastest-growing region through 2031 due to a rising insured base and EV penetration that necessitate updated coverage constructs and battery-specific underwriting methods. Digital and embedded distribution models are scaling across OEMs, lenders, and mobility platforms, but fraud risks such as ghost broking have risen in some markets, which has prompted carrier countermeasures and platform-level safeguards.
Key Report Takeaways
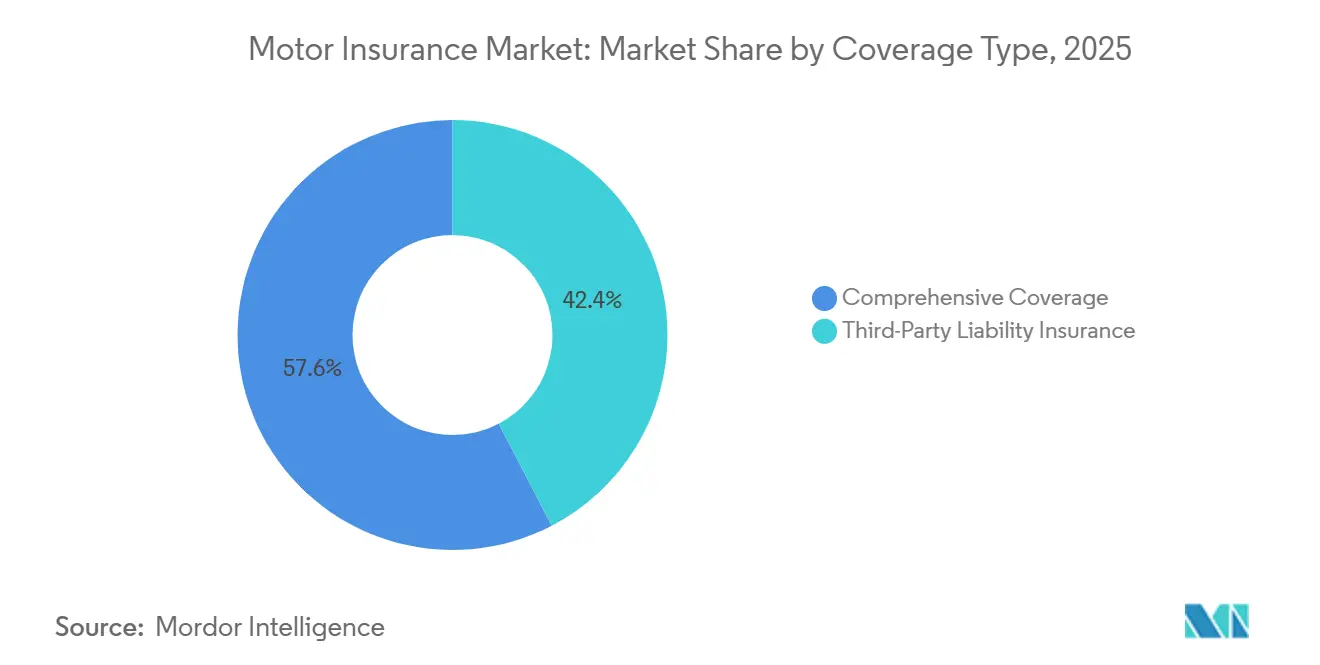
- By coverage type, third-party liability held 42.37% of the motor insurance market size in 2025, while comprehensive coverage is the fastest growing at an 8.46% CAGR to 2031.
- By distribution channel, agents and brokers accounted for 47.18% of the written premiums of the motor insurance market size in 2025, and direct and digital models are projected to grow at a 9.74% CAGR through 2031.
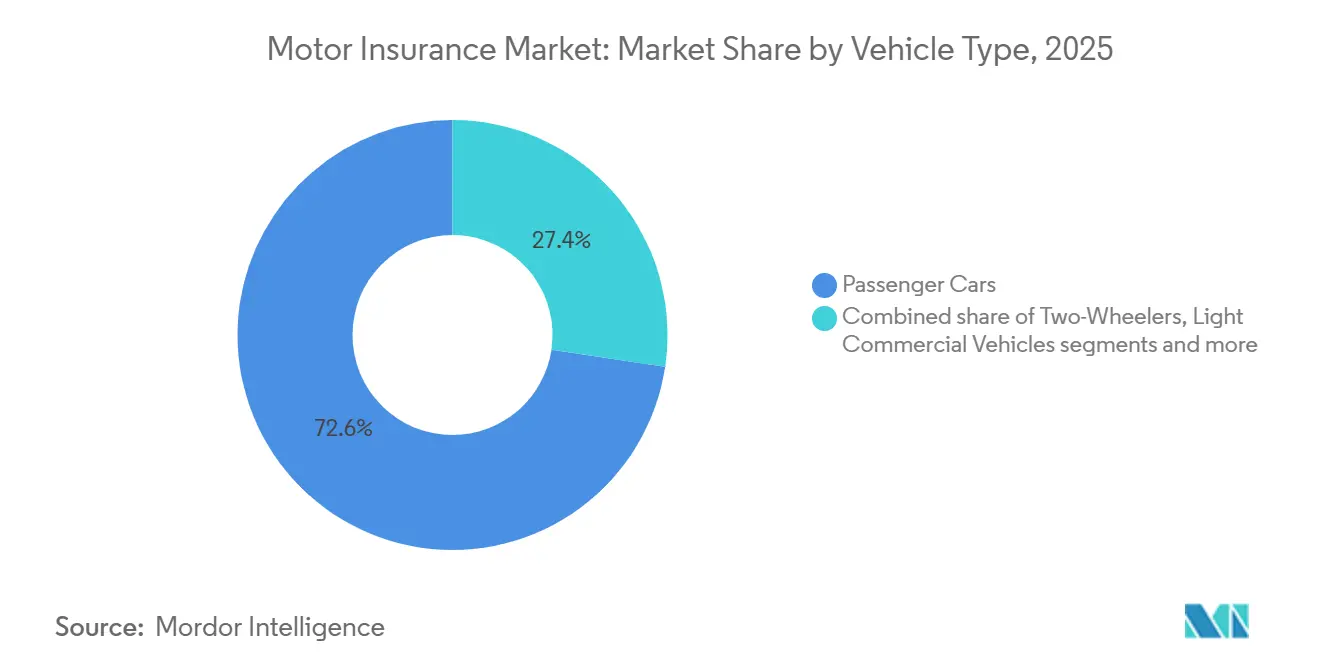
- By vehicle type, passenger cars captured 72.64% of premiums of the motor insurance market share in 2025, while light commercial vehicles are set to expand at a 7.92% CAGR over 2026-2031.
- By vehicle age, new vehicles held a 65.43% of the motor insurance market share in 2025, and used-vehicle policies are projected to grow at a 6.88% CAGR through 2031.
- By geography, North America led with 35.71% of global premiums of the motor insurance market size in 2025, while Asia-Pacific is the fastest-growing region at a 10.26% CAGR to 2031.
Note: Market size and forecast figures in this report are generated using Mordor Intelligence’s proprietary estimation framework, updated with the latest available data and insights as of 2026.
Global Motor Insurance Market Trends and Insights
Drivers Impact Analysis*
| Driver | (~) % Impact on CAGR Forecast | Geographic Relevance | Impact Timeline |
|---|---|---|---|
| Regulatory enforcement of third-party liability in emerging markets | +1.2% | Indonesia, Nigeria, GCC, South and Southeast Asia | Medium term (2-4 years) |
| Premium rate hardening following claims severity inflation | +1.8% | North America, the United Kingdom, and Australia | Short term (≤ 2 years) |
| Telematics and UBI adoption via OEM-connected car data | +1.1% | Japan, South Korea, Italy, the United States, and Canada | Medium term (2-4 years) |
| Asia-Pacific new-vehicle and EV sales are expanding the insured base | +1.5% | China, India, ASEAN, Japan, Australia | Long term (≥ 4 years) |
| Embedded distribution with OEMs, lenders, and mobility platforms | +0.9% | Global, with early gains in North America, Germany, United Kingdom | Medium term (2-4 years) |
| Digitized LCV/commercial fleets enabling dynamic underwriting | +0.7% | North America, Western Europe, and urban Asia-Pacific hubs | Short term (≤ 2 years) |
| Source: Mordor Intelligence | |||
Premium Rate Hardening Following Claims Severity Inflation
Personal-auto underwriting in the United States returned to profit in 2025 as carriers implemented disciplined rate actions that improved the combined ratio, although parts and labor inflation kept pressure on claim severities in several lines [1]Insurance Information Institute, “Resilient U.S. P/C Market Performance Sets Stage for a Complex 2026,” Insurance Information Institute, iii.org. Cost drivers include ADAS sensor density and post-repair calibration, which add substantial expense per estimate and lengthen cycle times when specialized equipment is required. Canadian carriers reported sustained consumer pressure as theft trends and higher repair costs weighed on profitability through 2024-2025, prompting filings for targeted rate revisions within provincial guardrails. The 2025 tariff environment for imported auto parts amplified component costs in select categories, which raised claim severities and reinforced the near-term case for continued pricing discipline in affected markets. Against this backdrop, the motor insurance market is balancing rate adequacy with retention risk as consumer sensitivity to price increases remains high in several mature markets.
Telematics and UBI Adoption via OEM-Connected Car Data
Telematics-based pricing is scaling from dongles and smartphone sensors to factory-fitted connected-car data, which improves loss-cost segmentation and enables more dynamic renewal pricing for the motor insurance market. Regulators in the United Kingdom placed algorithmic transparency on the 2026 agenda, and carriers using telematics to compute premiums will need to disclose how variables such as night driving or harsh braking influence outcomes, which should raise consumer understanding and trust in usage-based pricing. In North America, model risk management and bias controls are extending to telematics variables as supervisory bodies formalize AI governance standards for rating and underwriting models that rely on behavioral data. Italy’s long-running black-box incentives remain a reference model for adoption at scale, where hardware-backed driving data enables higher confidence in claims adjudication and theft recovery. As OEMs and insurers deepen data-sharing arrangements, usage-based insurance expands from early adopters to broader segments that value lower premiums, personalized pricing, and in-app coaching benefits.
Embedded Distribution with OEMs, Lenders, and Mobility Platforms
Embedded distribution is gaining traction as insurers integrate policy issuance into point-of-sale processes for vehicles, bank loans, and mobility apps, which reduces distribution friction for the motor insurance market. Automotive captives and dealership finance desks are bundling motor cover alongside financing, and uptake is rising where the purchase journey offers instant quotes and same-session binding supported by identity verification and digital signatures. In Latin America, leading carriers use bank partnerships to embed covers within auto loans, with high conversion where underwriting approval is synchronized with credit decisioning at origination. Embedded flows are also expanding through mobility platforms that activate liability coverage when a driver is in-app, which addresses common coverage gaps among part-time drivers and supports safer operations at scale. Over the medium term, embedded partnerships are likely to capture incremental share from conventional channels such as OEM APIs, lender integrations, and telematics data enable quote-to-bind cycles measured in minutes.
Digitized LCV/Commercial Fleets Enabling Dynamic Underwriting
Connected-fleet adoption in light commercial vehicles is advancing, which allows underwriters to correlate real-time utilization and driver behavior with risk and to calibrate renewal terms more precisely for the motor insurance market. United States commercial auto combined ratios remained above breakeven in 2025, yet fleets that invest in telematics, dashcams, and driver coaching secure better renewal terms than those without structured risk programs. Insurers are increasingly tying premium credits to adherence with device programs and safe driving thresholds, while applying surcharges where data reveals persistent high-risk behavior. Pricing models now account for delivery density and stop frequency, which influence minor collision exposure and repair-cycle volatility for last-mile fleets. As fleet telematics ecosystems mature, the shift from static to dynamic underwriting supports a higher share of usage-based pricing and more continuous risk interventions throughout the policy term.
Restraints Impact Analysis*
| Restraint | (~) % Impact on CAGR Forecast | Geographic Relevance | Impact Timeline |
|---|---|---|---|
| ADAS/EV repair complexity is driving severity and total loss rates | -1.4% | Global, concentrated in North America, Western Europe, and China | Short term (≤ 2 years) |
| Fraud and leakage (staged accidents, ghost broking) | -0.8% | United Kingdom, Mexico, India, Nigeria, with spillover across emerging markets | Medium term (2-4 years) |
| Data privacy and consent limits curbing telematics scale | -0.6% | United States, European Union (GDPR jurisdictions), Canada | Long term (≥ 4 years) |
| OEM direct insurance and dealer F&I consolidation are squeezing intermediaries | -0.5% | United States, Germany, China, Japan | Medium term (2-4 years) |
| Source: Mordor Intelligence | |||
ADAS/EV Repair Complexity Driving Severity and Total Loss Rates
EVs tend to drive higher repair complexity due to battery systems, high-voltage safety protocols, and limited aftermarket parts, which raises severity and elevates total-loss decisions when battery integrity is in question. ADAS-equipped vehicles concentrate sensors and cameras in damage-prone zones that require post-repair calibration, and this adds material cost per claim, along with specialized equipment that extends cycle times in constrained service networks. In 2026, coverage discussions frequently include hire-car durations and higher loss-of-use exposure as limited technician capacity and parts availability increase time to repair, especially for EVs [2]WeCovr, “The Real Cost of Running an Electric Car 2026,” WeCovr, wecovr.com. Across major markets, carriers continue to refine EV endorsements and ADAS-related repair protocols to improve loss predictability, but the short-term pressure on severity remains visible in personal-auto lines. The resulting cost dynamics temper near-term growth in the motor insurance market until parts ecosystems and certified technician capacity scale further.
Fraud and Leakage (Staged Accidents, Ghost Broking)
Ghost broking and staged-collision schemes have become more sophisticated, with social media and messaging apps enabling large-scale victim targeting among younger drivers who face high premiums, which raises non-cat claims costs and leakage [3]Aviva plc, “Ghost Broking Surges 22% in Two Years,” Aviva, aviva.com. United Kingdom victims report policy cancellations, invalid details, and identity theft after contact with unregulated sellers, and industry campaigns continue to raise awareness and push for platform-level ad controls. United States carriers and authorities report rising fraud losses across auto and homeowners, highlighting the need for better detection and verification at FNOL and during claim settlement. Industry associations in the United Kingdom emphasize enhanced KYC and identity proofing to limit false policies and credit-hire abuses, and they advocate stronger data sharing among carriers to reduce cross-market leakage. As carriers scale AI-driven fraud analytics and photo forensics, detection rates improve, yet adversarial methods continue to evolve in step, keeping fraud as a persistent headwind for the motor insurance market.
*Our forecasts treat driver/restraint impacts as directional, not additive. The impact forecasts reflect baseline growth, mix effects, and variable interactions.
Segment Analysis
By Coverage Type: Comprehensive Gains Share as Vehicle Values Surge
Third-party liability policies maintained scale in 2025 with a 42.37% share of global premiums, while comprehensive coverage is set to grow at an 8.46% CAGR through 2031 as insured values and catastrophe exposures justify broader protection. Median new-vehicle prices in Canada reached USD 47,633.3 (CAD 65,219.0) by December 2024, a level that reinforces demand for full replacement coverage where lenders and owners seek to mitigate rising total-loss risk from severe weather and theft trends. The motor insurance market is seeing stronger consumer preference for comprehensive add-ons that bundle collision, flood, and theft protections, which helps offset inflationary pressure on physical-damage claims. In several markets, reinsurance rate actions following recent catastrophes have passed through to primary pricing, which supports revenue growth but requires careful retention management to avoid outflow to liability-only products. As OEM supply chains normalize and dealer inventories stabilize, replacement timelines continue to shape customer choices on deductibles and rental coverage limits, pushing comprehensive uptake higher in high-severity corridors.
Comprehensive cover also benefits from telematics-backed discounts in countries that promote black-box adoption, where validated safe driving supports larger premium credits without undermining coverage breadth. In markets where ADAS and EV penetration are rising, calibration and battery safeguards are embedded into comprehensive endorsements to address cost uncertainty and safety protocols, which improves customer confidence at policy inception. Underwriting standards now give greater weight to vehicle repairability and parts availability, a practice that influences whether a claim trends to repair or total loss as shop capacity and certified technicians remain tight in 2026. Several carriers are piloting parametric riders that pay pre-set amounts for extreme rainfall or flood conditions, which shortens settlement timelines when events are objectively triggered and reduces frictional costs that strain claims handling capacity. Across these developments, comprehensive coverage is positioned to outgrow liability in the motor insurance market as consumers pair higher vehicle values with broader perils protection under transparent, digitally issued products.


By Distribution Channel: Direct/Digital Surges as Aggregators and Embedded Models Proliferate
Agents and brokers accounted for 47.18% of written premiums in 2025 as advisory-led placement retained importance in complex and commercial-line accounts in the motor insurance market. Direct and digital policies are projected to grow at a 9.74% CAGR through 2031 on the strength of self-service portals, faster underwriting decisions, and mobile-first quote-to-bind flows that deliver instant confirmations. Price-comparison tools continue to reset consumer expectations around transparency and speed, which pushes traditional channels to integrate digital quoting, eKYC, and electronic document delivery to remain competitive. Regulatory priorities in 2026 emphasize transparency in algorithmic rating and disclosures within online journeys, especially where telematics variables influence premium adjustments. As a result, omnichannel is now the norm for many customers who research online, compare options, and then complete purchases through an agent or a captive advisor when coverage complexity is high.
Embedded distribution with OEMs and lenders is its own growth vector within direct, as APIs bridge financing and underwriting so that quotes and binding occur inside a single transaction for the motor insurance market. Industry payment specialists report growing adoption of digital collections and refunds that streamline endorsements and claims reimbursements, which reduces friction and boosts customer satisfaction measures. In the United States, regulators require online systems to disclose rating variables and provide clear adverse-action communications, standards that shape how automated decisioning is explained on direct platforms. Agents are also arming themselves with comparative quoting and coverage-explanation tools to differentiate on advice where price-only decisions dominate aggregator journeys. The channel mix is therefore evolving as advisory-led placements coexist with digital-direct and embedded options that promise speed without sacrificing disclosure obligations set by supervisors.
By Vehicle Type: Passenger Cars Anchor Volume While LCV/Commercial Auto Surges on E-Commerce Demand
Passenger cars accounted for 72.64% of global premiums in 2025, underscoring the segment’s scale in the motor insurance market and highlighting the dominance of car insurance, while light commercial vehicles are projected to grow at a 7.92% CAGR from 2026 to 2031 as e-commerce and last-mile delivery expand insured fleets. Commercial auto underwriting remains sensitive to litigation exposure and driver shortage dynamics, but connected-fleet adoption and driver coaching have improved loss performance for fleets that invest in risk programs. As EV vans and hybrids enter delivery networks, carriers are updating coverage terms to reflect battery valuation, thermal risk management, and charging liability, while capturing maintenance-cost advantages that can offset severity in collision-only scenarios. Telematics data sets now inform route density pricing, stop-and-go frequency, and night-time operations that materially influence fender-bender exposure and labor downtime. These tools improve the pricing and renewal process as motor carriers, delivery services, and specialty fleets move toward more continuous risk monitoring and midterm adjustments where behavior deteriorates.
For passenger cars, higher ADAS fitment is changing claim profiles by reducing some collision frequencies while increasing repair costs when sensors and cameras are damaged, which brings a mixed effect on severity trends. In mature markets, usage-based discounts contribute to retention in low-mileage segments and among safe drivers, which supports multi-year customer value despite market-wide price competition. Commercial fleets benefit from premium credits tied to telematics compliance and real-time coaching, and underwriters may apply surcharges or midterm changes when high-risk behaviors persist. As the mix shifts toward LCV growth, carriers are codifying segment-specific loss drivers such as urban density, delivery time windows, and parking damage to maintain profitability in the motor insurance market. The net effect is steady strength in passenger cars and faster expansion in LCVs as data-driven underwriting and safety investments differentiate fleet outcomes over the forecast period.
By Vehicle Age: New Vehicles Dominate Premium Share, Yet Used-Vehicle Growth Outpaces as Affordability Shifts Demand
New vehicles generated 65.43% of global premiums in 2025, reflecting lender requirements for full coverage and higher insured values that lift written premiums in the motor insurance market. Used-vehicle policies are projected to grow at a 6.88% CAGR to 2031, supported by affordability shifts that push buyers into secondary markets where coverage packaging and repair economics differ from new-car portfolios. Canadian data show continued consumer strain as vehicle prices and repair costs remained elevated through 2024-2025, which affects choices on coverage levels and deductibles for used cars. Insurers are emphasizing vehicle-history verification to identify prior flood or salvage titles during underwriting, and carriers may price accordingly or decline risks that present elevated fraud or severity concerns. Loss treatment also diverges by age as parts availability, ADAS complexity, and diminished actual cash value can push older cars toward total-loss settlements when repair economics are unfavorable.
Used EV dynamics add complexity due to faster depreciation and battery health uncertainty, which has encouraged some carriers to explore agreed-value endorsements to improve payout clarity in mid-age EVs. Consumers who move from financed new vehicles to older cars often reset to liability-only coverage once loan conditions expire, which moderates premium expansion unless telematics discounts and loyalty benefits preserve uptake for collision and comprehensive. Digital claims and parts procurement tools are helping carriers manage cycle times for older vehicles, though technician capacity and calibration equipment remain bottlenecks where ADAS features are involved. In markets with high theft exposure, used cars with popular trims and keyless systems carry surcharges that reflect elevated replacement risk, a trend that influences cover choices at renewal. These age-based differences will continue to shape coverage mix and pricing in the motor insurance market through 2031 as lenders, buyers, and carriers update preferences in line with repair and resale economics.
Geography Analysis
North America accounted for 35.71% of global premiums in 2025, reflecting the region’s large personal-auto base and improved underwriting results in the United States personal lines during 2025 as rates reached technical adequacy in many states. Combined ratios tightened materially in 2025, though carriers remain vigilant due to potential volatility in parts costs and legal trends that influence severity and loss adjustment expenses. Canada continues to manage theft and repair pressures that drove insurer responses in 2024-2025, including targeted underwriting actions and policyholder guidance on anti-theft measures. Mexico’s leader Qualitas has used scale and telematics-led programs to consolidate its position across domestic and nearshore corridors, which supports share and product depth in a key Latin market that interfaces with the United States trade and logistics. As digital issuance and embedded distribution expand, North American carriers balance rate strategies with retention as customer price sensitivity remains heightened in 2026.
Asia-Pacific is the fastest-growing region with a projected 10.26% CAGR to 2031, supported by rising vehicle ownership and policy digitization across India, China, and Southeast Asia, which enlarges the insurable base for the motor insurance market. India’s premiums are forecast to outpace most major markets as digital KYC and e-mandates reduce onboarding friction and expand compliance, with momentum visible in two-wheeler segments. Japan’s regulatory approval for risk-based pricing that recognizes ADAS efficacy supports better alignment between safety features and premium benefits, which helps lift uptake of differentiated motor covers. As EV adoption accelerates, carriers are updating cover constructs for battery, charging infrastructure, and residual value, and they are investing in AI to optimize parts procurement and reduce repair-cycle bottlenecks. Telematics and embedded programs continue to broaden addressable segments in Asia-Pacific as OEMs, lenders, and mobility platforms integrate insurance into their customer journeys for the motor insurance market.
Europe delivered stable premium volume in 2025 but faces mixed profitability across markets as claims inflation, ADAS recalibration, and EV repair complexity challenge pricing flexibility, while regulators emphasize transparency on algorithmic ratings and customer outcomes. Italy remains a growth bright spot with telematics penetration among the highest globally and steady gains projected through 2031 as black-box incentives and digital-first carriers expand reach in the motor insurance market. The Middle East and Africa show growing enforcement, digitization, and sandbox-driven innovation, and regional reforms are expected to improve penetration rates and raise domestic capacity over the forecast period. In Latin America, distribution through banks and OEM partners continues to expand, and leading carriers use telematics and embedded offers to reach gig drivers and cross-border fleets in priority corridors. Across these regions, the interplay of pricing policy, technology adoption, and regulatory oversight sets up varied growth paths while the motor insurance market converges on digital-first issuance and data-enabled underwriting.

Competitive Landscape
The motor insurance market features a moderate level of fragmentation where multinational carriers and regional champions pursue different playbooks around telematics scale, embedded distribution, and AI-driven claims, and leading Latin players such as Qualitas continue to consolidate share through data-led pricing and cross-border expansion. Strategic combinations support digital scale and unit-cost advantages, with notable transactions in 2025 that improved the position in personal lines and enabled renewed growth in segments where distribution is shifting online. Carriers are deepening partnerships with OEMs, banks, and mobility platforms to defend renewal books and tap embedded purchase moments that compress customer acquisition costs over time. Regulatory attention on AI, big data, and algorithmic transparency is extending across regions, which pushes investment in explainable models and robust governance over telematics-driven pricing. Within this context, scale players focus on operating leverage and brand, while specialists target niches such as young drivers and small fleets through behavior-based pricing and value-added services that improve retention.
Select 2025 moves point to renewed focus on telematics and digital distribution, with Italy a focal market where black-box adoption creates defensive moats and supports growth plans for incumbents and digital-first brands. Industry cost actions extend beyond pricing to fraud analytics and supply-chain optimization, where data platforms help detect staged losses and reduce leakage at FNOL and settlement. Payment’s modernization and digital refunds have raised customer satisfaction and lowered operational friction, which ties directly to claim and endorsement experiences that drive NPS and lifetime value. North American carriers improved underwriting results in 2025, though they remain attentive to legal trends that influence severity and litigation costs in commercial segments. Embedded and direct channels continue to recast acquisition economics in the motor insurance market, and incumbents are aligning capital toward these flows to secure future renewal pools.
Across technology adoption, leading carriers are deploying AI for subrogation, fraud detection, and triage while investing in explainability and model risk controls under evolving supervisory expectations. Repair network partnerships and calibration hubs for ADAS are being scaled to stabilize cycle times, control parts costs, and improve customer outcomes in EV-heavy portfolios. Regional leaders are using behavioral discounts and safe driving rewards to reinforce telematics engagement, which lowers claim frequency and strengthens policy longevity for the motor insurance market. The competitive set continues to adjust to OEM direct insurance where data advantages can be material, and traditional carriers emphasize transparency, omnichannel advice, and product breadth as counterweights. The combined result is healthy competition that tilts toward players able to integrate data, distribution, and claims at scale without eroding underwriting standards.
Motor Insurance Industry Leaders
PICC Property & Casualty (PICC P&C)
State Farm Mutual Automobile Insurance Company
Progressive Corporation
GEICO (Berkshire Hathaway)
Allstate Corporation
- *Disclaimer: Major Players sorted in no particular order

Recent Industry Developments
- April 2026: Allianz UK and LV= have entered into a renewed multi-year insurance agreement, ensuring the continued provision of home, motor, and pet insurance under the LV= brand. This renewal extends a brand licensing arrangement that was originally set to conclude this year.
- January 2026: Progressive Corp is redefining the auto insurance market by leveraging telematics, AI-driven claims processing, and advanced digital platforms, delivering real-time, data-centric solutions that align with modern fintech standards.
- October 2025: Allianz UK announced a five-year strategic partnership with motor MGA Ticker, set to begin on November 1, 2025, to support underwriting and claims for Ticker’s telematics-based motor insurance products, leveraging Allianz’s capacity and Ticker’s data-driven pricing to enhance scalability and improve risk assessment capabilities.
- October 2025: Starr, a global investment and insurance organization, announced the signing of a definitive agreement to acquire IQUW Group. This acquisition had expanded Starr’s underwriting capabilities and positioned the combined entity for growth across a wider range of global market segments.


Research Methodology Framework and Report Scope
Market Definitions and Key Coverage
Our study defines the global motor insurance market as the total gross written premiums collected worldwide for policies that protect private and commercial road-going vehicles, passenger cars, light vans, two-wheelers and heavy trucks, against own damage and third-party liability losses. We cover policies sold directly by carriers, through agent/broker networks and emerging digital platforms, aggregating personal as well as fleet business.
Scope Exclusion: The estimate omits marine, aviation, crop or life covers and strips out reinsurance treaties placed above primary carriers.
Segmentation Overview
- By Coverage Type
- Third-Party Liability Insurance
- Comprehensive Coverage
- By Distribution Channel
- Insurance Agents / Brokers
- Direct Sales
- Bancassurance
- Embedded / Platform Partnerships
- Aggregators & Comparison Portals
- By Vehicle Type
- Passenger Cars
- Two-Wheelers
- Light Commercial Vehicles
- Medium & Heavy Commercial Vehicles
- By Vehicle Age
- New Vehicles
- Used Vehicles
- By Geography
- North America
- Canada
- United States
- Mexico
- South America
- Brazil
- Peru
- Chile
- Argentina
- Rest of South America
- Europe
- United Kingdom
- Germany
- France
- Spain
- Italy
- BENELUX (Belgium, Netherlands, and Luxembourg)
- NORDICS (Denmark, Finland, Iceland, Norway, and Sweden)
- Rest of Europe
- Asia-Pacific
- India
- China
- Japan
- Australia
- South Korea
- South East Asia (Singapore, Malaysia, Thailand, Indonesia, Vietnam, and Philippines)
- Rest of Asia-Pacific
- Middle East And Africa
- United Arab Emirates
- Saudi Arabia
- South Africa
- Nigeria
- Rest of Middle East And Africa
- North America
Detailed Research Methodology and Data Validation
Primary Research
Structured interviews with underwriting heads, broker groups, fleet managers and insurtech executives across North America, Europe, Asia-Pacific, Latin America and the Middle East let us test loss-ratio movements, price elasticity and telematics adoption, sharpening assumptions wherever public data proved thin.
Desk Research
We began by mapping regulator filings and statistical yearbooks from NAIC (United States), EIOPA (Europe) and IRDAI (India), then tied these to vehicle park and accident records issued by OICA, UN Road Safety and the Insurance Information Institute. Macro indicators, GDP per capita, fuel prices and new registration trends, were pulled from World Bank and OECD sets to normalize premiums across seventy nations. Our analysts also reviewed carrier 10-K filings and tapped D&B Hoovers and Dow Jones Factiva transcripts for commentary on rate hikes and claims inflation. A second sweep consulted customs codes on replacement parts, Questel patent feeds on telematics and national police crash datasets, adding guardrails around repair cost and usage-based pricing assumptions. This illustrative list is not exhaustive; many additional open and paid sources informed our desk phase.
Market-Sizing & Forecasting
Our model starts with a top-down reconstruction. Insured vehicle penetration is multiplied by average premium per policy for each country, then adjusted for exchange rates and inflation. Select bottom-up cross-checks, carrier premium roll-ups, channel checks and sampled average selling price by vehicle age, tighten totals before sign-off. Key variables feeding a multivariate regression blended with ARIMA smoothing include registered vehicle stock, mandated liability limits, claims cost inflation, accident frequency, new car sales and telematics policy uptake. Scenario testing gauges the impact of faster electric vehicle penetration or regulatory rate caps, and any local data voids are bridged with nearest peer ratios validated during expert calls.
Data Validation & Update Cycle
Outputs pass automated variance scans, senior analyst peer review and a follow-up expert call when anomalies persist. Reports refresh every twelve months, with interim updates triggered by major legislative or catastrophe events so clients receive the latest view.
Why Mordor's Global Motor Insurance Baseline Commands Reliability
Published estimates often diverge because research firms choose different policy scopes, premium bases and refresh cadences.
Mordor reports gross written premiums and refreshes mid-year, while some providers cite earned premiums or fold in reinsurance flows, inflating totals. Others assume rapid telematics uptake or hold currency rates static, skewing growth math.
Benchmark comparison
| Market Size | Anonymized source | Primary gap driver |
|---|---|---|
| USD 810.25 M | Mordor Intelligence | - |
| USD 877.75 M | Global Consultancy A | Includes reinsurance flows and ancillary assistance services |
| USD 911.64 M | Industry Research Firm B | Applies aggressive telematics penetration and fixed currency rates |
These contrasts show why decision-makers trust Mordor's disciplined scope selection, blended top-down and bottom-up validation and timely refresh to provide a transparent, repeatable baseline for strategic planning.


Key Questions Answered in the Report
What is the motor insurance market size today, and by 2031?
The motor insurance market size is USD 2.13 trillion in 2025 and is projected to reach USD 3.13 trillion by 2031 at a 6.65% CAGR over 2026-2031.
Which region will grow the fastest in motor cover through 2031?
Asia-Pacific is the fastest region with a projected 10.26% CAGR to 2031, supported by rising vehicle ownership, digital issuance, and EV adoption that expands the insured base.
Which channels are gaining share in personal auto distribution?
Direct and digital channels are projected to grow at a 9.74% CAGR to 2031, while embedded partnerships with OEMs and lenders accelerate quote-to-bind flows at the point of sale.
How will telematics and OEM-connected data affect pricing?
Telematics and OEM data improve segmentation and support usage-based pricing, and regulators are adding transparency rules for algorithmic pricing that use driving variables.
What are the top cost pressures facing carriers in 2026?
ADAS calibration, EV battery protocols, and parts inflation elevate repair severity and cycle times, which keeps near-term pressure on combined ratios despite pricing discipline.
Which vehicle segments show the strongest outlook to 2031?
Passenger cars anchor premium volume, while light commercial vehicles are the fastest growing due to e-commerce logistics and connected-fleet adoption that support dynamic underwriting.
Page last updated on:


