Market Overview
| Study Period | 2020 - 2031 |
|---|---|
| Forecast Data Period | 2026 - 2031 |
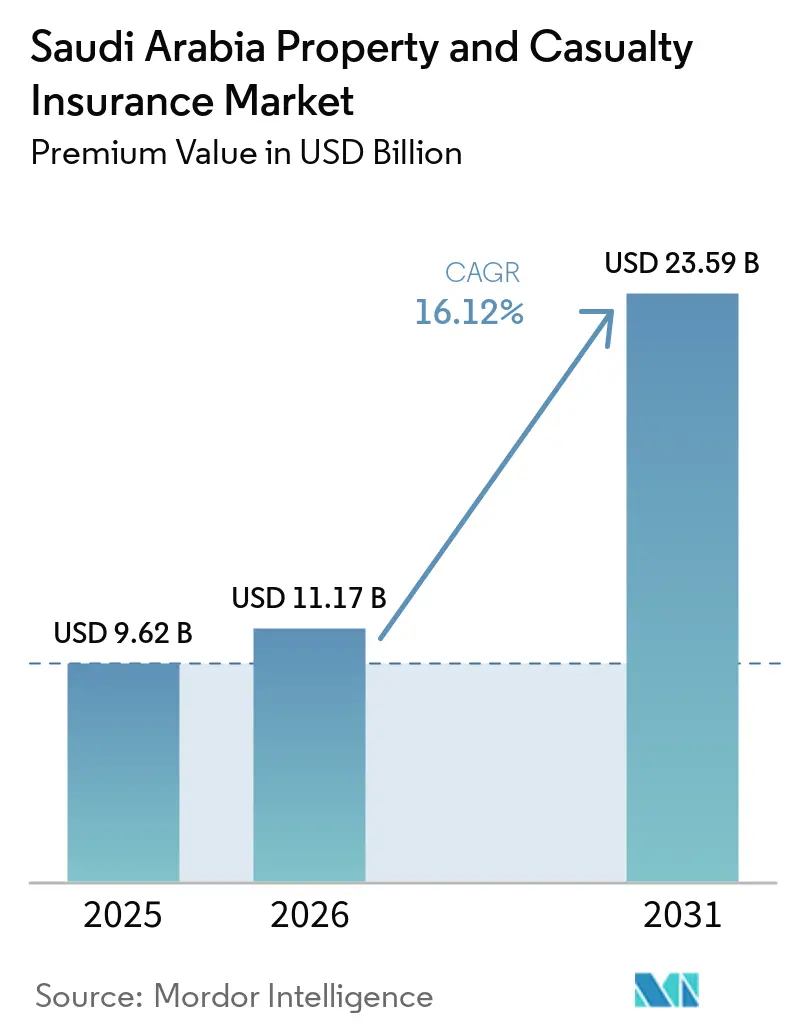
| Base Year Market Size (2025) | USD 9.62 Billion |
| Market Size (2026) | USD 11.17 Billion |
| Market Size (2031) | USD 23.59 Billion |
| Growth Rate (2026 - 2031) | 16.12% CAGR |
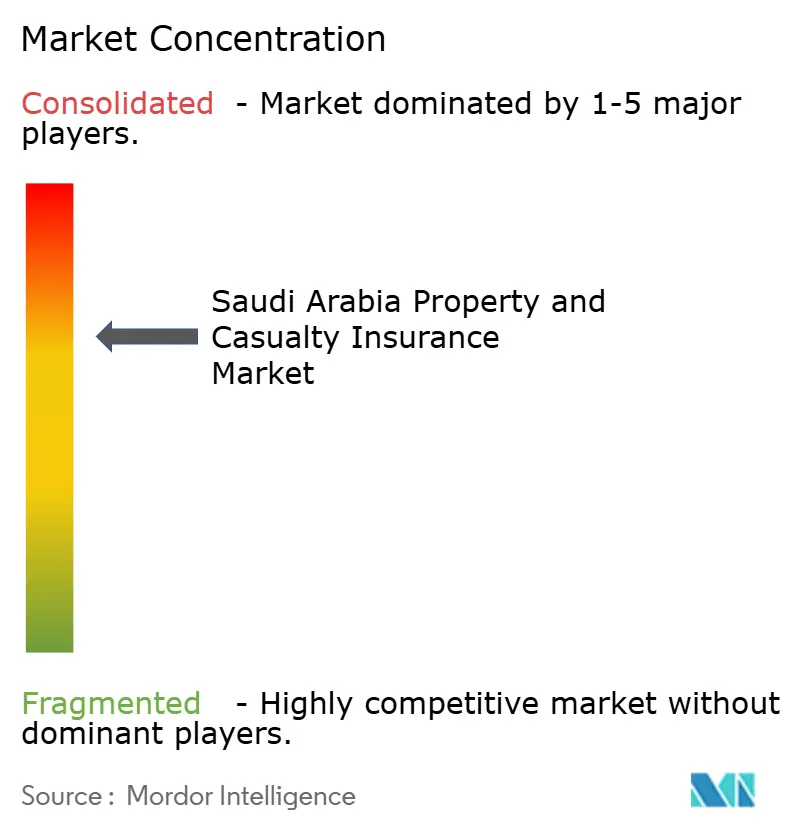
| Market Concentration | Medium |
Major Players *Disclaimer: Major Players sorted in no particular order Image © Mordor Intelligence. Reuse requires attribution under CC BY 4.0. | |
Saudi Arabia Property and Casualty Insurance Market Analysis by Mordor Intelligence
The Saudi Arabia Property And Casualty Insurance Market size in terms of premium value is projected to expand from USD 9.62 billion in 2025 and USD 11.17 billion in 2026 to USD 23.59 billion by 2031, registering a CAGR of 16.12% between 2026 to 2031.
This performance springs from Vision 2030 reforms that stimulate credit growth, raise infrastructure spending, and enlarge the national risk pool. Penetration remains low at 1.5%, underscoring a sizeable protection gap that incumbent carriers and new entrants can still address. A mandatory 30% local reinsurance cession rule enacted in November 2024 redirects premium flows to domestic reinsurers, improving onshore capacity and underwriting appetite. Engineering lines enjoy tailwinds from more than USD 850 billion in giga-projects, whereas motor retains volume leadership because the enforcement of compulsory cover is tightening. Distribution is shifting online, yet bancassurance is scaling at a double-digit pace as banks cross-sell policies through their branch and mobile networks. Regionally, Western Saudi Arabia continues to account for more than one-third of premiums, while the Eastern industrial belt is expanding fastest on the back of petrochemical diversification.
Key Report Takeaways
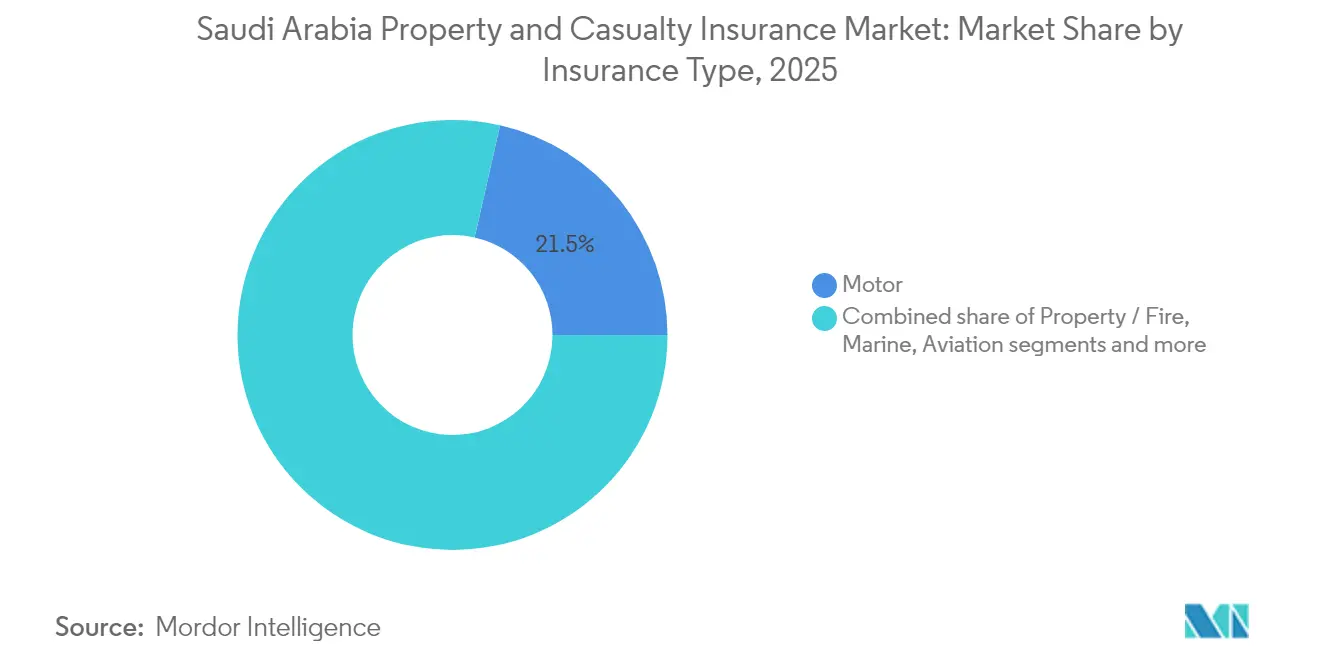
- By insurance type, motor held 21.45% of the Saudi Arabia property and casualty insurance market share in 2025; engineering lines are forecast to rise at an 11.07% CAGR through 2031.
- By distribution channel, direct sales captured 26.55% revenue share in 2025, whereas bancassurance is projected to grow at a 14.05% CAGR to 2031.
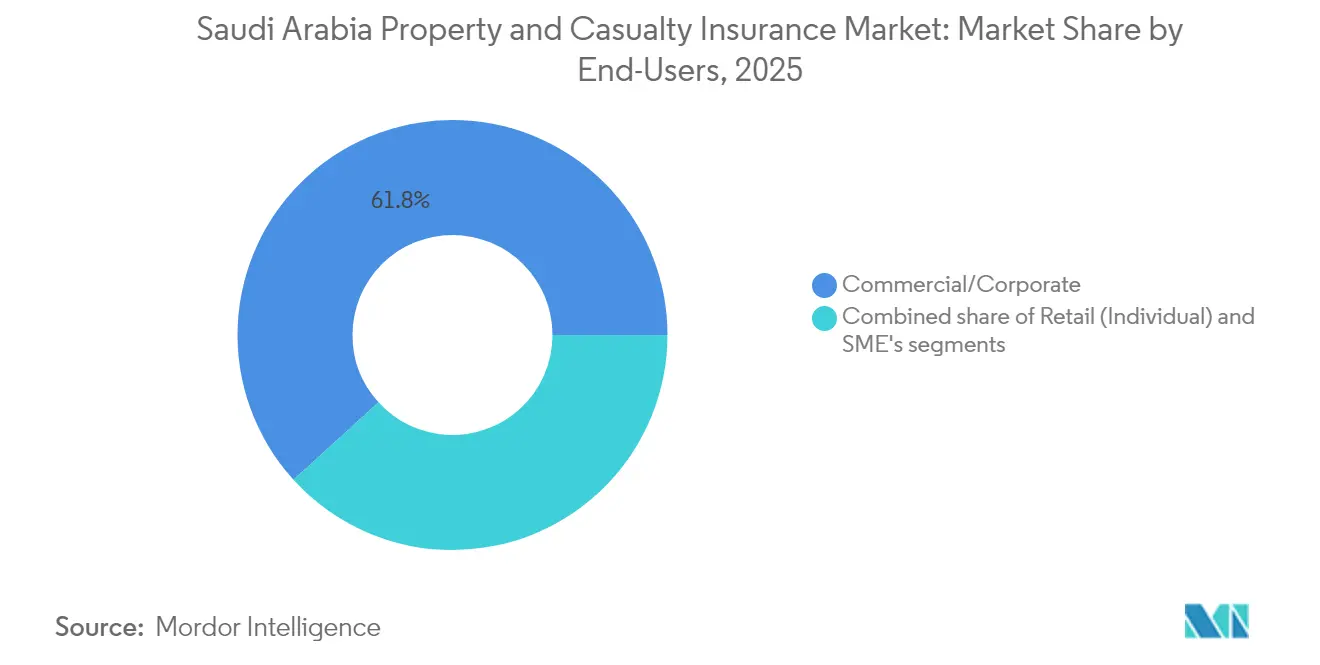
- By end-user, commercial and corporate customers represented 61.75% of demand in 2025, while the individual segment is advancing at an 11.35% CAGR through 2031.
- By region, the Western area commanded 35.10% of the Saudi Arabian property and casualty insurance market size in 2025; the Eastern region is climbing at a 9.45% CAGR over the same horizon.
- The five largest carriers controlled 67.75% of gross written premiums in 2024, highlighting a concentrated competitive structure.
Note: Market size and forecast figures in this report are generated using Mordor Intelligence’s proprietary estimation framework, updated with the latest available data and insights as of 2026.
Saudi Arabia Property and Casualty Insurance Market Trends and Insights
Drivers Impact Analysis*
| Driver | (~) % Impact on CAGR Forecast | Geographic Relevance | Impact Timeline |
|---|---|---|---|
| Strict enforcement of compulsory motor insurance | +2.8% | National, stronger in cities | Short term (≤ 2 years) |
| Mega-projects (NEOM, Red Sea) raising engineering and energy covers | +3.2% | Western and Northern regions | Medium term (2–4 years) |
| Mandatory 30% local re-insurance cession | +1.9% | Nationwide | Short term (≤ 2 years) |
| IFRS-17 capital discipline | +1.5% | National, large insurers | Medium term (2–4 years) |
| InsurTech-enabled usage-based motor products | +2.1% | Cities first then national | Medium term (2–4 years) |
| Source: Mordor Intelligence | |||
Strict Enforcement of Compulsory Motor Insurance
New digital links between SAMA, the traffic authority, and vehicle registries verify policies in real-time, exposing uninsured vehicles to automatic fines and registration suspension[1]Saudi Central Bank, “Financial Stability Report 2024,” sama.gov.sa. Car ownership is climbing as road-building programs progress, so each additional registration feeds premium growth and widens the risk pool. Higher volumes spread fixed expenses, helping carriers absorb spare parts inflation and maintain margin stability. Compliance also shrinks the uninsured-driver pool, lowering cross-subsidy and reducing adverse selection for comprehensive covers. Better data on infractions lets actuaries refine rating factors, nudging prices toward risk-adequate levels. Together, these effects lift near-term premium income and underpin long-term profitability.
Mega-Projects Driving Engineering and Energy Coverage
Schemes such as NEOM (USD 500 billion) and the Red Sea Project (USD 200 billion) demand construction-all-risk, DSU, and renewable-energy guarantees that exceed historic local limits[2]Global Arbitration Review, “Giga-Projects Fuel Engineering Cover Demand,” globalarbitrationreview.com. Domestic insurers, therefore, front policies and cede portions to global reinsurers, gaining technical know-how while retaining at least 30% by regulation. Premiums are priced higher because modular buildings, autonomous equipment, and offshore hydrogen plants introduce untested hazards that elevate their severity potential. Long construction timelines translate into multi-year premium streams and predictable cash flows, an attractive hedge against short-tail motor volatility. Up-front risk engineering fees provide additional revenue and deepen client relationships. These projects also spur ancillary liability and marine cargo covers, multiplying the growth effect across several lines.
Mandatory 30% Local Re-Insurance Cession Raising Domestic Retention
The rule grants Saudi reinsurers first refusal on treaty and facultative placements, redirecting a significant share of outward premiums back onshore[3]Reinsurance News, “Saudi Arabia’s 30% Cession Rule Boosts Local Retention,” reinsurancene.ws. Primary carriers gain bargaining power because dependence on the hardening global market diminishes, stabilizing retrocession costs during renewals. Higher retention improves local reinsurers’ earnings and accelerates actuarial skill development, especially in energy and engineering classes. With larger balance sheets, they can accept bigger line sizes, allowing domestic insurers to write risks that previously required foreign capacity. The provision is expected to trigger strategic alliances and possible M&A as smaller insurers seek cost-efficient re-insurance structures. Over time, deeper local capacity should narrow the protection gap and support sovereign financial stability goals.
IFRS-17 Capital Discipline Boosting Pricing Sophistication
Since January 2023, revenue has been recognized over the coverage period instead of day one, making aggressive discounting immediately visible in the Contractual Service Margin. Explicit risk adjustments encourage prudent reserving and dampen earnings volatility, reassuring investors and regulators. Enhanced note disclosures offer granular insight into contract profitability, letting management target underperforming books for repricing or exit. Actuaries now model fulfillment cash flows at finer cohorts, supporting differentiated tariffs by segment and geography. The standard also clarifies re-insurance asset valuation, showing true protection cost and raising board-level awareness of ceded-risk economics. Collectively, IFRS-17 embeds a culture of risk-based pricing and disciplined capital allocation.
Restraints Impact Analysis*
| Restraint | (~) % Impact on CAGR Forecast | Geographic Relevance | Impact Timeline |
|---|---|---|---|
| Rising loss-cost inflation in motor spare parts and medical liability | -2.4% | Nationwide, urban focus | Short term (≤ 2 years) |
| Tight re-insurance capacity for energy risks post-Ukraine conflict | -1.8% | Eastern industrial belt | Medium term (2–4 years) |
| Slow cyber insurance uptake amid low digital-risk awareness | -1.1% | Commercial hubs | Long term (≥ 4 years) |
| Fragmented agency channel with high commission leakage | -1.3% | Nationwide, small carriers | Medium term (2–4 years) |
| Source: Mordor Intelligence | |||
Rising Loss-Cost Inflation in Motor Spare Parts and Medical Liability
Global supply bottlenecks have kept electronic components and body panels scarce, lifting average parts costs per claim by double digits over 2024–2025. Medical fee inflation also feeds third-party bodily injury awards, compounding payout pressure in motor and general liability lines. Competitive tariff wars restrain premium hikes, causing combined ratios to edge toward breakeven despite volume growth. Some carriers adopt preferred-repairer networks and generic parts sourcing, yet savings lag headline inflation. Higher deductibles and tiered repair options are introduced, but consumer acceptance remains mixed. Until supply chains normalize, cost inflation will curb profitability and slow reinvestment in product innovation.
Slow Cyber Insurance Uptake Amid Low Digital-Risk Awareness
Saudi corporates increasingly digitize operations, but many still underestimate exposure to ransomware, business email compromise, and data privacy claims. Limited historical loss data in the region makes actuarial pricing cautious, so premiums appear high relative to perceived benefit, deterring take-up. SAMA’s recent approvals for cyber products aim to standardize wording and disclosures, yet market education remains a hurdle. Brokers are investing in seminars and tabletop simulations to illustrate potential financial impacts, but conversion rates remain low. Until major high-profile incidents occur locally, cyber insurance growth is likely to trail other specialty lines, muting overall market expansion in this segment.
*Our forecasts treat driver/restraint impacts as directional, not additive. The impact forecasts reflect baseline growth, mix effects, and variable interactions.
Segment Analysis
By Insurance Type: Diverse Risk Mix Underpins Growth
The Saudi Arabia property and casualty insurance market size for the motor segment stood at 21.45% of total premiums in 2025, underscoring its anchor role even as engineering policies log an 11.07% CAGR through 2031. Engineering coverage surges on the back of giga-project construction, pulling in international brokers and reinsurers and prompting domestic carriers to expand facultative arrangements. Motor premiums continue rising because enforcement closes the uninsured gap, but profit cushions remain slim due to spare-parts inflation and aggressive online price comparison portals. Property lines progress steadily, supported by urban residential growth and commercial real estate development. Marine underwriters cope with Red Sea shipping disruptions by introducing war-risk surcharges, yet the route’s strategic importance sustains freight volumes.
Aviation insurers cater to airport expansion and national carrier fleet renewal, with Tawuniya’s recent Saudia health contract reinforcing its presence in ancillary aviation-related benefits. Energy insurers navigate tighter capacity, but Eastern province clients still demand comprehensive cover for refinery expansions, stimulating domestic retention under the cession mandate. Liability classes gain momentum from professional services sector growth and stricter workplace safety rules that raise mandatory limits, helping diversify premium income away from commoditized lines.
The upward trajectory of engineering cover directly mirrors Vision 2030’s infrastructure calendar, translating each milestone into multi-year premium commitments, while the motor retains its foundational position because every new vehicle must carry insurance. Property and marine classes add stability, and liability lines supplement earnings with higher-margin specialist cover. Collectively, the segmented structure demonstrates how the Saudi Arabian property and casualty insurance market blends traditional volume lines with niche, higher-margin risks, allowing carriers to balance growth with profitability across economic cycles.


By Distribution Channel: Digital First yet Banks Accelerate
Direct sales delivered 26.55% of total written premiums in 2025, reflecting insurers' push toward web and app portals that lower acquisition costs and capture data for cross-selling analytics. Bancassurance, though smaller, is accelerating at a 14.05% CAGR as lenders embed insurance within loan origination journeys, leveraging deep customer relationships to boost penetration. Brokers still secure large corporate accounts where bespoke wording and complex risk engineering require advisory skill, but commission pressure is mounting after IFRS-17 sharpened expense visibility. Agencies, many family-owned, face fragmentation and commission leakage, prompting SAMA to tighten licensing and promote technology investment. Alternative distribution via car dealers, travel agents, and retailers grows in tandem with point-of-sale finance, letting carriers tap impulse purchases for motor and travel policies.
Digital channels align with the Kingdom’s 226-strong FinTech ecosystem, enabling in-app policy issuance and claim photo upload. Banks enrich their value proposition with bundled cover, raising stickiness in competitive consumer finance. The competitive interplay across channels ensures that the Saudi Arabian property and casualty insurance market remains accessible to consumers while giving corporate buyers specialized advisory options, maintaining distribution diversity even as digital uptake surges.
By End-Users: Corporate Bulk Meets Rising Individual Demand
Commercial and corporate buyers generated 61.75% of premiums in 2025, reflecting the weight of energy complexes, construction contractors, and large conglomerates in the national economy. However, the individual segment is growing briskly at an 11.35% CAGR as rising middle-class wealth and stricter enforcement enlarge household cover uptake beyond compulsory motor and health. SMEs emerge as a new focal point, supported by Vision 2030 entrepreneurship programs that spawn demand for multi-peril packages and liability cover tailored to modest balance sheets. Multinational firms entering Saudi Arabia need directors and officers, cyber, and global program alignment, pushing local carriers to deepen facultative links with foreign reinsurers. Public-sector procurement also underpins demand, especially in the Central region, where government agencies require property and professional indemnity.
The shifting end-user mix widens the risk spectrum, compelling carriers to invest in segmentation analytics, flexible pricing engines, and multilingual customer service. As individuals adopt telematics-based products and SMEs seek bundled digital-first packages, growth momentum in retail lines will supplement the still-dominant corporate base, buttressing broad-based expansion in the Saudi Arabian property and casualty insurance market.
Geography Analysis
The Western region, anchored by Jeddah’s commercial seaport and the USD 200 billion Red Sea Project, captured 35.10% of the Saudi Arabia property and casualty insurance market share in 2025. Property, marine, and engineering cover benefits from tourism infrastructure and logistics investments that drive demand for high-limit policies. Climate risk is acute here because flash floods have repeatedly inundated coastal cities; insurers, therefore, deploy detailed catastrophe models to price micro-zones and guide re-insurance placements. Local underwriters also design travel and pilgrimage-related covers tailored to Mecca-bound visitors, strengthening premium diversity and underwriting margins.
The Eastern province is expanding at a 9.45% CAGR on the back of Saudi Aramco refinery upgrades, petrochemical park build-outs, and associated logistics corridors. Energy, property, and liability lines dominate the regional book, and risk concentration is partly offset by the 30% cession mandate that channels capacity to Saudi Re and peers. Port congestion and Red Sea security challenges have elevated marine war-risk premiums, yet industrial clients accept higher rates because coverage remains critical to project finance covenants. The depth of engineering expertise in Dammam and Jubail helps domestic carriers refine risk selection, cementing competitive advantages.
Central Saudi Arabia leverages Riyadh’s role as the political and financial nucleus to spur demand for directors and officers, professional indemnity, and technology-driven cyber cover. The public-sector insurance budget sets a floor for premium volumes, and the clustering of headquarters for banks, telecoms, and consultancy firms further enlarges the addressable pool. Complementary infrastructure projects, including metro lines and smart-city districts, call for specialized construction cover, linking Central growth to the same giga-project cycle that fuels Western momentum. Collectively, these regional profiles reinforce the breadth of opportunity in the SaudiArabiana property and casualty insurance market while highlighting the necessity of granular underwriting strategies attuned to local risk factors.
Competitive Landscape
The five largest insurers collected the majority of gross written premiums in 2024, signaling high concentration, yet regulatory and market reforms are intensifying rivalry. Tawuniya, Bupa Arabia, Al-Rajhi Takaful, MEDGULF, and Walaa maintain scale advantages, but smaller players pursue niche engineering and cyber lines to differentiate. Profitability improved in 2024, with sector combined earnings up 50% to SAR 910.5 million, aided by stricter motor enforcement and IFRS-17-driven pricing discipline. Digital transformation is a dominant theme: Najm now delivers 95% of services through digital channels, demonstrating how streamlined claims workflows can enhance customer retention.
Government support is visible through the Public Investment Fund’s equity infusion into Saudi Re, which strengthens local capacity and provides larger line sizes for high-hazard risks. The initiative complements the cession mandate and could trigger consolidation as smaller insurers partner with the beefed-up reinsurer for balance-sheet relief. International reinsurers continue to provide know-how, but their selective appetite following the Ukraine conflict urges primary carriers to upgrade risk analytics and capital buffers.
InsurTech disruptors thrive under SAMA’s regulatory sandbox, which hosts 226 FinTech firms developing usage-based products, blockchain claims protocols, and AI pricing engines. Established players respond by acquiring technology stakes or launching venture arms to secure innovation pipelines. Talent acquisition, especially in data science and actuarial modeling, becomes a battleground as firms attempt to fortify competitive advantage in the evolving Saudi Arabia property and casualty insurance market.
Saudi Arabia Property and Casualty Insurance Industry Leaders
The Company for Cooperative Insurance (Tawuniya)
Malath Cooperative Insurance Co.
Mediterranean & Gulf Cooperative Insurance & Reinsurance (MEDGULF)
Salama Cooperative Insurance Co.
Arabian Shield Cooperative Insurance Co.
- *Disclaimer: Major Players sorted in no particular order

Recent Industry Developments
- March 2025: Tawuniya won a health insurance mandate from Saudi Arabia worth more than 5% of its 2023 premium income, underscoring the opportunity in large corporate accounts.
- January 2025: Public Investment Fund finalized its strategic investment in Saudi Reinsurance Company, bolstering domestic reinsurance capacity and reducing reliance on overseas markets.
- November 2024: The Saudi Insurance Authority activated the 30% local reinsurance cession rule, expected to lift domestic reinsurer earnings by 25% in 2025.
- May 2024: MEDGULF trimmed accumulated losses to 34.1% of capital despite a 27% quarterly profit slide.
- March 2024: Bupa Arabia renewed its operating license with SAMA through January 2026.


Research Methodology Framework and Report Scope
Market Definitions and Key Coverage
Our study defines Saudi Arabia's property & casualty (P&C) insurance market as all non-life lines, motor, property/fire, marine, aviation, energy, engineering, and accident & liability, measured by gross written premiums collected from licensed insurers operating inside the Kingdom.
Scope Exclusion: life, savings, and stand-alone medical policies are outside the present analysis.
Segmentation Overview
- By Insurance Type
- Motor
- Property / Fire
- Marine
- Aviation
- Energy
- Engineering
- Accident & Liability
- By Distribution Channel
- Insurance Agency
- Bancassurance
- Brokers
- Direct Sales
- Other Distribution Channels
- By End-Users
- Retail (Individual)
- Small and Medium Enterprises (SME's)
- Commercial/ Corporates
- By Region
- Central
- Western
- Eastern
- Northern
- Southern
Detailed Research Methodology and Data Validation
Primary Research
Discussions with underwriters, brokers, corporate risk managers, and SAMA officials across Riyadh, Jeddah, and Dammam helped us stress-test pricing cycles, reinsurance costs, and expected uptake of mandatory covers. Short online surveys with SME owners clarified channel preferences and average policy limits, enabling us to refine assumed penetration rates.
Desk Research
We started with line-item premium statistics, loss ratios, and cession rules published by the Saudi Central Bank (SAMA) and the annual Saudi Insurance Market Report. We then overlaid macro signals from GaStat on vehicle parc growth, construction permits, and non-oil GDP. Additional perspective came from cooperative insurance bylaws, Vision 2030 project briefs, and news coverage in Dow Jones Factiva. Company-level disclosures gathered via D&B Hoovers, audited IFRS-17 statements, and listed-insurer filings provided crucial bottom checks on premium volumes and retention levels.
To enrich trend context, our analysts tapped trade associations such as the Insurance Executive Committee, customs shipment data for high-value assets, and patent databases (Questel) to gauge insurtech adoption. The sources cited above illustrate the breadth of desk work; many other public and paid references were consulted for validation and clarification.
Market-Sizing & Forecasting
A top-down model begins with 2024 gross written premiums reported by SAMA, which are then segmented by line, adjusted for obligatory 30% local reinsurance cession, and converted to USD at the yearly average SAR rate. Results are corroborated through selective bottom-up checks, aggregating 2024 premiums disclosed by the ten largest listed carriers and sampling average motor and engineering rates from broker interviews to align totals within a ±3% band.
Key model drivers include new-vehicle registrations, commercial floor-space completions, giga-project CAPEX schedules, inflation-linked rate filings, and solvency margin rules. An ARIMA-based forecast, supplemented by scenario analysis around Vision 2030 spending swings, projects premiums to 2030. Coefficient ranges are validated with expert consensus and revised when macro assumptions shift.
Data Validation & Update Cycle
Outputs pass variance and anomaly screens, peer review, and a senior sign-off. We refresh the dataset every twelve months, with interim updates triggered by material regulatory or macro events, ensuring clients receive the latest vetted view.
Why Mordor Intelligence's Saudi Arabia Property And Casualty Insurance Baseline Commands Confidence
Published estimates often diverge because firms pick different lines, retention assumptions, and FX cut-offs.
According to Mordor analysts, clarity on scope and disciplined annual refresh keep our baseline sturdy while others drift with outdated inputs.
Benchmark comparison
| Market Size | Anonymized source | Primary gap driver |
|---|---|---|
| USD 9.62 B (2025) | Mordor Intelligence | - |
| USD 6.90 B (2024) | Global Consultancy A | Omits engineering & energy lines; uses 2023 FX average |
| USD 0.79 B (2025) | Regional Publisher B | Counts property lines only; reports net premiums post-cession |
These contrasts show why decision-makers rely on Mordor Intelligence: our numbers trace back to transparent variables, dual-path validation, and an update cadence that keeps the baseline dependable.


Key Questions Answered in the Report
What is the projected value of the Saudi Arabia property and casualty insurance market by 2031?
The market is expected to reach USD 23.59 billion by 2031, growing at a 16.12% CAGR.
Why is engineering insurance growing the fastest in the Kingdom?
USD 850 billion worth of mega-projects, such as NEOM and the Red Sea development, need specialized construction-all-risk and delay-in-start-up cover, driving an 11.07% CAGR in engineering lines.
How does the 30% local re-insurance cession rule affect insurers?
The rule channels premium outflows back to domestic reinsurers, improving on-shore capacity while giving primary carriers more stable pricing amid a hardening global re-insurance market.
Which region currently generates the most premiums?
The Western region leads with 35.10% of the Saudi Arabia property and casualty insurance market size, buoyed by tourism and large coastal infrastructure projects.
What role is InsurTech playing in market expansion?
Telematics-based motor products and WhatsApp claims processing lower costs and attract younger drivers, widening the insured pool and improving loss-ratio management.
Page last updated on:


