Reinsurance Market Size and Share
Market Overview
| Study Period | 2020 - 2031 |
|---|---|
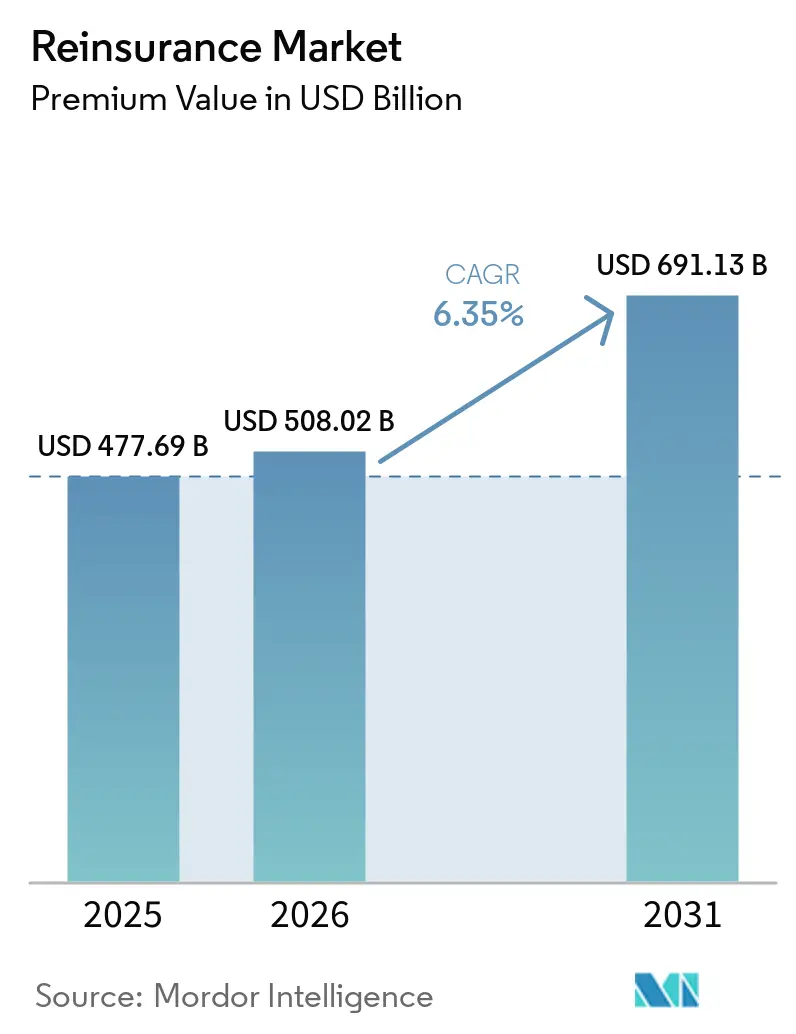
| Market Size (2026) | USD 508.02 Billion |
| Market Size (2031) | USD 691.13 Billion |
| Growth Rate (2026 - 2031) | 6.35% CAGR |
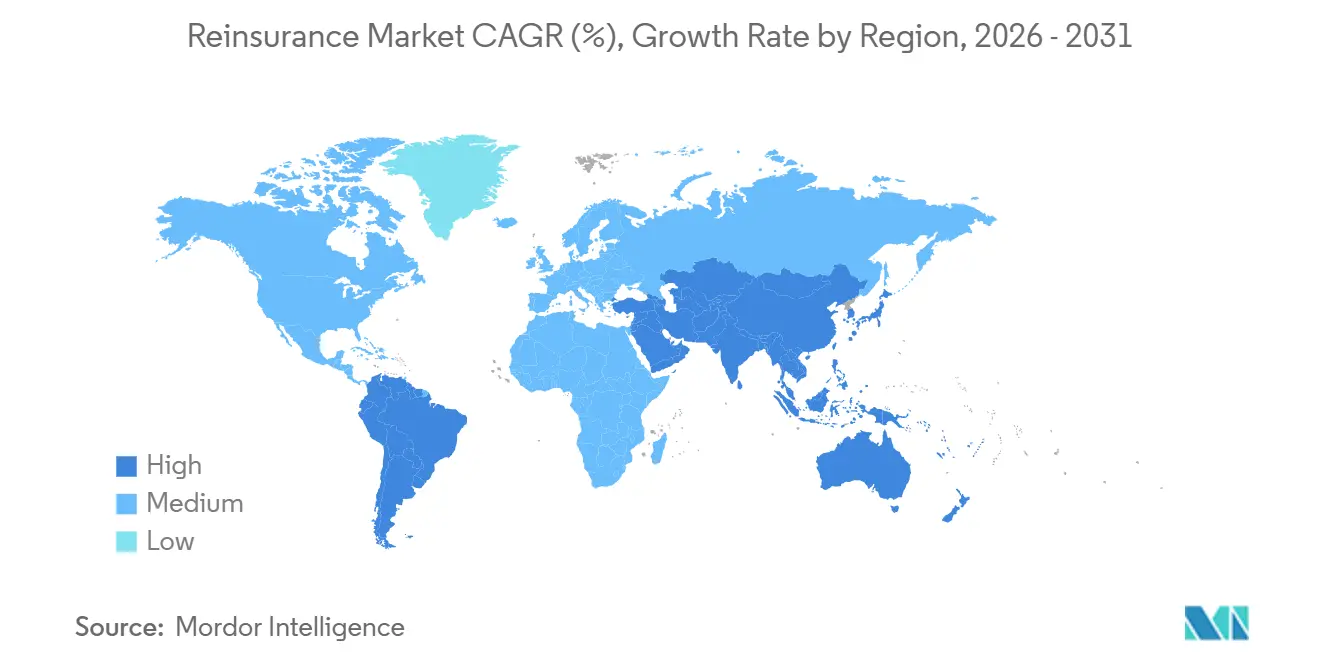
| Fastest Growing Market | Asia Pacific |
| Largest Market | Europe |
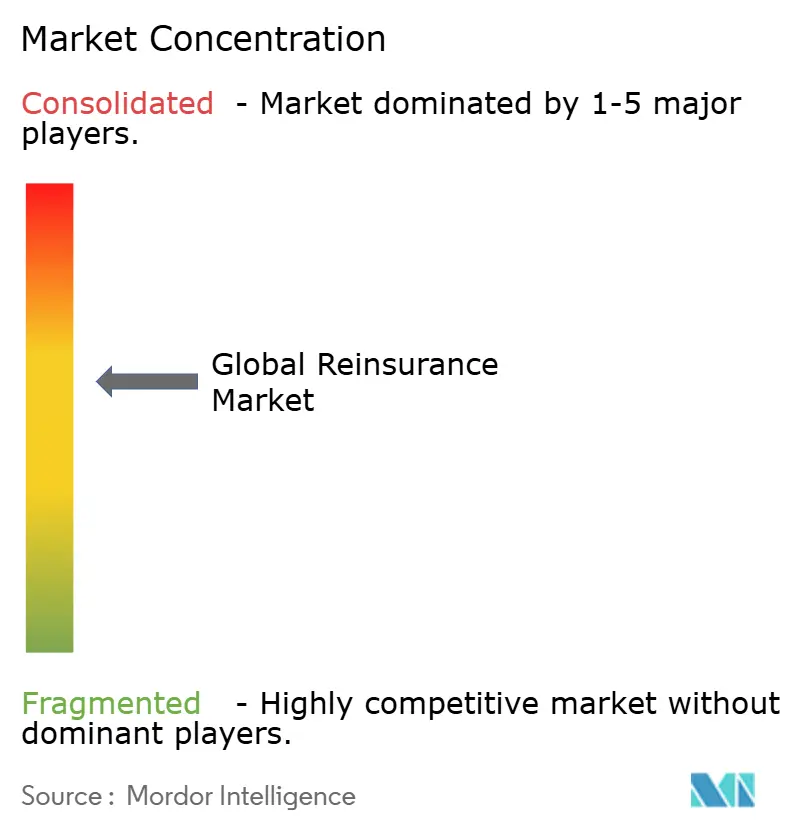
| Market Concentration | Medium |
Major Players *Disclaimer: Major Players sorted in no particular order Image © Mordor Intelligence. Reuse requires attribution under CC BY 4.0. | |
Reinsurance Market Analysis by Mordor Intelligence
The Reinsurance Market size in terms of premium value is expected to grow from USD 477.69 billion in 2025 to USD 508.02 billion in 2026 and is forecast to reach USD 691.13 billion by 2031 at 6.35% CAGR over 2026-2031.
Rising catastrophe losses, tighter capital rules under IFRS 17, and a favorable pricing cycle are combining to make reinsurance capacity indispensable to primary insurers in both mature and emerging economies. Hard‐market pricing has restored underwriting profitability, while alternative capital continues to enlarge overall capacity even as investors become more selective. Demand is further amplified by rapid growth in specialty risks, most notably cyber, where traditional insurance alone struggles to meet coverage needs. Against this backdrop, reinsurers are accelerating digital transformation, embedding parametric triggers, and expanding direct relationships with cedents to preserve margins and unlock new revenue pools.
Key Report Takeaways
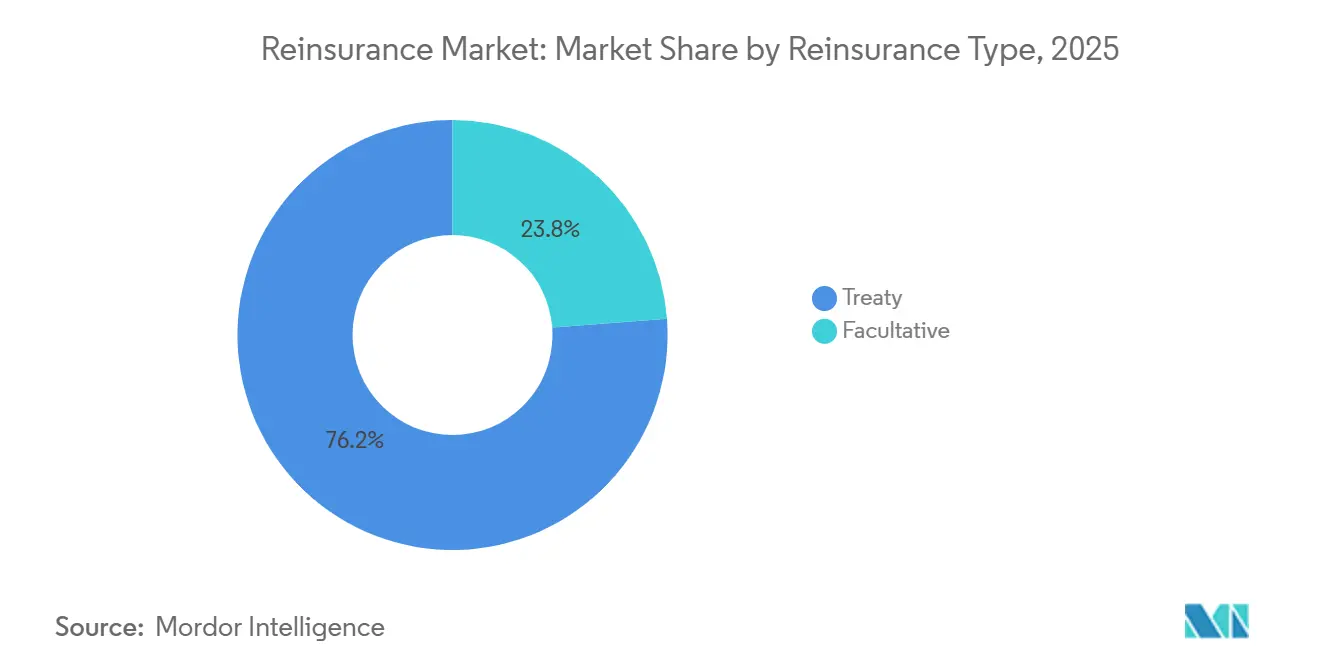
- By type, treaty reinsurance captured 76.20% of the reinsurance market size in 2025; facultative is advancing at an 8.05% CAGR through 2031.
- By line of business, property & casualty accounted for 62.40% share of the reinsurance market size in 2025; specialty lines are growing at an 11.18% CAGR to 2031.
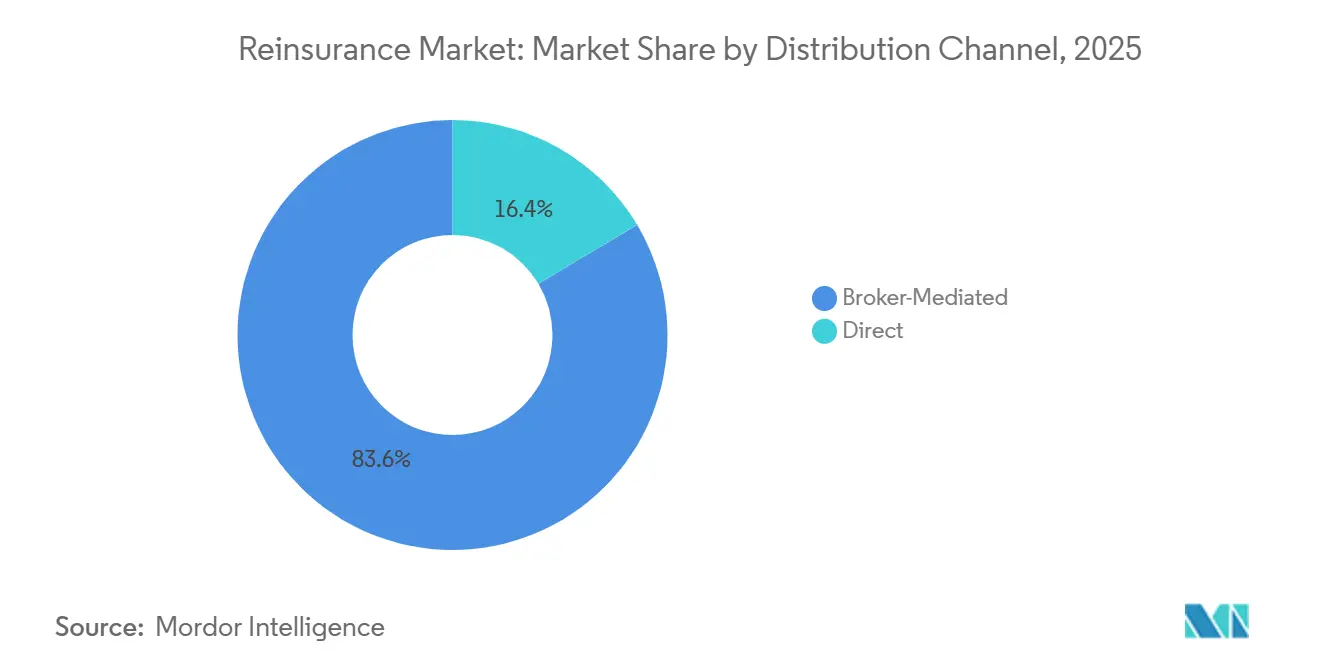
- By distribution channel, broker-mediated placements held 83.56% share of the reinsurance market size in 2025; direct writing is growing at an 8.65% CAGR through 2031.
- By capital source, traditional rated carriers retained 81.24% share of the reinsurance market in 2025; alternative capital is expanding at a 13.98% CAGR to 2031.
- By region, Europe led with 31.40% reinsurance market share in 2025; Asia-Pacific is projected to expand at a 7.23% CAGR to 2031.
Note: Market size and forecast figures in this report are generated using Mordor Intelligence’s proprietary estimation framework, updated with the latest available data and insights as of January 2026.
Global Reinsurance Market Trends and Insights
Drivers Impact Analysis*
| Driver | (~)% Impact on CAGR Forecast | Geographic Relevance | Impact Timeline |
|---|---|---|---|
| Growing insurance penetration in emerging economies | +1.2% | Asia-Pacific, Latin America, Africa | Medium term (2-4 years) |
| Escalating climate-related NatCat losses raise demand | +1.8% | Global, concentrated in North America, Europe | Long term (≥ 4 years) |
| Tight primary-insurer capital buffers post-IFRS 17 | +0.9% | Global, primarily Europe and developed markets | Short term (≤ 2 years) |
| Hard-market pricing cycle boosts reinsurer returns | +0.7% | Global | Short term (≤ 2 years) |
| Parametric & cyber reinsurance innovation | +0.4% | North America, Europe, Asia-Pacific | Medium term (2-4 years) |
| Embedded-finance platforms ceding micro-risk pools | +0.2% | Global, early adoption in developed markets | Long term (≥ 4 years) |
| Source: Mordor Intelligence | |||
Growing Insurance Penetration in Emerging Economies
Insurance uptake continues to rise across high-growth markets, driving sustained demand for the reinsurance market as cedents seek diversified capacity beyond domestic risk pools. India is on pace to hold the world’s third-largest insurance sector by decade-end, with health and motor products expanding quickly under regulatory encouragement [1]Swiss Re, “Financial Outlook 2025,” swissre.com . China’s favorable treatment of Hong Kong-based reinsurers underscores Beijing’s aim of integrating financial services while retaining access to foreign capital. Rapid cyber-risk accumulation in Asia-Pacific, already 7% of global cyber premiums, is another catalyst, producing double-digit reinsurance growth as local carriers seek balance-sheet relief. Mandatory lines such as crop and motor third-party liability are maturing ahead of GDP, further cementing structural demand for outward reinsurance. Regional solvency regimes, however, impose compliance costs that only well-capitalized reinsurers can absorb, reinforcing industry consolidation[2]EIOPA, “IFRS 17 Impact Assessment,” eiopa.europa.eu .
Escalating Climate-Related Natural Catastrophe Losses Raise Demand
Insured NatCat losses topped historical averages again in 2024, making that year among the costliest on record and elevating the reinsurance market’s centrality in risk transfer. Munich Re alone absorbed EUR 3.89 billion of major losses, including USD 1.3 billion from California wildfires. The growing frequency of severe convective storms is widening the loss footprint beyond familiar hurricane and earthquake zones, requiring fresh capital and new modeling approaches. Investors now view heightened catastrophe activity as a structural shift rather than transient volatility, prompting repricing across catastrophe bonds and collateralized reinsurance[3]Bloomberg, “Catastrophe Bond Issuance Hits Record,” bloomberg.com . Parametric covers that pay out rapidly on objective triggers are proliferating, helping close protection gaps where indemnity products lag. Governments are also partnering with reinsurers to craft public–private pools that share residual risk and support post-disaster rebuilding.
Tight Primary-Insurer Capital Buffers Post-IFRS 17
IFRS 17 has altered profit recognition and contract boundaries, squeezing capital buffers and pushing cedents to cede more risk to the reinsurance market. An EIOPA review of 53 groups showed non-life liabilities jumping 9.5% under the new standard, while life liabilities declined, creating uneven capital impacts. Contractual Service Margins now defer profit realization, prompting insurers to seek quota-share structures that smooth earnings. US life carriers have increased cession ratios for the third consecutive year, using reinsurance to manage long-duration guarantee risk and reduce reserve strain. European cedents are likewise blending solvency and accounting objectives by using reinsurance to arbitrage between Solvency II and IFRS 17 treatments. Early evidence suggests that optimization will intensify once insurers fully embed IFRS 17 into planning cycles.
Hard-Market Pricing Cycle Boosts Reinsurer Returns
The reinsurance market entered 2025 with still-firm rates after multiple renewal cycles of double-digit increases, lifting underwriting margins across most carriers. Munich Re delivered EUR 5.7 billion net profit in 2024, exceeding prior guidance and reporting a reinsurance combined ratio of 80.6%. Swiss Re targets USD 4.4 billion of 2025 net income with a sub-85% P&C combined ratio, attesting to continued pricing power. Hannover Re’s 2024 net earnings climbed 28% as its combined ratio tightened to 86.6%, amid disciplined casualty underwriting. Casualty and specialty remain firm due to social inflation and nuclear verdict risks, while property treaty pricing moderated slightly but remains above long-term adequate levels. Robust returns are enabling carriers to fund technology investments and share-buyback programs, reinforcing shareholder confidence.
Restraints Impact Analysis*
| Restraint | (~)% Impact on CAGR Forecast | Geographic Relevance | Impact Timeline |
|---|---|---|---|
| Geopolitical & macro-economic volatility | -0.8% | Global, concentrated in emerging markets | Short term (≤ 2 years) |
| Regulatory capital constraints (Solvency II, RBC) | -0.6% | Europe, North America | Medium term (2-4 years) |
| ILS investors’ risk-return fatigue | -0.4% | Global, concentrated in Bermuda, London | Medium term (2-4 years) |
| AI-driven model risk & data-privacy hurdles | -0.3% | Global, early impact in developed markets | Long term (≥ 4 years) |
| Source: Mordor Intelligence | |||
Geopolitical & Macro-Economic Volatility
Rising geopolitical tension and uneven macroeconomic conditions weaken primary insurance growth and complicate cross-border reinsurance placements. Currency swings and inflation induce model risk, especially for reinsurers reporting in hard currencies but paying claims in depreciating local currencies. Trade frictions add regulatory checks that elongate placement timetables and inflate compliance costs. Supply-chain disruptions are forcing higher risk premiums in marine and contingent business interruption covers, dampening cedent appetites where margins are thin. Finally, higher interest-rate volatility complicates asset-liability management, challenging reinsurers’ investment returns at the very time cat losses remain elevated.
Regulatory Capital Constraints (Solvency II, RBC)
Diverging solvency rules raise complexity and could narrow market participation. The EU’s draft Solvency II reform may lift capital charges on long-tail risks, prompting portfolio shifts. The UK’s Solvency UK path creates fragmentation that demands dual compliance from groups writing in both London and Europe. In the US, the NAIC’s new RBC Task Force signals tighter oversight of reinsurance recoverables, likely affecting collateral frameworks. Cross-border treaties must now navigate overlapping disclosure mandates, encouraging cedents to rely on large, rated reinsurers and marginalizing smaller entrants. Over time, global efforts to converge toward an Insurance Capital Standard may streamline rules, but implementation timelines remain uncertain.
*Our forecasts treat driver/restraint impacts as directional, not additive. The impact forecasts reflect baseline growth, mix effects, and variable interactions.
Segment Analysis
By Reinsurance Type: Treaty Dominance Amid Facultative Innovation
Treaty business accounted for 76.20% reinsurance market share in 2025, a level that translated into USD 358.2 billion of ceded premium and underscored cedents’ preference for portfolio-wide protection. Facultative placements, though smaller, are forecast to grow at an 8.05% CAGR as underwriters respond to large-scale solar plants, offshore wind, and bespoke cyber exposures that standard treaties omit. Digital administration platforms are simplifying bordereaux handling, allowing treaty programs to embed parametric triggers for quicker recoveries and reducing frictional costs by up to 25% according to Swiss Re’s internal metrics.
Demand for facultative coverage is also bolstered by mega-projects such as smart-city infrastructure and green hydrogen facilities that exceed individual treaty limits. Insurtech analytics now enable cedents to assess facultative quotes in hours rather than days, closing placement gaps more efficiently. Many reinsurers are bundling treaty and facultative offerings to deepen client penetration, thereby tightening switching costs and sustaining the reinsurance market’s overall growth trajectory.


By Line of Business: Specialty Lines Disrupt Traditional Dominance
Property and Casualty held 62.40% of the reinsurance market size in 2025, supported by consistent demand for catastrophe and liability capacity. Specialty lines - cyber, aviation, marine, energy - are projected to grow at 11.18% CAGR, adding more than USD 20 billion in ceded premium by 2031. Growth is fueled by digitization, supply-chain complexity, and new energy transition risks that fall outside classic P&C frameworks.
Hannover Re’s cloud outage cat bond signals a broader wave of specialty risk securitization that could eventually influence P&C program design. ESG expectations are spurring demand for renewable-energy performance guarantees, another niche requiring tailored reinsurance. As specialty lines mature, reinsurers are forming dedicated teams and forging partnerships with cybersecurity firms, enabling more granular pricing and loss prevention services. These initiatives diversify earnings and help reinsurers manage correlation risk across their portfolios.
By Distribution Channel: Broker Intermediation Faces Digital Disruption
Broker-mediated placements retained 83.56% share of the reinsurance market size in 2025, highlighting the value of advisory services and global market access that the largest intermediaries deliver. The top three brokers continue to consolidate shares, leveraging advanced analytics and placement platforms to optimize program structures.
Direct writing, however, is expanding at 8.65% CAGR as reinsurers deploy APIs and self-service portals that make smaller quota-share deals economical. Swiss Re’s tie-up with a GenAI platform cut quote turnaround times by 30%, signaling how automation can shrink the intermediation gap. Parametric covers, with standardized triggers, lend themselves to direct digital distribution, especially for SMEs seeking swift protection. Nonetheless, complex multi-line programs for large corporates still lean on broker expertise, sustaining the reinsurance market’s hybrid distribution architecture.
By Capital Source: Alternative Capital Reshapes Traditional Models
Traditional rated carriers supplied 81.24% of global capacity in 2025, but the reinsurance market is seeing faster growth from alternative capital, which is scaling at a 13.98% CAGR. Cat-bond issuance hit USD 16 billion in 2024, the highest on record, as pension funds and sovereign wealth investors chase uncorrelated returns.
Sidecars and collateralized reinsurance now support more quota-shares, particularly in Florida wind and Japanese typhoon layers, where peak risk is concentrated. Yet investor fatigue following consecutive loss years is driving a shift toward multi-year structures with tighter terms that favor sponsors’ capital efficiency but demand better transparency. Traditional reinsurers continue to co-manage ILS funds, using fee income to smooth combined-ratio volatility and strengthen client relationships by offering blended capacity.
Geography Analysis
Europe anchored 31.40% of the 2025 reinsurance market size, supported by mature insurance penetration, sophisticated solvency oversight, and hub ecosystems in London, Zurich, and continental centers. Severe convective storm losses and evolving ESG mandates are reshaping product development and capital deployment, prompting reinsurers to integrate climate-science data into continental pricing. Solvency UK’s divergence may gradually redirect some placements to European entities while London retains strength in specialty risk through Lloyd’s syndicates.
Asia-Pacific is the fastest-expanding region at a projected 7.23% CAGR through 2031, bringing the reinsurance market new premium pools in India, China, and Southeast Asia. Preferential capital treatment for Hong Kong-domiciled reinsurers facilitates Mainland access, illustrating policymakers' support for cross-border risk transfer. Rapid cyber exposure growth - nearly 50% annually - positions the region as a testing ground for digital parametric solutions. Mandatory health and motor schemes in India and the GCC also pull in proportional reinsurance, bolstering multi-line diversification in local markets.
North America remains the largest single-country market, underpinned by the United States’ deep capital markets and substantial catastrophe needs. The NAIC’s review of RBC factors could influence the reinsurance market share of offshore collateralized providers that currently enjoy credit for clean letters of credit. Meanwhile, reinsurers are expanding Latin American footprints via Miami hubs to tap growth in agriculture and parametric earthquake covers. The Middle East and Africa, though smaller, show rising demand linked to infrastructure investments and health-insurance mandates, areas where reinsurance supports solvency and product innovation.
Mordor Intelligence provides coverage of the reinsurance market across other key regional markets. Detailed country-level analysis extends to Germany and Switzerland incorporating local coverage and market participation, as required.

Competitive Landscape
Global reinsurance competition centers on scale, capital strength, and technological capabilities. Munich Re, Swiss Re, and Hannover Re held leading positions in 2025 by combining diversified portfolios with disciplined underwriting, each reporting sub-90% combined ratios and robust solvency cushions. Digitally native challengers such as Conduit Re leverage cloud-based platforms to underwrite efficiently but still lack geographic breadth, leaving incumbent reinsurers dominant in multiline placements.
Strategic moves emphasize digital enablement and specialty diversification. Swiss Re’s alliance with a GenAI engine for P&C underwriting showcases how machine learning can shorten quote times and refine rate adequacy. Munich Re’s share-buyback and elevated dividend highlight confidence in sustained earnings while preserving capacity for growth in specialty and cyber segments. Hannover Re’s pioneering cloud outage bond underscores first-mover advantage in parametric structures that compete with ILS funds for investor interest.
Alternative capital managers, including Fermat and Twelve Capital, are broadening collateralized offerings, yet rising coupon spreads suggest investors are demanding clearer risk transparency and longer-duration commitments. Brokers retain influence through proprietary placement platforms and portfolio analytics, with Aon and Gallagher leveraging data to negotiate multi-year deals that lock in client relationships. As regulators tighten AI governance and solvency rules, incumbents with advanced compliance infrastructures will likely consolidate share, though niche reinsurers that master specialty expertise can still thrive in defined verticals.
Reinsurance Industry Leaders
Munich Re
Swiss RE
Hannover Re Group
Berkshire Hathaway Inc
SCOR SE
- *Disclaimer: Major Players sorted in no particular order

Recent Industry Developments
- February 2025: Fortitude Re and Unum Group have completed a significant reinsurance transaction valued at USD 3.4 billion, aimed at enhancing Unum's financial flexibility. The deal covers approximately 19% of Unum’s long-term care reserves, transferring associated risks to Fortitude Re.
- February 2025: RGA reinsured USD 32 billion of life policies from Equitable. It deployed USD 1.5 billion of capital to support the transaction.
- December 2024: Nippon Life agreed to purchase the remaining stake in Resolution Life in a deal valued at USD 8.2 billion. The acquisition aimed to strengthen Nippon Life’s global footprint in the life insurance and in-force policy management sector.
- December 2024: MetLife and General Atlantic announced Chariot Reinsurance Ltd with initial equity above USD 1 billion.


Research Methodology Framework and Report Scope
Market Definitions and Key Coverage
Our study treats the reinsurance market as the total gross written premiums ceded to licensed reinsurers worldwide, spanning treaty and facultative arrangements across property and casualty as well as life and health lines. Risks placed through both broker-mediated and direct channels are captured, and figures are presented in constant 2025 US dollars to neutralize inflation.
Scope exclusion: internal group retrocession and primary insurance premiums sit outside this boundary.
Segmentation Overview
- By Reinsurance Type
- Facultative Reinsurance
- Treaty Reinsurance
- By Line of Business
- Property & Casualty
- Life & Health
- Specialty (Aviation, Marine, Energy)
- Others
- By Distribution Channel
- Direct Writing
- Broker-Mediated
- By Capital Source
- Traditional Rated Reinsurers
- Alternative Capital (ILS, Sidecars)
- By Region
- North America
- United States
- Canada
- Mexico
- South America
- Brazil
- Argentina
- Rest of South America
- Europe
- United Kingdom
- Germany
- France
- Italy
- Spain
- Russia
- Rest of Europe
- Asia-Pacific
- China
- India
- Japan
- Australia
- South Korea
- Rest of Asia-Pacific
- Middle East & Africa
- United Arab Emirates
- Saudi Arabia
- South Africa
- Rest of Middle East & Africa
- North America
Detailed Research Methodology and Data Validation
Primary Research
Discussions with underwriting heads, retro buyers, regulators, and broking specialists across North America, Europe, and Asia helped us refine retention ratios, catastrophe attachment behavior, and alternative capital penetration. Their feedback bridged data gaps and shaped scenario assumptions before final triangulation.
Desk Research
We began with public supervisory datasets from IAIS GIMAR, NAIC, EIOPA, and OECD Insurance Statistics, then layered them with annual statements, S&P Global quarterly filings, and sigma notes from Swiss Re. Macro signals such as global GDP, insured catastrophe losses, and central bank rate moves were tracked through IMF, Fitch, and AM Best briefs. To enrich company intelligence, our team tapped D&B Hoovers for reinsurer financials and Dow Jones Factiva for news flow. These sources, while powerful, are illustrative only; many additional open records and paid archives supported baseline checks.
Market-Sizing and Forecasting
We start top down, collecting national reinsurance premium totals, adjusting for cross-border cessions and currency, which are then reconciled with a bottom-up roll-up of sampled reinsurer premiums and broker channel checks. Key levers in the model include insured CAT loss frequency, combined ratio cycles, global dedicated reinsurance capital, primary premium growth, and investment yield spreads.
Forecasts to 2030 rest on a multivariate regression blended with scenario analysis for severe NATCAT years; expert consensus guides variable elasticities. Where corporate disclosures are partial, we interpolate using five-year average retention and line of business growth differentials before re-testing against historical variance bands.
Data Validation and Update Cycle
Outputs pass anomaly scans, peer review, and management sign-off. Reports refresh every twelve months, and we trigger interim revisions after material loss seasons or regulatory shifts. A fresh analyst sweep precedes client delivery so our view remains current.
Why Our Reinsurance Baseline from Mordor Commands Confidence
Published figures often diverge because firms vary in scope, data cuts, and refresh cadence.
Our analysts declare all inclusions upfront, convert every dataset to common currency year, and revisit assumptions each season, which limits drift.
Benchmark comparison
| Market Size | Anonymized source | Primary gap driver |
|---|---|---|
| USD 469.7 B (2025) | Mordor Intelligence | - |
| USD 574.7 B (2024) | Global Consultancy A | Retro flows and broker commissions counted as premium |
| USD 631.6 B (2024) | Industry Data Publisher B | Capital converted to premium at flat ratio, limited geographic split |
| USD 711.8 B (2024) | Analytics Firm C | Combines reinsurance with specialty primary lines, no FX rebasing |
Taken together, the comparison shows how careful scope controls, live currency adjustment, and annual refresh give Mordor Intelligence a balanced, transparent baseline that decision-makers can retrace and trust.


Key Questions Answered in the Report
What is the current size of the reinsurance market?
The reinsurance market is projected to reach USD 508 billion in 2026 and is forecasted to reach USD 691 billion by 2031.
Which region leads the reinsurance market?
Europe held the largest regional share at 31.40% in 2025, while Asia-Pacific is the fastest-growing region with a projected 7.24% CAGR through 2031.
Why are specialty lines such as cyber growing so quickly?
Digital transformation and emerging risks outpace traditional coverage, driving an 11.18% CAGR in specialty ceded premium and attracting reinsurers to higher-margin segments.
How is alternative capital influencing the market?
Insurance-linked securities and other collateralized structures are expanding at a 13.98% CAGR, supplying additional capacity but also prompting stricter transparency demands from investors.
Page last updated on:


