
Market Overview
| Study Period | 2021 - 2031 |
|---|---|
| Forecast Data Period | 2026 - 2031 |
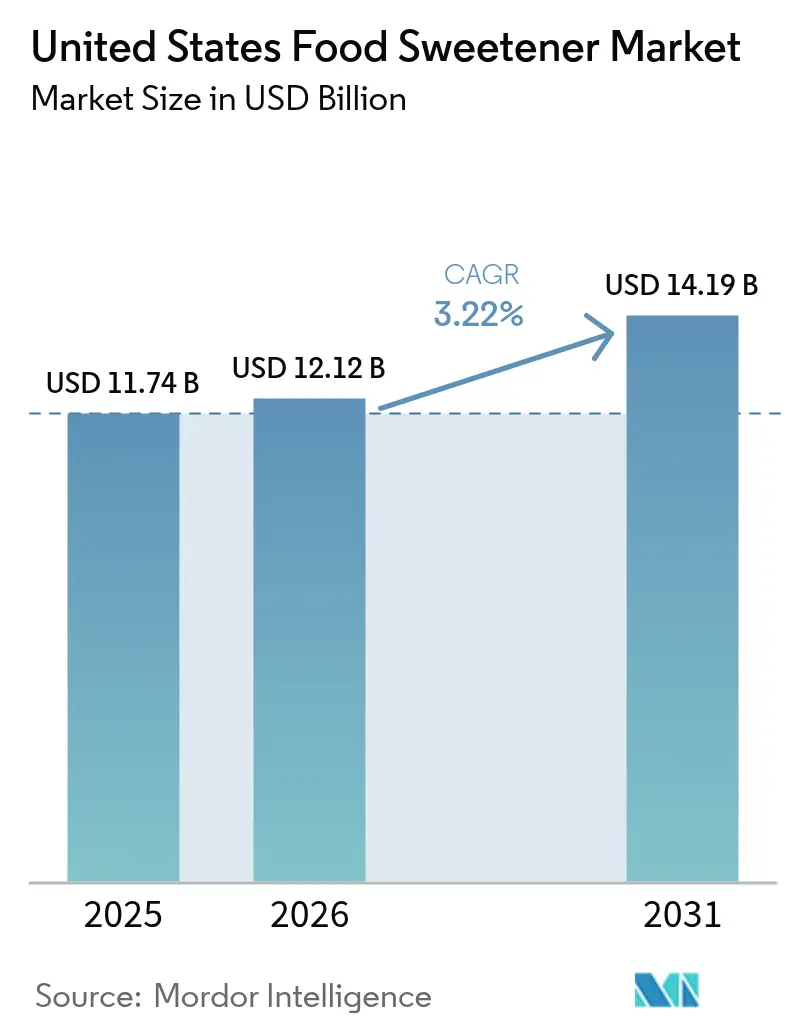
| Base Year Market Size (2025) | USD 11.74 Billion |
| Market Size (2026) | USD 12.12 Billion |
| Market Size (2031) | USD 14.19 Billion |
| Growth Rate (2026 - 2031) | 3.22 % |
| Market Concentration | Medium |
Major Players *Disclaimer: Major Players sorted in no particular order Image © Mordor Intelligence. Reuse requires attribution under CC BY 4.0. | |
United States Food Sweetener Market Analysis by Mordor Intelligence
The United States food sweetener market size was valued at USD 11.74 billion in 2025 and estimated to grow from USD 12.12 billion in 2026 to reach USD 14.19 billion by 2031, at a CAGR of 3.22% during the forecast period (2026-2031). This overall growth masks significant shifts within the product portfolio. Sucrose is expected to account for 68.39% of the market value in 2024, but high-intensity sweeteners are anticipated to experience the fastest growth, with a CAGR of 3.96% through 2030. This trend is driven by increasing demand for calorie control, heightened scrutiny of product labels, and the rising use of glucagon-like peptide-1 (GLP-1) receptor agonist drugs, which are contributing to reduced sugar consumption. The number of GLP-1 receptor agonist users is projected to expand from approximately 7 million to as many as 30 million by 2030. Early data indicates that patients using these medications reduce their purchases of sweet baked goods within six months of starting therapy. Regulatory developments are also influencing the market. The United States Food and Drug Administration (FDA) approved enzyme-modified steviol glycosides in October 2024 and Brazzein preparations in July 2025, shortening the approval cycle for natural high-intensity sweeteners to approximately two years. Additionally, major beverage companies are meeting stringent added-sugar reduction targets, while retailers are emphasizing organic and non-genetically modified organism (non-GMO) certifications. These factors are encouraging cost-conscious manufacturers to adopt blended sweetener systems that maintain taste, bulk, and browning properties.
Key Report Takeaways
- By product type, sucrose accounted for 67.85% of the United States food sweetener market share in 2025, while high-intensity sweeteners are projected to grow at a CAGR of 3.84% through 2031.
- By application, beverages held a 44.55% value share in 2025, with the bakery and confectionery segment expected to grow at a CAGR of 3.61% by 2031.
- By form, powder formats represented 51.40% of the market share in 2025, whereas liquid formats are anticipated to grow at a CAGR of 3.75% during the forecast period.
- By category, conventional variants dominated with an 82.35% share in 2025, while organic offerings are forecast to expand at a CAGR of 3.65% through 2031.
Note: Market size and forecast figures in this report are generated using Mordor Intelligence’s proprietary estimation framework, updated with the latest available data and insights as of 2026.
United States Food Sweetener Market Trends and Insights
Drivers Impact Analysis*
| Driver | (~)% Impact on CAGR Forecast | Geographic Relevance | Impact Timeline |
|---|---|---|---|
| Increasing obesity and diabetes drive demand for sugar reduction and alternatives | +0.8% | National, with acute prevalence in Southern and Midwestern states | Medium term (2-4 years) |
| Health awareness and label scrutiny promote low-calorie and better-for-you reformulations | +0.6% | National, urban clusters lead adoption | Short term (≤ 2 years) |
| Expansion of reduced-sugar and sugar-free products in beverages, bakery, confectionery, and dairy | +0.5% | National, beverage-heavy in West Coast and Northeast | Short term (≤ 2 years) |
| Innovations in high-intensity and natural sweeteners enhance taste and functionality | +0.4% | National, R&D hubs in Illinois, California, New Jersey | Medium term (2-4 years) |
| Technological advancements minimize off-tastes and bitterness in sweetener formulations | +0.3% | National, premium segments in coastal metros | Long term (≥ 4 years) |
| Clean-label trends boost demand for plant-based and minimally processed sweeteners | +0.2% | National, strongest in organic retail channels | Medium term (2-4 years) |
| Source: Mordor Intelligence | |||
Increasing obesity and diabetes in the United States drive demand for sugar reduction and alternatives
Adult obesity prevalence reached 40.3% during the 2021-2023 National Health and Nutrition Examination Survey (NHANES) cycle, with 23 states reporting rates at or above 35% in 2024. This widespread public health issue has a direct impact on sweetener demand: 38.4 million Americans are currently living with diabetes, while an additional 97.6 million individuals have prediabetes. Together, these conditions contribute to an economic burden of USD 413 billion annually in medical expenses and lost productivity [1]Source: National Center for Health Statistics, “Obesity and Severe Obesity Prevalence in Adults: United States, August 2021–August 2023,” cdc.gov. This significant financial strain has prompted payers, employers, and policymakers to actively support sugar-reduction initiatives, fostering a regulatory environment that is increasingly favorable for alternative sweeteners. Additionally, the growing use of glucagon-like peptide-1 (GLP-1) receptor agonist medications, such as semaglutide and tirzepatide, has introduced another dynamic. Users of these medications have been observed to reduce their spending on sweet baked goods by approximately 10% within six months, indicating a behavioral shift that further erodes baseline demand. As a result, product formulators are now tasked with addressing a dual challenge: replacing sugar to align with health guidelines while simultaneously creating products that remain appealing to consumers whose taste preferences are being influenced by these medications.
Health awareness and label scrutiny promote low-calorie and "better-for-you" sweetener reformulations
Label literacy has reached a critical juncture: 66% of Americans actively limited their sugar intake in 2024, an increase from 61% in the previous year. Among these consumers, 60% specifically targeted added sugars rather than naturally occurring sugars [2]Source: International Food Information Council, “Public Perceptions of Dietary Sweeteners,” ific.org. This heightened awareness is compelling brands to reformulate their products or risk becoming obsolete on store shelves. PepsiCo surpassed its 2025 target a year early, achieving 67% of its beverage volume meeting the less than or equal to 100 calories per 12-ounce threshold in 2024. Similarly, Coca-Cola reported that 30% of its global beverage volume now consists of low-calorie or no-calorie options, alongside the launch of 250 reduced-sugar products in 2024. However, a paradox remains: only 16% of sugar-limiting consumers prefer low-calorie sweeteners, while 30% still favor traditional sugars despite associated health concerns. This gap between consumer preferences and behavior underscores that taste and texture continue to be decisive factors for market success. It also highlights the strategic importance of next-generation sweeteners that replicate sucrose-like sensory profiles without the added caloric content.
Expansion of reduced-sugar and sugar-free products in beverages, bakery, confectionery, and dairy
Beverage reformulation continues to lead the market, while bakery and confectionery applications are steadily advancing. Kraft Heinz has committed to reducing 60 million pounds of sugar by the year 2025, with a notable achievement of removing 2.9 million pounds from its Brazil portfolio by 2024. Nestlé USA has taken significant steps by eliminating high-fructose corn syrup (HFCS) from more than 60 beverage recipes. Additionally, the company has introduced a proprietary sugar-restructuring technology that can achieve up to a 40% reduction in sugar content without compromising the taste of its products. Capri Sun has also made strides by reformulating its core juice drinks with monk fruit concentrate, resulting in an approximate 40% reduction in sugar content. These efforts underscore a strategic focus on capturing consumer loyalty early in the market. However, the competitive advantage for early adopters is narrowing as ingredient suppliers increasingly democratize access to innovative sweeteners through co-manufacturing partnerships and white-label solutions.
Innovations in high-intensity and natural sweeteners enhance taste and functionality
The United States Food and Drug Administration (FDA) issued no-objection letters for enzyme-modified steviol glycosides developed by Tate & Lyle in October 2024, as well as brazzein preparations from Oobli and Nanjing Bestzyme in 2025. This development highlights that natural high-intensity sweeteners can now achieve Generally Recognized as Safe (GRAS) approval within a reduced timeframe of under 24 months [3]Source: United States Food & Drug Administration,“GRAS Notice GRN 1140 Agency Response Letter,” fda.gov. Tate & Lyle's enzyme-modified stevia offers sweetness levels that are 200 to 300 times greater than sucrose while significantly reducing bitterness, effectively addressing a primary consumer concern associated with first-generation stevia extracts. Brazzein, a protein sourced from the West African Oubli fruit, provides heat stability and a clean sweetness profile, making it a practical option for applications such as baked goods and retorted dairy products where artificial sweeteners like aspartame and sucralose tend to degrade. Furthermore, allulose, a rare sugar that mimics the taste of sucrose but contains 90 percent fewer calories, received expanded use approvals from the FDA in 2024, with Tate & Lyle now producing it on a commercial scale. These regulatory advancements have significantly reduced the time required to bring innovative formulations to market, enabling brands to transition from artificial to natural sweeteners without compromising on taste or shelf life.
Restraints Impact Analysis*
| Restraint | (~)% Impact on CAGR Forecast | Geographic Relevance | Impact Timeline |
|---|---|---|---|
| Stringent FDA regulations and GRAS approval processes delay novel sweeteners' market entry | -0.4% | National, affects all manufacturers seeking new ingredient approvals | Long term (≥ 4 years) |
| Complex United States labeling rules increase compliance costs and reformulation challenges | -0.3% | National, disproportionate burden on small and mid-sized manufacturers | Medium term (2-4 years) |
| Taste issues of low-calorie sweeteners limit their application in certain products | -0.3% | National, most acute in bakery, confectionery, and full-flavor beverage segments | Short term (≤ 2 years) |
| Technical difficulties in replicating sugar's properties require multi-ingredient solutions in bakery and confectionery | -0.2% | National, concentrated in artisanal bakery and premium confectionery | Medium term (2-4 years) |
| Source: Mordor Intelligence | |||
Stringent Food and Drug Administration (FDA) regulations and Generally Recognized as Safe (GRAS) approval processes delay novel sweeteners' market entry
The United States Food and Drug Administration's (FDA) Generally Recognized as Safe (GRAS) notification pathway requires the submission of detailed safety dossiers. These dossiers must include toxicology studies, assessments of metabolic fate, and exposure estimates. The preparation of such dossiers can cost between USD 500,000 and USD 2 million per ingredient and typically takes 18 to 36 months to complete. Once submitted, the FDA's stated 180-day review period often extends to 12 to 18 months if additional data is requested. For instance, Rebaudioside M (Reb M), a high-purity stevia glycoside, has been under FDA review since late 2024 (GRN 1184), delaying its commercial launch despite its widespread acceptance in other markets. This regulatory process tends to favor established companies such as Cargill and Tate & Lyle, which can spread compliance costs across their extensive global portfolios. In contrast, startups often face significant challenges due to limited financial resources, making it difficult to sustain the lengthy approval cycles. Furthermore, the January 2024 ban on Red Dye Number 3, which affects approximately 9,200 products, underscores how sudden regulatory changes can lead to significant reformulation costs. Such developments further discourage investment in innovative ingredients with uncertain approval timelines.
Complex United States labeling rules increase compliance costs and reformulation challenges
The FDA's updated Nutrition Facts label, which separates added sugars from total sugars, compels brands to reformulate their products to avoid potential consumer backlash. Products containing more than 10% of the Daily Value for added sugars per serving are now subject to increased scrutiny. To meet these requirements, manufacturers are incorporating sugar alcohols, such as sorbitol and xylitol, and high-intensity sweeteners to remain within the acceptable limits. However, sugar alcohols present their own labeling challenges: erythritol and xylitol can be excluded from total carbohydrate counts under specific conditions, whereas sorbitol and maltitol cannot, leading to formulation inconsistencies that benefit certain polyols. At the same time, state-level regulations introduce additional compliance complexities. For example, California's Proposition 65, officially known as the Safe Drinking Water and Toxic Enforcement Act of 1986, requires warning labels for products containing substances associated with cancer or reproductive harm. Furthermore, some artificial sweeteners are under review for potential inclusion on this list. These overlapping regulatory requirements significantly increase reformulation costs by 15-25% compared to markets governed by a single jurisdiction. This financial burden is particularly challenging for mid-sized manufacturers, which often lack the resources or dedicated regulatory affairs teams to navigate these multifaceted compliance demands.
*Our forecasts treat driver/restraint impacts as directional, not additive. The impact forecasts reflect baseline growth, mix effects, and variable interactions.
Segment Analysis
By Product Type: Sucrose Anchors Value, High-Intensity Sweeteners Lead Growth
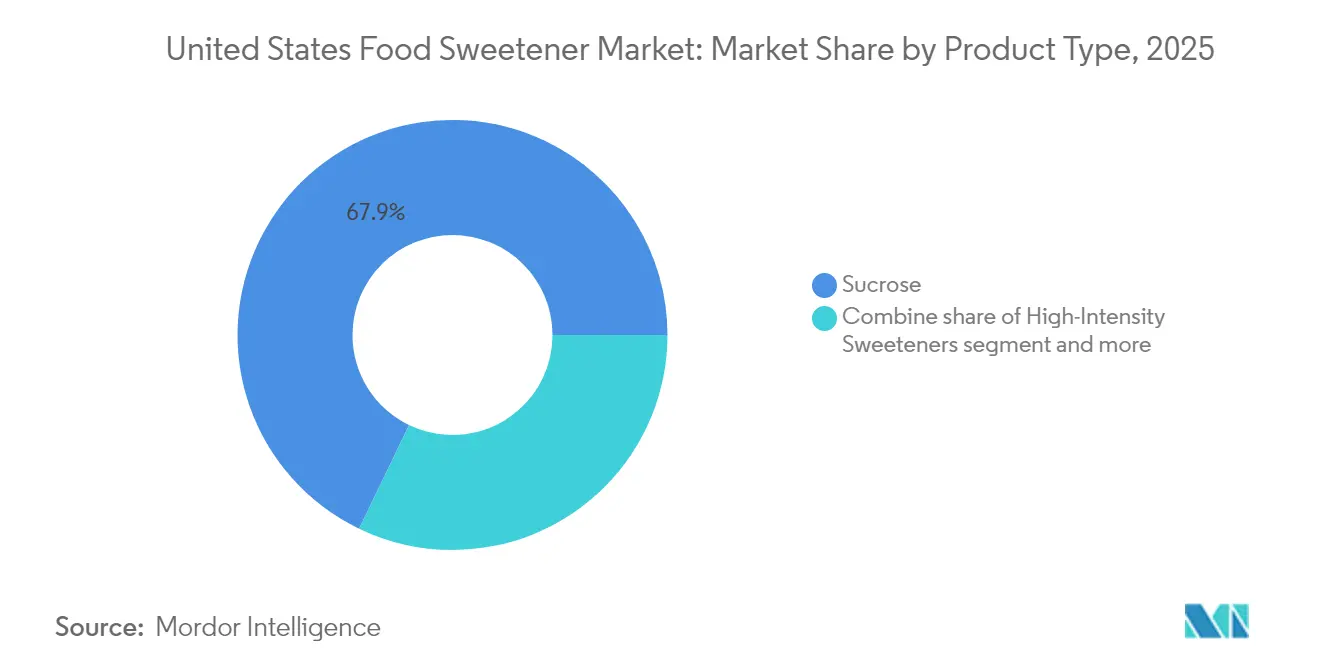
Sucrose accounted for 67.85% of the market share in 2025, maintaining its dominance due to its versatile functionality, including bulk, browning, moisture retention, and use as a fermentation substrate across bakery, confectionery, and dairy applications. However, high-intensity sweeteners are projected to grow at a compound annual growth rate (CAGR) of 3.84% from 2026 to 2031, marking the fastest growth among product types. This growth is driven by beverage reformulation efforts and regulatory initiatives aimed at reducing added sugars. Within the high-intensity sweeteners category, natural options such as stevia and monk fruit are increasingly replacing artificial alternatives like aspartame and sucralose, as clean-label requirements gain traction.
Stevia extract is now featured in over 14,000 global stock-keeping units (SKUs), with U.S. beverage brands accounting for 45% of its adoption. Monk fruit extract, while more expensive, offers a cleaner sweetness profile and has become the preferred choice for premium reformulations. For instance, Capri Sun achieved a 40% sugar reduction by utilizing monk fruit concentrate to maintain taste quality. Starch sweeteners and sugar alcohols serve as a middle-ground option, providing bulk and moderate sweetness at a lower cost compared to sucrose. Dextrose and high-fructose corn syrup (HFCS) continue to be widely used in processed foods, although HFCS faces reputational challenges. In 2024, Nestlé USA removed HFCS from over 60 beverage recipes.



By Application: Beverages Dominate, Bakery Accelerates
The beverages segment accounted for 44.55% of the application share in 2025, driven by its ability to reformulate products effectively. Liquid systems can incorporate high-intensity sweeteners without the textural challenges often encountered in solid foods. For instance, PepsiCo achieved 67% compliance with its target of less than 100 calories per 12-ounce serving, while Coca-Cola reported that 30% of its product volume consists of low- or no-calorie options. These achievements underscore the adaptability of beverage companies in addressing both regulatory requirements and evolving consumer preferences. The ability to pivot quickly has positioned the beverages segment as a leader in the adoption of alternative sweeteners.
However, the bakery and confectionery segment is projected to grow at the fastest rate of 3.61% during the forecast period of 2026 to 2031. This growth is attributed to manufacturers leveraging multi-ingredient sweetener systems to replicate the functional properties of sugar, such as bulk, browning, and moisture retention. Ingredients like allulose and erythritol have become integral to reduced-sugar cookie and cake formulations, offering Maillard browning and crumb structure improvements that earlier generations of polyols could not achieve. Meanwhile, dairy and desserts represent a high-value application area where sweeteners must withstand processes like pasteurization, homogenization, and cold-chain distribution. Brazzein, a protein-based sweetener known for its heat stability, has emerged as a viable option for retorted dairy products, a niche where artificial sweeteners like aspartame and sucralose often degrade under high temperatures.
By Form: Powder Leads, Liquid Gains on Dosing Precision
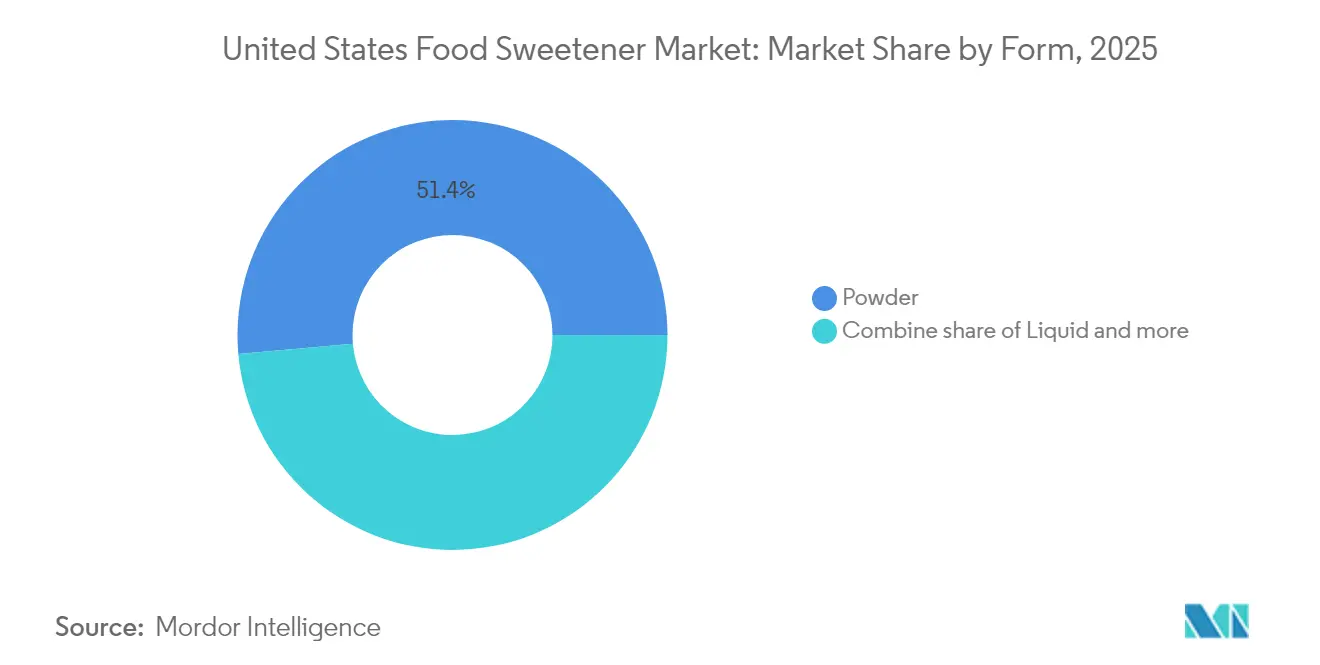
Powder formats accounted for a 51.40% market share in 2025, primarily due to their stability, ease of transport, and compatibility with dry-mix applications such as baking mixes, protein powders, and instant beverages. Spray-dried stevia and monk fruit extracts are the leading options within the natural high-intensity sweetener segment, while crystalline sucrose and dextrose continue to dominate traditional sweetener volumes. These powder formats are particularly favored in industries where long shelf life and ease of handling are critical factors.
In contrast, liquid sweeteners are expected to grow at a compound annual growth rate (CAGR) of 3.75% during the forecast period from 2026 to 2031. This growth is largely attributed to their increasing adoption in beverage production lines, where they offer significant advantages in precise dosing. Liquid high-fructose corn syrup (HFCS) and invert sugar syrups facilitate automated blending processes at high throughput levels, which helps reduce labor costs and ensures consistency by minimizing batch-to-batch variability. Additionally, liquid stevia extracts, despite being more expensive than their powdered counterparts, eliminate the need for a dissolution step and help reduce foam formation in carbonated beverages, making them a preferred choice in specific applications.
By Category: Conventional Dominates, Organic Gains on Clean-Label Momentum
Conventional sweeteners accounted for 82.35% of the market share in 2025, driven by their cost advantages and the presence of well-established supply chains. Organic sweeteners, on the other hand, are expected to grow at a compound annual growth rate (CAGR) of 3.65% during the forecast period from 2026 to 2031. This growth is primarily attributed to their clean-label positioning, which appeals to health-conscious consumers, and the willingness of customers to pay premium prices for natural and organic products. The organic sweeteners segment is anchored by products such as organic cane sugar, organic agave syrup, and organic stevia extract. Retailers like Whole Foods, Sprouts, and Trader Joe's play a pivotal role in driving the distribution of these products, ensuring their availability to a broader consumer base.
To achieve organic certification, manufacturers must adhere to the standards set by the United States Department of Agriculture (USDA) National Organic Program. These standards strictly prohibit the use of synthetic pesticides and genetically modified organisms (GMOs) and require third-party verification to ensure compliance. While these requirements increase ingredient costs by approximately 20 to 40 percent, they also enable brands to charge retail premiums ranging from 30 to 50 percent. This pricing strategy makes organic sweeteners a profitable option for businesses despite the higher input costs. In contrast, conventional sweeteners benefit significantly from economies of scale. Companies such as Cargill and Archer Daniels Midland (ADM) operate integrated corn wet-milling facilities that produce high-fructose corn syrup (HFCS), dextrose, and corn oil. These facilities allow fixed costs to be distributed across multiple revenue streams, enhancing cost efficiency and profitability.
Geography Analysis
The United States constitutes the entirety of the analyzed market, with regional demand influenced by obesity prevalence, regulatory measures, and retail channel dynamics. Southern and Midwestern states report the highest adult obesity rates, with 23 states recording a prevalence of 35 percent or higher in 2024. This has driven significant demand for sugar-reduction solutions in these regions. Coastal metropolitan areas, including New York, Los Angeles, San Francisco, and Seattle, lead in clean-label adoption. Natural and organic sweeteners account for 15 to 20 percent of sales in Whole Foods and specialty retailers, compared to 5 to 8 percent in Walmart and dollar stores. This disparity reflects income and education differences, as households earning over 100,000 United States Dollars (USD) annually are 2.5 times more likely to purchase organic sweeteners than those earning less than 50,000 USD.
Beverage reformulation is a key driver of volume growth in the West Coast and Northeast, where state-level soda taxes and school-district procurement policies favor low-calorie options. States such as California, Oregon, and Washington, along with several Northeastern cities, impose excise taxes on sugar-sweetened beverages. These taxes encourage manufacturers to use high-intensity sweeteners to avoid these levies. For instance, PepsiCo's acquisition of Poppi, a prebiotic soda brand valued at 1.95 billion USD, highlights this trend. Poppi contains 5 grams of sugar per can compared to 39 grams in regular Pepsi, positioning the company to attract health-conscious consumers in high-tax regions. In contrast, the Midwest and South show slower adoption of reformulated beverages, with traditional full-sugar sodas and sweet tea maintaining a dominant share in convenience and grocery channels.Regulatory measures vary significantly across states and municipalities. For example, New York City's menu-labeling requirements for chain restaurants mandate calorie counts for all menu items, accelerating reformulation efforts in foodservice sweetener applications. Similarly, California's Proposition 65, which requires warning labels for products containing substances linked to cancer or reproductive harm, has led some manufacturers to proactively remove controversial artificial sweeteners from their West Coast product lines. These localized regulations fragment the national market, compelling large manufacturers to either maintain region-specific formulations or adopt the most stringent standards nationwide to streamline supply chains.
Regulatory Landscape
Food sweeteners in the United States are primarily governed by the US Food and Drug Administration (FDA) under the Federal Food, Drug, and Cosmetic Act, either through food additive approvals or via the Generally Recognized as Safe (GRAS) pathway. The FDA maintains and updates the GRAS Notice Inventory, which is a key reference point for ingredient suppliers and brand owners assessing regulatory status and prior agency responses for high-intensity sweeteners.
Recent actions include FDA no-objection letters for enzyme-modified steviol glycosides (October 2024) and brazzein preparations (2025), which helped accelerate commercialization for some natural high-intensity sweeteners. Comprehensive policy discussions around tightening oversight of self-affirmed GRAS determinations and proposals to require greater transparency are shaping regulatory readiness for established players and startups.
Competitive Landscape
The United States food sweetener market demonstrates moderate concentration, with companies such as Cargill, Archer Daniels Midland, Tate & Lyle, and Ingredion dominating through integrated corn-wet-milling and stevia-extraction assets, which provide scale advantages in commodity segments. However, the high-intensity natural sweetener segment remains fragmented, with specialty suppliers like PureCircle (now part of Ingredion), Sweet Green Fields, GLG Life Tech, and Whole Earth Brands competing through proprietary extraction and purification technologies.
Vertical integration is a key strategy for incumbents. For instance, Cargill manages seed-to-sweetener stevia supply chains in Kenya and Paraguay, ensuring quality control and cost predictability. Similarly, Tate & Lyle's enzyme-modified steviol glycoside platform, which received Food and Drug Administration (FDA) Generally Recognized as Safe (GRAS) approval in October 2024, highlights how established players utilize research and development capabilities to differentiate commodity inputs.
Emerging opportunities in the market focus on rare sugars and precision fermentation platforms. Bonumose, for example, produces tagatose, a low-glycemic sugar with prebiotic properties, through enzymatic isomerization, targeting diabetic-friendly and gut-health applications. Manus Bio employs synthetic biology to ferment allulose and other rare sugars at purities exceeding 99 percent, addressing the off-flavors associated with earlier enzymatic processes. While these startups face challenges such as high capital requirements and regulatory hurdles, successful GRAS approvals could unlock USD 50 to 100 million in early-stage revenue before larger incumbents replicate their technologies.
United States Food Sweetener Industry Leaders
Cargill, Incorporated
Archer Daniels Midland Company
Ingredion Incorporated
Tate & Lyle PLC
ASR Group International, Inc.
- *Disclaimer: Major Players sorted in no particular order


Market Opportunities and Future Outlook
The near-term whitespace remains in reformulation toolkits and next-generation sweetness systems that reduce added sugar while maintaining sugar-like functionality in challenging applications such as bakery, confectionery, and dairy. FDA enforcement discretion in April 2026 to exclude D-tagatose from Nutrition Facts label declarations of added and total sugars supports broader use of certain rare sugars in reduced-sugar positioning, complementing the market shift toward multi-ingredient blends (for example, allulose plus polyols) already used to replicate bulk and browning.
Supplier investments and new GRAS clearances are expanding the commercialization runway for differentiated sweeteners and integrated solutions. ADM completed a USD 26 million investment in January 2026 at its Erlanger, Kentucky flavors facility to strengthen capabilities tied to reformulation demand, while Amai Proteins received an FDA no-questions-asked GRAS notice in February 2026 for its precision-fermented sweet protein (Sweelin, GRN 1269), enabling US commercialization of sweet-protein systems. On the supply side of conventional sweeteners, large modernization programs such as ASR Group commencing construction in May 2026 on a USD 785 million multi-phase expansion at its Chalmette, Louisiana refinery underscore continued capacity and efficiency moves in sugar even as brands pursue reduced-sugar portfolios.
Recent Industry Developments
- June 2026: ADM highlighted its sugar-reduction framework and introduced SweetRight Stevia Echo, a bioconversion-based stevia sweetener. The announcement signals ongoing supplier-driven innovation in stevia-based formulations and positions ADM to support reduced-sugar portfolios in multiple beverage and food categories.
- February 2025: Ingredion announced a partnership with Oobli to advance sweet protein systems. The collaboration expands the use of Oobli sweet proteins within Ingredion's broader portfolio, enabling new taste profiles and lower-sugar claims.
- April 2024: Ingredion launched PURECIRCLE Clean Taste Solubility Solution (CTSS), a stevia solution designed for significantly higher solubility. Improved solubility and cleaner taste broaden stevia usability in beverages and other applications where dissolution and flavor carry have been limiting factors.


Research Methodology Framework and Report Scope
Market Definition and Coverage
For this study, the US food sweetener market is defined as the value of sweetening ingredients sold for use in food and beverage manufacturing. This includes both caloric sweeteners and high-intensity sweeteners, tracked across common industrial formats used by processors.
Scope exclusions: We exclude upstream crops and raw inputs before sweetener processing, and we also exclude non-food uses such as pharmaceutical-only applications where they fall outside typical food and beverage formulations.
Segmentation Overview
- By Product Type
- Sucrose
- Starch Sweeteners and Sugar Alcohols
- Dextrose
- High Fructose Corn Syrup (HFCS)
- Maltodextrin
- Sorbitol
- Xylitol
- Other Starch Sweeteners and Sugar Alcohols
- High-Intensity Sweeteners
- Artificial High-Intensity Sweeteners
- Sucralose
- Aspartame
- Saccharin
- Neotame
- Cyclamate
- Acesulfame Potassium (Ace-K)
- Other Artificial HIS
- Natural High-Intensity Sweeteners
- Stevia Extract
- Monk Fruit Extract
- Other Natural HIS
- Artificial High-Intensity Sweeteners
- Other Sweeteners
- By Application
- Bakery and Confectionery
- Dairy and Desserts
- Beverages
- Soups, Sauces, and Dressings
- Other Applications
- By Form
- Powder
- Liquid
- Crystal
- By Category
- Conventional
- Organic
Data Sources, Market Sizing, and Validation
Desk Research
Desk research was used to set guardrails for the model and to ensure assumptions were tied to measurable US supply and demand signals. We referenced public statistics and technical notes from sources such as the USDA (including ERS and FAS), the US Census Bureau manufacturing and trade series, and FDA materials on labeling and ingredient use.
To translate these inputs into market sizing variables, we also reviewed open scientific literature (for sweetness intensity, use rates, and reformulation trends) and customs and tariff classification guidance that helps interpret import and export lines for key sweetener groups. In addition, we checked company annual reports, investor presentations, and reputable press coverage for capacity moves, pricing commentary, and product mix changes, then supplemented gaps using subscriptions focused on company financials and intelligence, news and financials, patents, and shipment-level trade flows. These desk sources are illustrative, since many other references were also used for data collection, validation, and clarification during the research process.
Primary Interviews and Surveys
Primary interviews and surveys were used to pressure-test demand shifts and pricing assumptions that desk sources cannot fully explain, especially where reformulation and clean-label preferences change the sweetener mix. We spoke with ingredient suppliers, distributors, and food and beverage formulators across the country, and then re-contact was done when an assumption materially moved the model output.
Survey inputs were mainly used to validate application-level use rates, typical contract pricing behavior, and the speed at which high-intensity sweeteners displace bulk sweeteners in specific categories.
Distribution of primary research fieldwork respondents
| Company type | Respondent position |
|---|---|
| Top tier: 39% | CXOs: 15% |
| Mid tier: 45% | Functional/Unit leaders: 30% |
| Smaller Players: 16% | Managers: 55% |
Market-Sizing & Forecasting
Sizing started with a top-down build that reconstructs the sweetener demand pool from US food and beverage production signals, trade flows for major sweetener groups, and mix-shift indicators across key applications. We then corroborated the totals with selective bottom-up checks, including sampled price bands by sweetener type multiplied by estimated consumption volumes, and supplier and channel feedback on share movement, before the final number was locked.
Inputs that materially shaped the model included food and beverage manufacturing output trends, sweetener import and export direction by major product families, relative pricing between bulk sweeteners and high-intensity sweeteners, reformulation activity tied to added-sugar reduction, and application-level substitution patterns (for example, beverages versus bakery where sweetness delivery differs). When a variable was not consistently available, gaps were handled by using conservative proxy series and then aligning them with interview-based ranges so the model stays reproducible.
For forecasting, scenario analysis was applied around a central case, since pricing, formulation timelines, and consumer preference shifts do not move in a straight line. Scenarios were anchored on expected changes in application demand, sweetener mix transition speed, and pricing progression by category, with expert feedback used to keep the assumptions realistic.
Data Validation & Update Cycle
Validation was done through triangulation of the model outputs against independent signals, such as implied per-capita sweetener use, trade direction consistency, and application-level consumption logic from industry conversations. Large variances were flagged, investigated, and recalculated when they were driven by a definitional mismatch, a unit conversion error, or an outlier price assumption.
Before sign-off, the model and narrative go through multi-step analyst review, and a re-contact trigger is used if a single assumption can move the market size meaningfully. Reports are refreshed annually, and interim updates are made for material events such as policy changes, major capacity additions, or sharp commodity-linked price swings. Right before delivery, a final pass is completed so clients receive the most current view available at that time.
Mordor Intelligence's US Food Sweetener Market Market Size Measured Against Other Published Estimates
Different sources often show different market values for US food sweeteners, even when they are discussing similar end uses, because the product basket and end-use inclusion rules are not the same. The year used, the pricing basis, and how quickly mix shifts are assumed to happen can also move the final number.
Some published figures focus only on sugar substitutes or only on nutritive sweeteners, which narrows the counted products and can also tilt the average price upward or downward. Other estimates extend the scope into personal care or supplements, and that usually changes the demand signals and how volumes are inferred. In Mordor Intelligence, the market is counted only when sweeteners are sold for food and beverage use across sucrose, starch sweeteners and sugar alcohols, and high-intensity sweeteners, and upstream crops and non-food demand are not added into the total.
Benchmark comparison
| Source | Market Size | Gaps in Research Methodology |
|---|---|---|
| Mordor Intelligence | USD 11.74 B (2025) | |
| Industry Research Firm A | USD 2.23 B (2024) | This figure is built around sugar substitutes, which is a narrower product set than total food sweeteners, and it can also include adjacent non-food uses like oral care or supplements, lowering comparability to a food-only sweetener total. |
| Industry Research Firm B | USD 8.65 B (2026) | This estimate is limited to nutritive (caloric) sweeteners like sucrose, fructose, glucose, and honey, and it excludes high-intensity sweeteners, which removes a meaningful value slice even if volumes are smaller. |
The spread across sources is explained mainly by what is counted as a sweetener market, and whether high-intensity and bulk sweeteners are combined in one number. By keeping the scope tied to food and beverage use and checking totals against production, trade, and application mix signals, the market size can be followed back to clear inputs and repeated each year with consistent steps.


Key Questions Answered in the Report
How big is the United States food sweetener market in 2026?
The United States food sweetener market size stands at USD 12.12 billion in 2026.
What is the expected growth rate for United States sweeteners through 2031?
Aggregate value is projected to grow at a 3.22% CAGR, reaching USD 14.19 billion by 2031.
Which sweetener segment is growing the fastest?
High-intensity sweeteners, especially natural stevia and monk fruit, are forecast to expand at 3.84% per year.
Why are bakery and confectionery applications accelerating?
Multi-ingredient blends such as allulose plus erythritol replicate sugar’s bulk and browning, enabling 3.61% CAGR in bakery and confectionery sales.
How are FDA approvals shaping innovation?
Recent GRAS clearances for enzyme-modified stevia and Brazzein cut the approval timeline to about two years, allowing quicker launch of clean-label high-intensity options.
Page last updated on:





