United States Mobile Application Market Size and Share
Market Overview
| Study Period | 2019 - 2030 |
|---|---|
| Forecast Data Period | 2025 - 2030 |
| Historical Data Period | 2019 - 2023 |
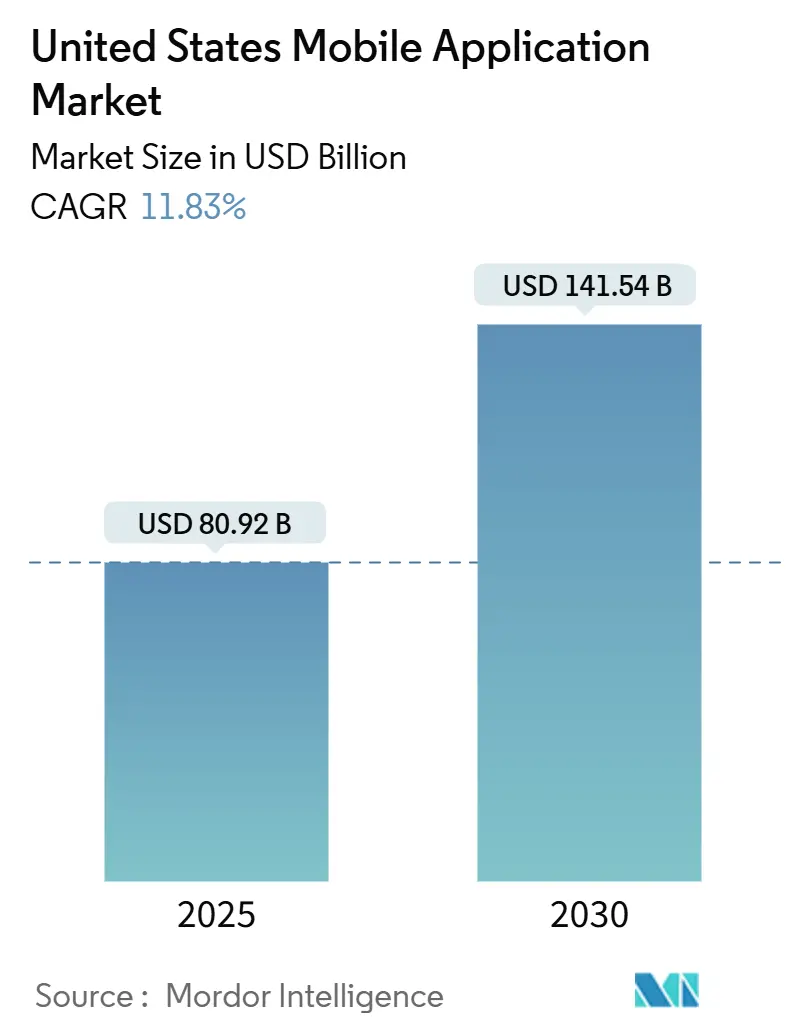
| Market Size (2025) | USD 80.92 Billion |
| Market Size (2030) | USD 141.54 Billion |
| Growth Rate (2025 - 2030) | 11.83% CAGR |
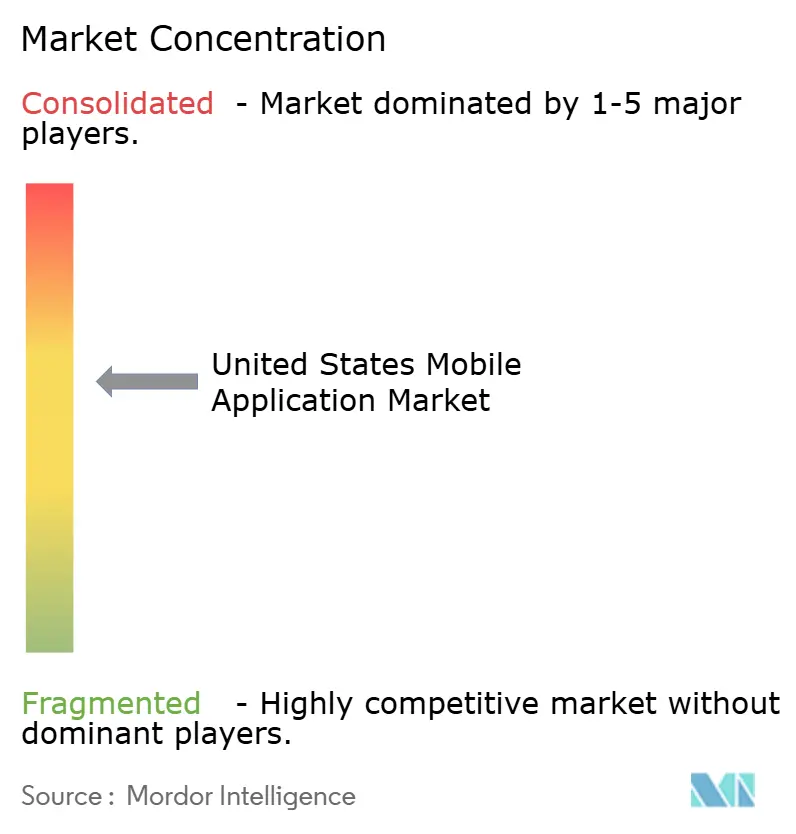
| Market Concentration | Medium |
Major Players *Disclaimer: Major Players sorted in no particular order Image © Mordor Intelligence. Reuse requires attribution under CC BY 4.0. | |
United States Mobile Application Market Analysis by Mordor Intelligence
The United States mobile application market size stands at USD 80.92 billion in 2025 and is projected to climb to USD 141.54 billion by 2030, reflecting an 11.83% CAGR for the forecast period. Continuous 5G roll-out, rapid integration of generative artificial intelligence, and deliberate shifts toward subscription models keep the United States mobile application market on a sustained growth path. User spending rises as richer in-app experiences emerge from high-bandwidth networks, while developers leverage cloud economies and cross-platform toolkits to shorten release cycles. Platform regulation remains an omnipresent force, shaping privacy rules, payment policies, and antitrust outcomes that redefine how value is shared between storefronts and publishers. Competitive strategies now focus less on raw downloads and more on building lifetime engagement through retention-first design, ethical data practices, and personalized feature roadmaps. Ecosystem expansion also favors niche specialists who pair deep domain knowledge-such as digital health or enterprise collaboration-with swift compliance to evolving federal and state standards.
Key Report Takeaways
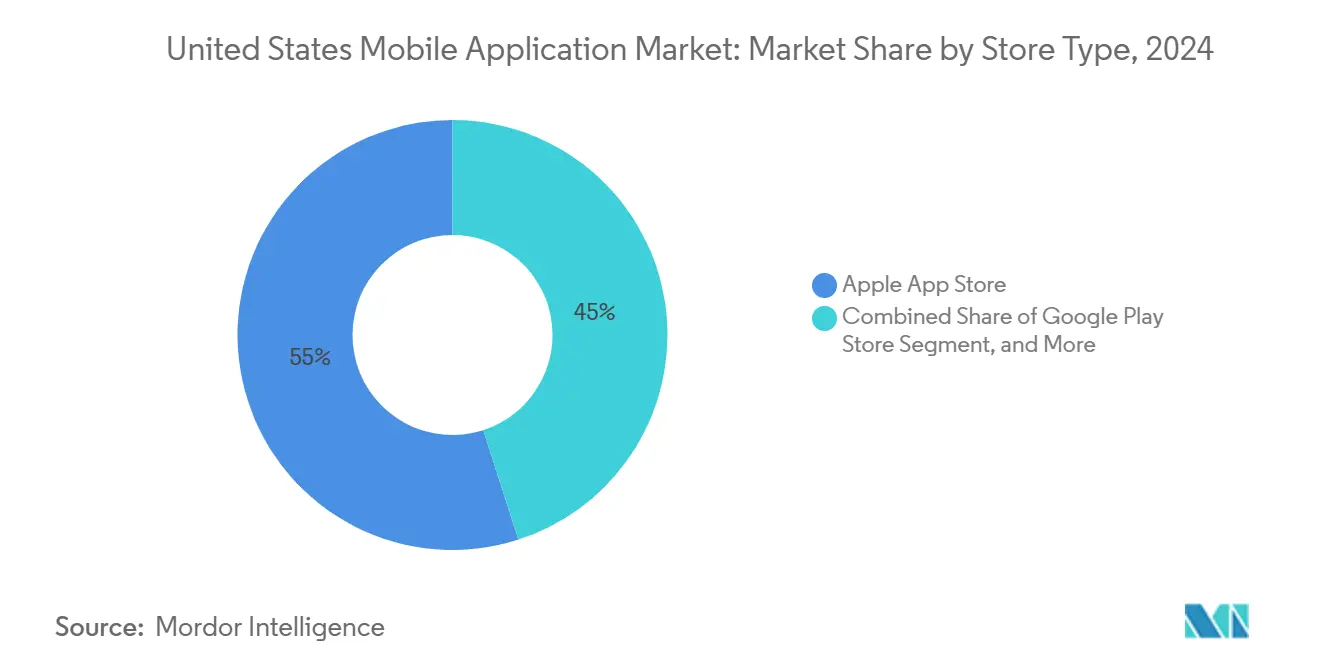
- By store type, the apple app store led with 54.97% revenue share of the United States mobile application market in 2024; Progressive Web Apps are advancing at a 12.09% CAGR through 2030.
- By application category, gaming commanded a 35.89% share of the United States mobile application market size in 2024, while health and fitness is projected to progress at a 13.22% CAGR through 2030.
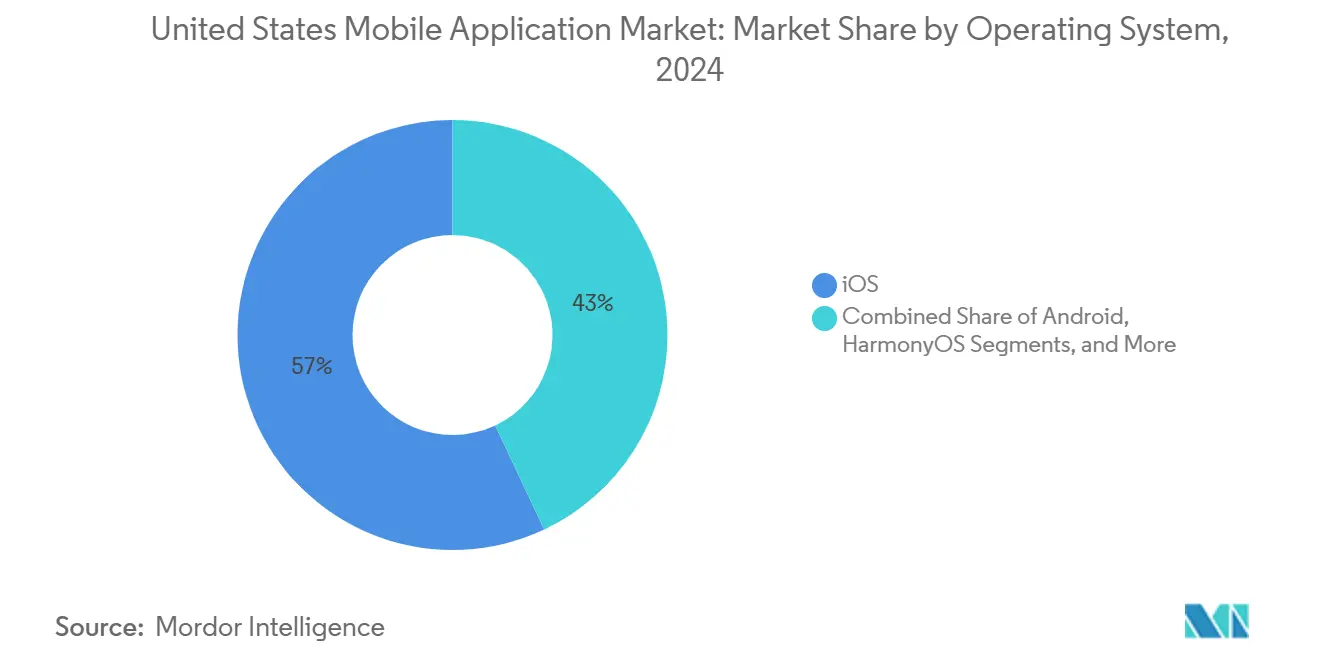
- By operating system, iOS captured 57.01% of the United States' mobile application market share in 2024; HarmonyOS is poised for the fastest expansion, with a 12.46% CAGR to 2030.
- By monetization model, in-app purchases retained a 42.13% share of the United States mobile application market in 2024, whereas subscriptions are set to expand at a 13.18% CAGR between 2025-2030.
Worldwide, activity is shaped by contributions from multiple countries and regions, with United states representing one among them. The global report on mobile application market by Mordor Intelligence reflects how these countries and regional layers combine into a single system.
United States Mobile Application Market Trends and Insights
Drivers Impact Analysis*
| Driver | (~) % Impact on CAGR Forecast | Geographic Relevance | Impact Timeline |
|---|---|---|---|
| Rising 5G network penetration accelerating rich app experiences | +2.1% | National – early impact in major metro areas | Medium term (2-4 years) |
| Growing adoption of in-app subscriptions by media and productivity apps | +1.8% | National – strongest in high-income cohorts | Short term (≤ 2 years) |
| Expansion of mobile commerce among SMB retailers | +1.4% | National – higher uptake in urban centers | Medium term (2-4 years) |
| Integration of generative AI SDKs enabling novel app functionality | +2.3% | National – led by technology hubs | Short term (≤ 2 years) |
| Policy push for digital health apps by U.S. FDA and CMS | +1.6% | National – framework expansion | Long term (≥ 4 years) |
| Increasing corporate investment in employee mobile apps for remote workforce | +1.2% | National – knowledge-worker sectors | Medium term (2-4 years) |
| Source: Mordor Intelligence | |||
Rising 5G Network Penetration Accelerating Rich App Experiences
Commercial 5G coverage reached 325 million residents on T-Mobile’s network and 230 million residents on Verizon’s network by the end of 2024.[1]Verizon Communications, “Verizon 5G Ultra Wideband now available nationwide,” verizon.com The speed and latency uplift enables console-quality cloud gaming, augmented-reality shopping, and real-time collaboration suites that refresh the value proposition of the United States mobile application market. Developers redesign codebases to leverage rapid edge compute offload, while users enjoy uninterrupted multi-gigabit streaming in transit. In metropolitan corridors, early adopters are spending more time per session inside bandwidth-intensive apps, raising average revenue per user metrics for publishers. Infrastructure vendors are continuing fiber backhaul upgrades, which will extend these capabilities to suburban and rural clusters through 2026.
Integration of Generative AI SDKs Enabling Novel App Functionality
Apple’s 2024 partnership with OpenAI embedded ChatGPT capabilities directly into iOS frameworks, enabling even small studios to integrate contextual language, image, and voice generation within native workflows without incurring external call latency. Within months, productivity suites started offering AI-drafted emails, AI-curated task lists, and real-time summarization of meeting notes. Creative tools now deliver automated photo retouching and music composition, while healthcare apps incorporate symptom triage chatbots that support clinicians with regulation-compliant guardrails. These enhancements heighten stickiness and lower churn, thereby reinforcing the viability of subscriptions across the United States mobile application market.
Growing Adoption of In-App Subscriptions by Media and Productivity Apps
Quarter-on-quarter subscription revenue grew 19% in early 2024 as publishers sought stable cash flows amid higher user acquisition costs. Streaming leaders such as Netflix and Disney+ refined tiered pricing strategies that push incremental upgrades, while productivity brands rolled continuous update roadmaps that justify recurring fees. Subscribers who perceive evolving value tend to stay engaged longer, thereby increasing their lifetime value, even when monthly churn rates hover below 5%. Advanced telemetry pinpoints renewal risk windows, enabling timely retention campaigns that counteract privacy-driven ad attribution gaps.
Policy Push for Digital Health Apps by U.S. FDA and CMS
The FDA cleared 192 prescription digital therapeutics by late 2024, including Rejoyn for major depressive disorder . CMS pilot programs simultaneously enlarged reimbursement eligibility for remote monitoring solutions, validating commercial pathways for clinically proven mobile interventions. Developers meeting evidentiary standards gain privileged market access while late adopters face steeper compliance costs. Hospitals and insurers increasingly integrate approved apps into care plans, which broadens comorbidity management and chronic-condition support. These developments cement healthcare as one of the fastest-growing opportunity pools inside the United States mobile application market.
Restraints Impact Analysis*
| Restraint | (~) % Impact on CAGR Forecast | Geographic Relevance | Impact Timeline |
|---|---|---|---|
| Intensifying platform privacy restrictions limiting targeted advertising revenue | -1.9% | National – sharper hit on iOS ecosystem | Short term (≤ 2 years) |
| Rising user acquisition costs due to saturation | -1.5% | National – acute in competitive categories | Medium term (2-4 years) |
| App Store commission controversies and legal uncertainty | -1.3% | National – platform-dependent developers | Medium term (2-4 years) |
| Increasing cybersecurity and data compliance costs for developers | -1.1% | National – data-intensive apps | Long term (≥ 4 years) |
| Source: Mordor Intelligence | |||
Intensifying Platform Privacy Restrictions Limiting Targeted Advertising Revenue
Apple’s App Tracking Transparency policy dropped global opt-in rates to roughly 25%, eroding campaign precision and reducing ad-funded revenue for many publishers.[2]Apple Inc., “Introducing Apple Intelligence for iPhone, iPad, and Mac,” apple.com Google’s impending Privacy Sandbox for Android is scheduled to replicate similar signal loss by 2025. Together, these changes reduce performance marketing conversions by 15-20%, prompting studios to shift their focus toward first-party data capture, contextual ads, or paid content models. Compliance with the California Consumer Privacy Act and emerging state regulations further raises legal-ops overhead, straining smaller teams within the United States mobile application market.
Rising User Acquisition Costs Due to Saturation
Average acquisition cost climbed to USD 29.12 on iOS and USD 21.74 on Android in 2024, a 40% escalation versus 2022 benchmarks. Fierce bidding for premium inventory amid more than 5.7 million combined apps sharply widens payback cycles, now frequently stretching beyond six months. Only studios with deep war-chests can sustain front-loaded spend, so capital-lite developers shift focus to organic community engagement, referral rewards, and cross-promotion inside portfolio titles. The economics favor incumbents and feed consolidation waves, thereby impacting diversity within the United States mobile application market.
*Our forecasts treat driver/restraint impacts as directional, not additive. The impact forecasts reflect baseline growth, mix effects, and variable interactions.
Segment Analysis
By Store Type: Platform Wars Drive Distribution Innovation
Revenue leadership remained with the curated Apple App Store, which held a 54.97% share of the United States mobile application market in 2024 on the strength of integrated payments and high-spend demographics. Progressive Web Apps, however, are tracking a 12.09% CAGR as enterprise teams prefer platform-agnostic deployment routes that avoid commission fees and accelerate update cycles.
Developers increasingly ship dual versions-native for discoverability and PWA for direct engagement-creating a blended distribution matrix that lessens dependency on dominant storefronts. Google has responded by tightening PWA integration within Android 15, while Apple has softened fee schedules for studios with budgets under USD 1 million.[3]Google Developers, “Progressive Web Apps,” web.dev These moves underscore how distribution choice has become a strategic lever for monetization optimization inside the United States mobile application market.


By Application Category: Gaming Dominance Faces Health Innovation
Gaming retained a 35.89% category share, generating the bulk of in-app purchase revenue through live ops content drops and social competition loops. Health and fitness applications, meanwhile, show the highest advancement, with a 13.22% CAGR, as clinically validated digital therapeutics go mainstream.
The market’s pivot toward wellness pairs sensor-rich smartphones with AI-driven coaching, helping users manage sleep, stress, and chronic conditions. The FDA now rewards evidence-based outcomes, so venture capital flows toward regulated offerings that command premium reimbursements. This dynamism widens the addressable base and recasts user spending patterns in the United States mobile application market.
By Operating System: iOS Premium Positioning Versus Android Scale
Apple’s iOS accounted for 57.01% of 2024 gross revenues, driven by affluent audiences and higher average spend per download. Android’s sheer install base ensures volume leadership, though lower monetization coefficients persist. Huawei’s HarmonyOS is scaling at a 12.46% CAGR on geopolitical tailwinds and hardware bundling efforts, adding competitive texture domestically.
Cross-platform frameworks, such as Flutter and React Native, are gaining market share because publishers want fewer code branches and faster release velocity. These efficiencies help mid-tier firms fund marketing in the United States mobile application market while maintaining feature parity across ecosystems.
By Monetization Model: Subscription Economy Gains Momentum
In-app purchases controlled 42.13% market share after years of refinement in gaming psychology and impulse-driven cosmetics. Subscriptions, however, are expanding at a 13.18% CAGR as streaming, productivity, and health platforms chase steady cash flow and predictable valuation metrics.
Financial modeling now emphasizes renewal probability over one-off sale volume, nudging product teams to invest in ongoing content and smart notifications that reinforce daily habit loops. Hybrid strategies-free entry plus optional membership tiers-elevate lifetime value without scaring away price-sensitive cohorts, cementing a central role for recurring billing inside the United States mobile application market.
Geography Analysis
California retains the highest developer density and spending per capita, anchored by Silicon Valley’s venture ecosystem and marquee platform headquarters. New York and Texas follow, each hosting vibrant fintech and retail technology clusters that localize feature roadmaps for regional use cases.
State privacy acts emanating from California are setting national precedents, prompting multi-state compliance toolkits that bake regulation readiness into build pipelines. Rural broadband upgrades supported by federal infrastructure funding are unlocking fresh adoption waves, especially among remote workers relocating outside tier-one cities.
Pre-eminent academic centers in Boston, Austin, and Seattle collaborate with industry on AR, AI, and health studies that spin out venture-backed startups. This intellectual capital cycle fuels next-generation app concepts, reinforcing geographic pockets of innovation within the United States mobile application market.
Competitive Landscape
Apple and Google control core distribution rails, exposing third-party developers to shifting fee structures and ranking algorithms that influence revenue visibility. Meta invests in immersive content and ad stack enhancements, battling privacy headwinds while funneling cash into VR and AR laboratories. Microsoft’s 2024 acquisition of Activision Blizzard vaulted it into the mobile top-grossing charts, supplying proven franchises and sophisticated monetization engines.
Legal breakthroughs, highlighted by Epic Games’ push for alternative payments, are forcing storefronts to unbundle payment choice, potentially compressing commission take rates. Simultaneously, Progressive Web Apps offer a non-store path, prompting Apple and Google to elevate native capabilities in response.
Capital deployment remains brisk: technology majors have spent USD 300 billion on 814 startup acquisitions since 2000, positioning themselves ahead of emergent niches. The resulting concentration leaves long-tail developers reliant on platform goodwill or niche virality to secure a foothold inside the United States mobile application market.
United States Mobile Application Industry Leaders
Apple Inc.
Alphabet Inc.
Meta Platforms Inc.
Microsoft Corporation
Amazon.com Inc.
- *Disclaimer: Major Players sorted in no particular order

Recent Industry Developments
- May 2025: Aevice Health secured FDA clearance for AeviceMD, a wearable respiratory monitor that syncs with mobile apps to deliver continuous lung function data, broadening digital therapy options for chronic respiratory care.
- April 2025: Neuhealth Digital gained FDA authorization for the Neu Platform, an all-in-one digital mental health suite that pairs mobile apps with clinician support tools, marking a shift from single-condition therapeutics to integrated mental health management.
- April 2025: Dexcom introduced its G7 15 Day Continuous Glucose Monitoring System, featuring deeper mobile app connectivity, extended sensor wear time, and enhanced user experience for diabetes management, following FDA clearance.
- April 2025: WHOOP earned FDA clearance for ECG Feature 1.0, adding electrocardiogram capability to its fitness-centric wearable and mobile ecosystem, positioning the brand alongside leading consumer health devices.


United States Mobile Application Market Report Scope
| Google Play Store |
| Apple App Store |
| Third-Party Android Stores |
| Progressive Web Apps (PWAs) |
| Gaming |
| Social Networking and Communication |
| Entertainment and Media |
| Health and Fitness |
| Retail and E-Commerce |
| Travel and Hospitality |
| Education and Learning |
| Financial Services and FinTech |
| Other Application Categories |
| Android |
| iOS |
| HarmonyOS |
| Other Operating Systems |
| Paid Apps |
| In-App Purchase (IAP) |
| Subscription-Based |
| Advertising-Supported |
| By Store Type | Google Play Store |
| Apple App Store | |
| Third-Party Android Stores | |
| Progressive Web Apps (PWAs) | |
| By Application Category | Gaming |
| Social Networking and Communication | |
| Entertainment and Media | |
| Health and Fitness | |
| Retail and E-Commerce | |
| Travel and Hospitality | |
| Education and Learning | |
| Financial Services and FinTech | |
| Other Application Categories | |
| By Operating System | Android |
| iOS | |
| HarmonyOS | |
| Other Operating Systems | |
| By Monetization Model | Paid Apps |
| In-App Purchase (IAP) | |
| Subscription-Based | |
| Advertising-Supported |


Key Questions Answered in the Report
What is the current value of the United States mobile application market?
The United States mobile application market size is USD 80.92 billion in 2025.
How fast is user spending expected to grow?
User spending is projected to rise at an 11.83% CAGR, taking the market to USD 141.54 billion by 2030.
Which store type is expanding the quickest?
Progressive Web Apps record the fastest growth, advancing at a 12.09% CAGR due to commission-free deployment.
What monetization approach is gaining favor with publishers?
Subscription models are accelerating at a 13.18% CAGR as media, productivity, and health apps pursue recurring revenue.
How are privacy reforms affecting advertising income?
Opt-in tracking policies have lowered attribution accuracy by up to 20%, prompting many publishers to diversify away from pure advertising models.
Which application category shows the strongest future upside outside gaming?
Health and fitness apps, supported by FDA clearances and reimbursement pathways, are forecast to expand at a 13.22% CAGR through 2030.
Page last updated on:


