United States Telecom Services Market Size and Share
Market Overview
| Study Period | 2019 - 2030 |
|---|---|
| Forecast Data Period | 2025 - 2030 |
| Historical Data Period | 2019 - 2023 |
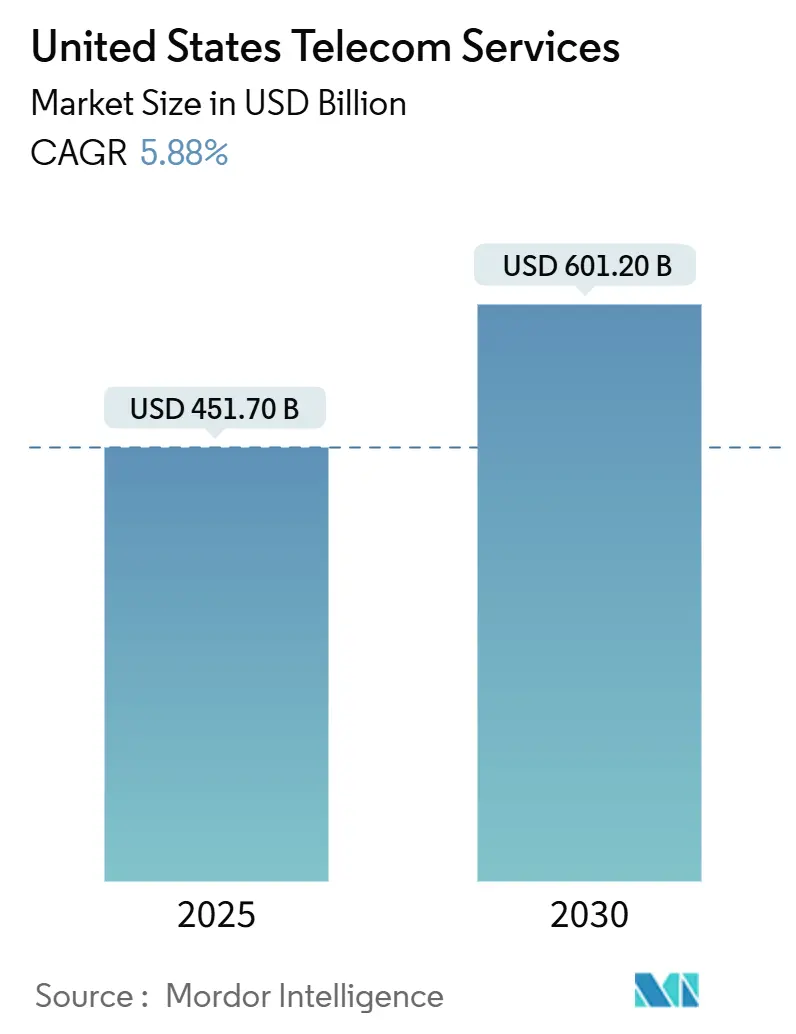
| Market Size (2025) | USD 451.70 Billion |
| Market Size (2030) | USD 601.20 Billion |
| Growth Rate (2025 - 2030) | 5.88% CAGR |
| Market Concentration | Medium |
Major Players *Disclaimer: Major Players sorted in no particular order Image © Mordor Intelligence. Reuse requires attribution under CC BY 4.0. | |
United States Telecom Services Market Analysis by Mordor Intelligence
The US telecom services market size stands at USD 451.7 billion in 2025 and is projected to reach USD 601.2 billion in 2030, advancing at a 5.88% CAGR. Strong momentum comes from nationwide 5G standalone rollouts, escalating demand for private cellular networks, and surging bandwidth needs from generative-AI data centers. Federal stimulus through the USD 42.45 billion BEAD program is accelerating fiber deployments, while spectrum-sharing frameworks such as CBRS and the 6 GHz band are lowering entry barriers for niche providers. Competitive boundaries among carriers, cable operators, hyperscalers, and satellite firms continue to blur as firms race to bundle wireline, wireless, and edge-cloud capabilities. Regulatory initiatives that curb junk fees and reinstate net-neutrality introduce cost pressures yet simultaneously foster consumer trust and long-term service uptake.
Key Report Takeaways
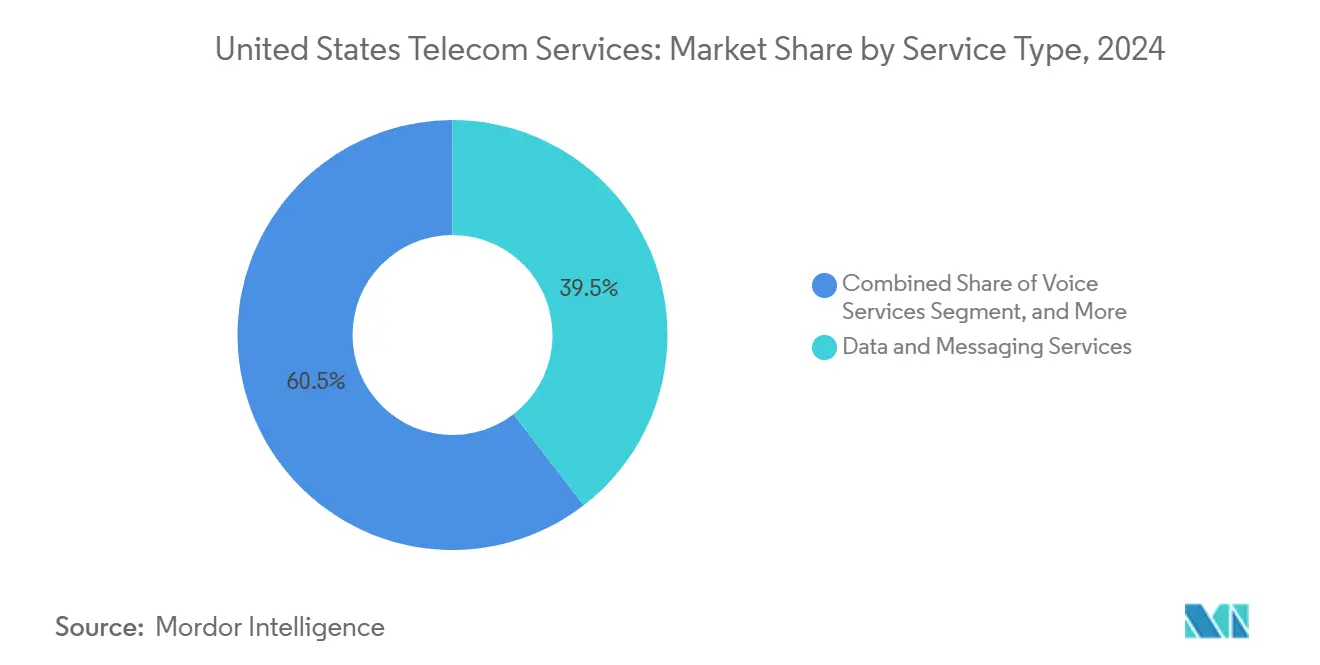
- By service type, data and messaging services led with 39.54% revenue share in 2024 and are projected to expand at an 8.67% CAGR through 2030.
- By transmission, wired infrastructure commanded 47.22% of the US telecom services market share in 2024 and is forecast to grow at a 6.02% CAGR to 2030.
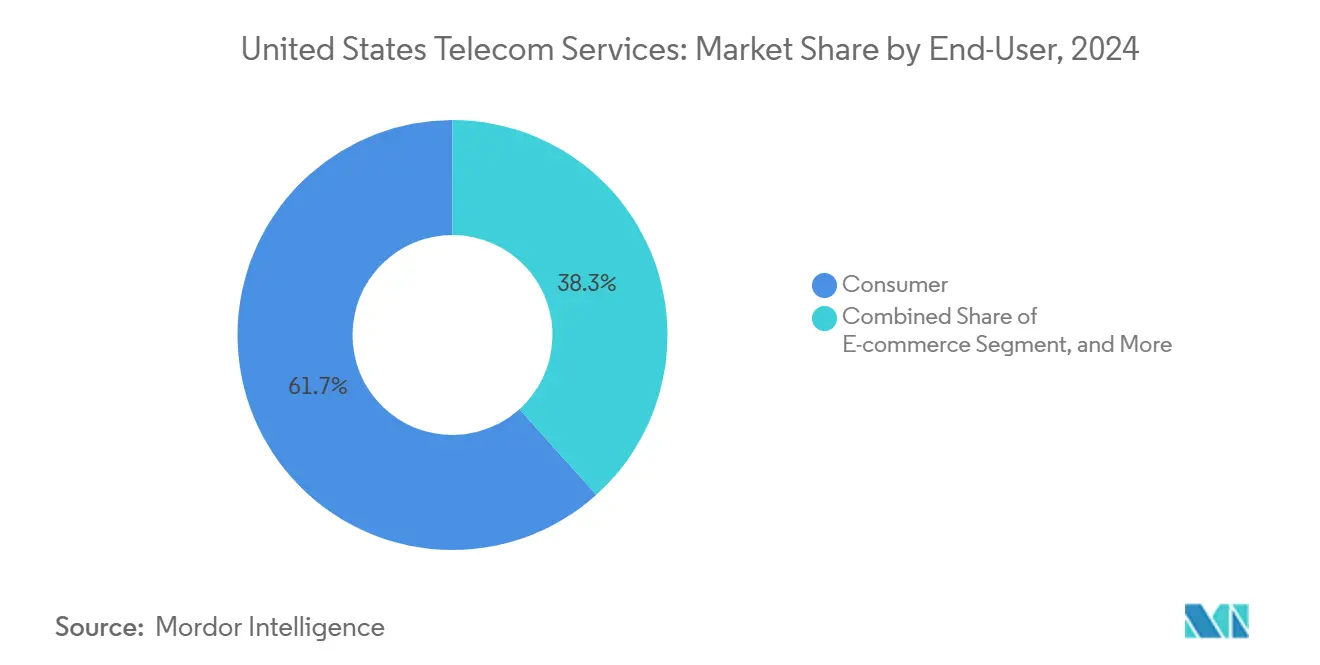
- By end-user, the consumer segment contributed 61.66% of 2024 revenue, while e-commerce is set to post the fastest 7.24% CAGR through 2030.
Worldwide, activity is shaped by contributions from multiple countries and regions, with United states representing one among them. The global report on telecom services market by Mordor Intelligence reflects how these countries and regional layers combine into a single system.
United States Telecom Services Market Trends and Insights
Drivers Impact Analysis*
| Driver | (~) % Impact on CAGR Forecast | Geographic Relevance | Impact Timeline |
|---|---|---|---|
| Accelerated 5G Stand-Alone (SA) Core Deployments | +1.2% | National, with early gains in major metropolitan areas | Medium term (2-4 years) |
| Expansion of Fixed-Wireless Access for Underserved Rural Households | +0.8% | Rural America, particularly BEAD-eligible census blocks | Long term (≥ 4 years) |
| Enterprise Demand for Private Cellular Networks and Edge-Cloud Integration | +1.5% | National, concentrated in manufacturing and logistics hubs | Short term (≤ 2 years) |
| Rising Bandwidth Needs from Generative-AI Data Centers | +1.1% | Regional clusters in Virginia, Texas, Oregon, and North Carolina | Medium term (2-4 years) |
| Infrastructure Funding via the Broadband Equity, Access and Deployment (BEAD) Program | +0.9% | State-specific, prioritizing unserved and underserved areas | Long term (≥ 4 years) |
| Spectrum-Sharing Frameworks (CBRS, 6 GHz) Enabling New Entrants | +0.4% | National, with enterprise adoption concentrated in industrial zones | Medium term (2-4 years) |
| Source: Mordor Intelligence | |||
Accelerated 5G Stand-Alone Core Deployments
T-Mobile’s SA network already covers 300 million Americans, giving the operator a time-to-market edge in network slicing for industrial IoT.[1]T-Mobile US Press Center, “Nationwide 5G Standalone Coverage Milestone,” t-mobile.com Verizon’s SA launch delay to 2025 underscores integration difficulties that smaller carriers may also encounter. Enterprises adopting SA observe latency reductions nearing 40% compared with NSA 5G, enabling real-time analytics in autonomous mobility pilots. Federal contracts tied to NIST cybersecurity frameworks add compliance complexity but secure durable revenue streams. Collectively, SA momentum positions the US telecom services market to monetize ultra-reliable low-latency communications across smart-manufacturing, telehealth, and connected-vehicle domains.
Enterprise Demand for Private Cellular Networks and Edge-Cloud Integration
Private 5G site counts climbed 180% year on year in 2024 as factories and warehouses replaced Wi-Fi with deterministic connectivity for autonomous guided vehicles.[2]Microsoft Corporation, “USD 3.3 Billion Wisconsin AI Infrastructure Investment,” microsoft.com Edge compute nodes cut round-trip latency below 10 milliseconds, a threshold vital for real-time quality assurance in semiconductor and pharmaceutical production. The Department of Defense’s USD 600 million 5G-to-Next-G program validates the architecture, while FedRAMP certification filters out under-prepared vendors. Hyperscalers are partnering with carriers to pre-integrate edge services, redefining the US telecom services market as an end-to-end platform rather than a mere connectivity utility.
Rising Bandwidth Needs from Generative-AI Data Centers
Generative-AI training workloads demand bandwidth more than 1,000 times higher than typical enterprise apps, spurring hyperscale builds in Northern Virginia and the Texas Triangle. Microsoft’s USD 3.3 billion commitment in Wisconsin illustrates the scale of network upgrades required for 400 Gbps fiber routes. Regional fiber strand shortages inflate pricing, creating premium revenue opportunities for middle-mile providers. Environmental regulations that mandate renewable energy sourcing influence site selection, guiding network expansion into wind- and solar-rich states. The cluster effect locks in long-term traffic volumes, ensuring sustained upside for the US telecom services market.
Infrastructure Funding via the BEAD Program
BEAD’s USD 42.45 billion allocation tilts heavily toward fiber, shaping supplier order books through 2030.[3]National Telecommunications and Information Administration, “Broadband Equity, Access, and Deployment Program,” ntia.doc.gov Texas alone will channel USD 3.3 billion to reach 1.5 million unserved premises. Buy America clauses drive up material costs yet revive domestic cable plants, gradually alleviating supply shortages. Predictable multi-year funding gives smaller rural providers confidence to scale, while construction contractors enjoy visibility on labor demand. Overall, BEAD underpins a foundational expansion of the US telecom services market footprint into previously uneconomic geographies.
Restraints Impact Analysis*
| Restraint | (~) % Impact on CAGR Forecast | Geographic Relevance | Impact Timeline |
|---|---|---|---|
| Fiber Construction-Cost Inflation and Labor Shortages | -0.7% | National, particularly acute in rural and mountainous regions | Short term (≤ 2 years) |
| Regulatory Scrutiny on Junk-Fee Practices and Net-Neutrality Reinstatement | -0.4% | National, with compliance costs varying by operator size | Medium term (2-4 years) |
| Declining Traditional Voice ARPU | -0.3% | National, accelerated in urban markets with high mobile penetration | Long term (≥ 4 years) |
| Satellite-Broadband Substitution Risk in Remote Areas | -0.2% | Rural America, particularly areas beyond fiber deployment reach | Medium term (2-4 years) |
| Source: Mordor Intelligence | |||
Fiber Construction-Cost Inflation and Labor Shortages
Fiber-optic cable prices jumped 35% in 2024, while wages for skilled technicians climbed 18% as operators competed for scarce crews. Mountainous routes cost up to 60% more than flat land builds, causing schedule slips that exceed six months on 40% of projects. Prevailing-wage mandates under BEAD intensify contractor scarcity, prompting carriers to stockpile materials and tie up working capital. Despite these hurdles, the long-term capacity benefits keep fiber builds economically rational, albeit at higher capital intensity for the US telecom services market.
Regulatory Scrutiny on Junk-Fee Practices and Net-Neutrality Reinstatement
FCC enforcement secured USD 2.9 billion in consumer refunds in 2024, forcing carriers to eliminate activation and upgrade fees. Net-neutrality rules prohibit paid prioritization, eroding ancillary revenue while increasing traffic-management overhead. Compliance audits now demand detailed proof of nondiscriminatory treatment, raising opex, particularly for smaller operators. Although transparency boosts user confidence, near-term margin compression tempers growth for the US telecom services market.
*Our forecasts treat driver/restraint impacts as directional, not additive. The impact forecasts reflect baseline growth, mix effects, and variable interactions.
Segment Analysis
By Service Type: Data Services Reshape Connectivity
Data and messaging captured 39.54% of 2024 revenue in the US telecom services market, outpacing every other category with an 8.67% CAGR outlook to 2030. Voice retains 25% revenue share as unlimited bundles mask line-item pricing, and pay-TV continues to lose ground to streaming aggregates. Historical growth shows data services accelerating from 6.2% during 2019-2024 to the present pace, fueled by cloud migrations and IoT volumes that require assured bandwidth.
Within data, 5G-enhanced mobile broadband monetizes capacity gains through premium plans, while fixed data targets enterprise SD-WAN and dedicated internet access. Compliance with federal security mandates positions certified carriers to win government workloads, reinforcing the primacy of data services in the US telecom services market. The segment’s superior scalability secures its status as both growth engine and innovation sandbox for emerging use cases such as immersive extended reality and connected robotics.


By Transmission: Fiber-Led Wired Networks Hold the Advantage
Wired infrastructure delivered 47.22% of 2024 revenue and is forecast to expand at 6.02% CAGR. Fiber-to-the-premise dominates dense metros where multidwelling economics justify trenching, while legacy copper persists mainly in enterprise point-to-point circuits. Wireless transmission, covering macro-cellular and satellite, remains indispensable for mobility and remote reach, yet spectrum ceilings limit its ability to substitute for fiber on capacity-hungry workloads.
The US telecom services market size for wired builds gains from favorable cost curves as equipment prices drop with volume and as open-access policies spread. CBRS-enabled hybrid networks further blur the line between wired and wireless, optimizing backhaul where trenching is prohibitive. Satellite LEO constellations add resilience but remain bandwidth-constrained, keeping fiber firmly in the lead for mission-critical enterprise connectivity.
By End-User: Consumers Dominate While E-Commerce Surges
Consumers generated 61.66% of 2024 revenue, reflecting widespread broadband adoption and rising average spend on premium speed tiers. Business and public-sector segments share the remainder, where e-commerce is set to clock a 7.24% CAGR through 2030, underpinned by edge compute nodes that shrink last-mile delivery times. Manufacturing, energy, and healthcare trail with steady 4-6% growth, paced by regulatory clearance and capex budgeting cycles.
Consumer growth is moderating as urban broadband nears saturation, yet gamers and 4K streaming households continue to upsize plans. E-commerce players see network latency as a customer-experience differentiator, driving investments in on-premise edge zones that deepen relationships with carriers. Public-sector digital-equity projects under BEAD further widen the end-user base, reinforcing the long-run resilience of the US telecom services market.
Geography Analysis
Regional performance varies widely in the US telecom services market. The Northeast and West Coast deliver the highest ARPU, supported by dense tech ecosystems that prize redundancy and sub-10-millisecond latency. The Southeast is the fastest climber at 6.8% CAGR as population inflows, manufacturing reshoring, and data-center construction boost demand for fiber links.
Rural Mountain West and Great Plains counties benefit disproportionately from BEAD awards, often exceeding USD 1,000 per unserved premise. The Midwest industrial belt leverages private networks for automotive and logistics plants, while the Texas Triangle absorbs wireless densification to support 2% annual population growth.
FCC mapping shows 21.3 million Americans still lack 25/3 Mbps service. Tribal lands and mountainous regions represent the toughest buildouts, with terrain inflating costs by up to 60%. California’s stringent environmental reviews add eight months to typical fiber permits, underscoring the interplay between state rules and deployment velocity in the US telecom services market.
Competitive Landscape
The US telecom services market features moderate concentration: the top four operators hold 65% of wireless revenue. Scale advantages accrue to firms that meld nationwide fiber, mid-band spectrum, and cloud partnerships. T-Mobile’s head start in 5G SA unlocks early enterprise slicing contracts, while Verizon doubles down on suburban fiber to offset fixed-wireless capacity ceilings. AT and T aligns with hyperscalers to co-locate edge cores, and cable majors such as Charter lean on rural fiber to diversify beyond cable modem markets.
Disruptors include satellite players granted mobile service authority, cloud vendors offering turnkey private 5G, and niche carriers exploiting CBRS for vertical markets. Open RAN trials aim to relax vendor lock-in and accelerate feature deployment. Strategic moves center on spectrum auctions, infrastructure-sharing accords, and AI-enabled network automation to squeeze opex.
Overall, competitive intensity spurs innovation while preserving room for specialized entrants, sustaining a dynamic yet disciplined US telecom services market.
United States Telecom Services Industry Leaders
Verizon Communications Inc.
Comcast Corporation
Charter Communications Inc.
T-Mobile US Inc.
Lumen Technologies Inc.
- *Disclaimer: Major Players sorted in no particular order

Recent Industry Developments
- October 2025: Verizon earmarked USD 2.1 billion for suburban fiber builds targeting 3 million premises by 2027.
- September 2025: T-Mobile closed the USD 1.35 billion acquisition of Ka'ena Corporation, adding 5 million prepaid subscribers.
- July 2025: Charter committed USD 5 billion to rural fiber expansion through 2028 in concert with local electric co-ops.
- June 2025: Starlink secured FCC clearance for mobile satellite services enabling direct-to-cell connectivity.


United States Telecom Services Market Report Scope
| Voice Services | Wired |
| Wireless | |
| Data and Messaging Services | Mobile Data Services |
| Fixed Data Services | |
| Pay-TV and OTT Services |
| Wired | Fiber Optic |
| Copper Cable | |
| Wireless | Cellular Networks |
| Satellite Communication |
| Consumer | |
| Business | Manufacturing |
| Energy and Utilities | |
| Transportation and Logistics | |
| Public Sector | |
| Healthcare | |
| E-commerce | |
| Others |
| By Service Type | Voice Services | Wired |
| Wireless | ||
| Data and Messaging Services | Mobile Data Services | |
| Fixed Data Services | ||
| Pay-TV and OTT Services | ||
| By Transmission | Wired | Fiber Optic |
| Copper Cable | ||
| Wireless | Cellular Networks | |
| Satellite Communication | ||
| By End-User | Consumer | |
| Business | Manufacturing | |
| Energy and Utilities | ||
| Transportation and Logistics | ||
| Public Sector | ||
| Healthcare | ||
| E-commerce | ||
| Others | ||


Key Questions Answered in the Report
How large is U.S. spending on telecom services in 2025?
The US telecom services market size reaches USD 451.7 billion in 2025.
What is the projected growth pace through 2030?
Aggregate revenue is forecast to rise to USD 601.2 billion, equating to a 5.88% CAGR.
Which segment is expanding fastest?
Data and messaging services show the highest 8.67% CAGR to 2030.
Why is 5G standalone important for enterprises?
SA cores enable network slicing, delivering sub-10-millisecond latency essential for industrial IoT and real-time analytics.
How does the BEAD program influence rural connectivity?
BEAD earmarks USD 42.45 billion for fiber builds, bringing high-speed broadband to millions of unserved premises, especially in rural states.
What competitive trend defines 2025?
Convergence of carriers, cable, cloud, and satellite firms intensifies, with the top four still holding about 65% of wireless revenue.
Page last updated on:


