Mobile Device Management Market Size and Share
Market Overview
| Study Period | 2020 - 2031 |
|---|---|
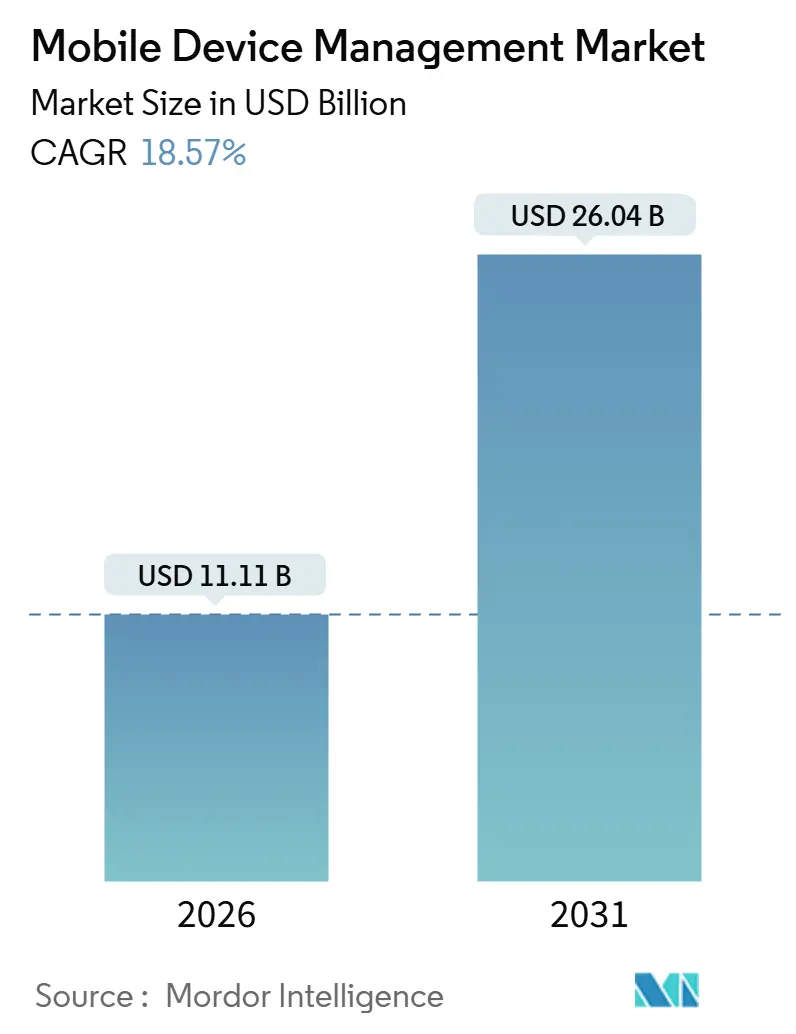
| Market Size (2026) | USD 11.11 Billion |
| Market Size (2031) | USD 26.04 Billion |
| Growth Rate (2026 - 2031) | 18.57% CAGR |
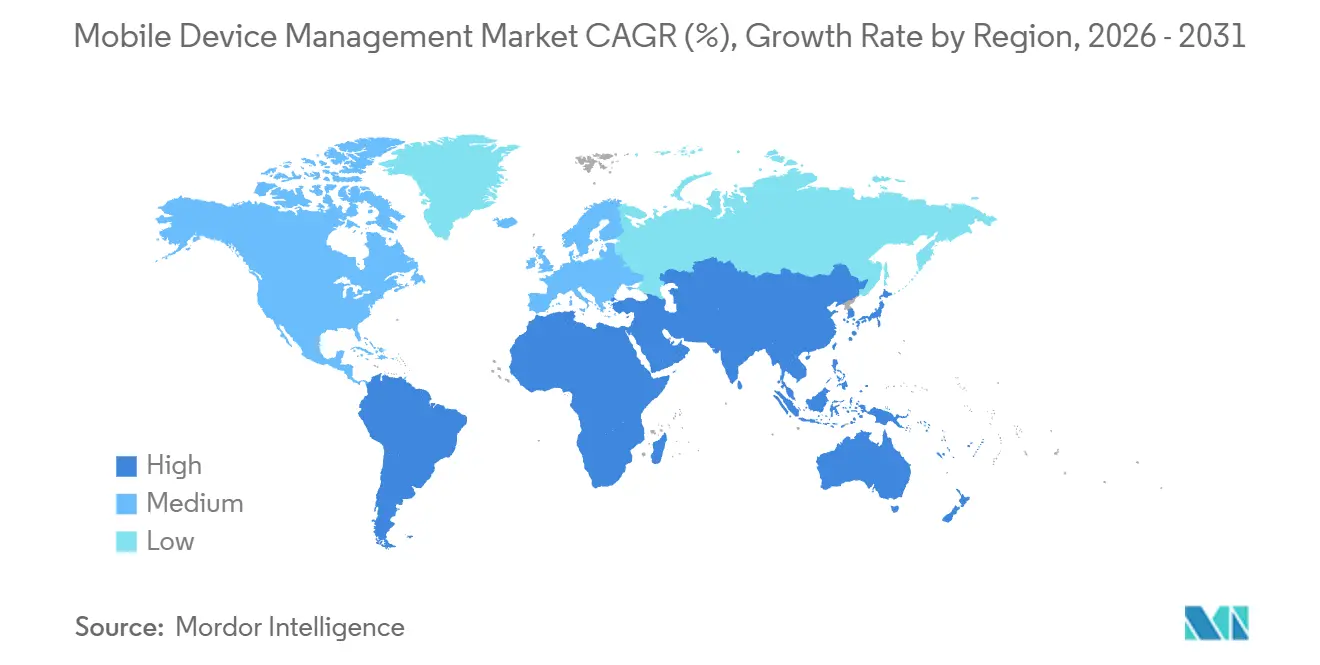
| Fastest Growing Market | Asia Pacific |
| Largest Market | North America |
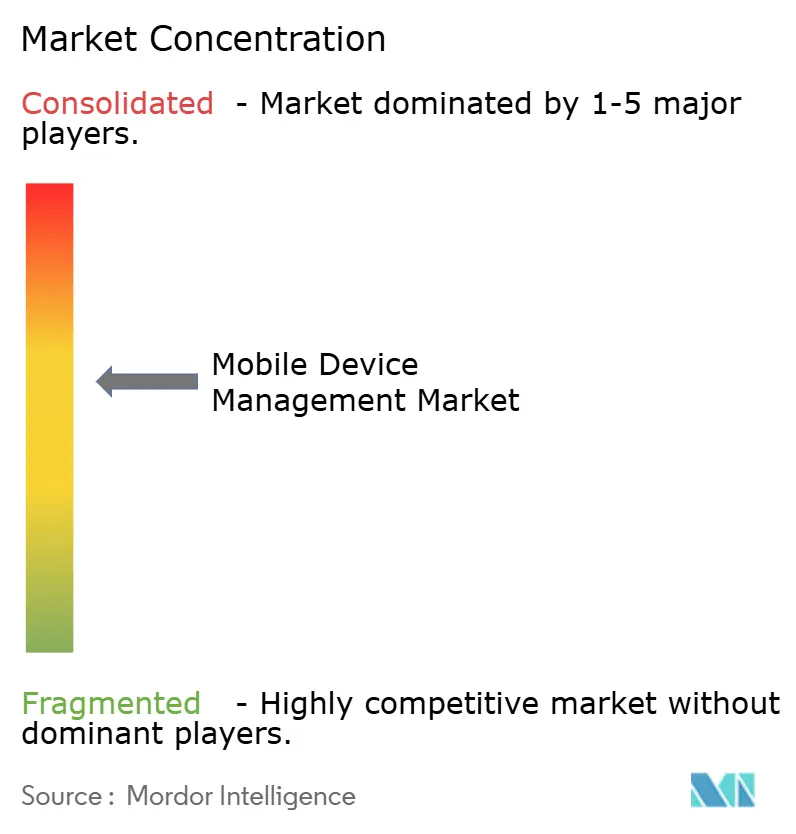
| Market Concentration | Medium |
Major Players *Disclaimer: Major Players sorted in no particular order Image © Mordor Intelligence. Reuse requires attribution under CC BY 4.0. | |
Mobile Device Management Market Analysis by Mordor Intelligence
The Mobile Device Management market size stands at USD 11.11 billion in 2026 and is projected to reach USD 26.04 billion by 2031, reflecting an 18.57% CAGR over the period. This trajectory reflects a decisive shift toward zero-trust security, enhanced cyber-insurance standards, and 5G-enabled workforce models that subject every endpoint to continuous scrutiny. Cloud-native unified endpoint management, stringent insurer mandates, and the accelerating adoption of BYOD now position the Mobile Device Management market as a critical layer in enterprise risk reduction, rather than a back-office IT task. The rapid proliferation of industrial IoT sensors, post-quantum cryptography upgrades, and ESG-linked procurement rules further expands the addressable opportunity. Competitive differentiation is shifting from feature checklists to demonstrable cryptographic agility, lifecycle transparency, and seamless identity federation, while integration cost, privacy regulations, and battery constraints on rugged devices temper near-term adoption momentum.
Key Report Takeaways
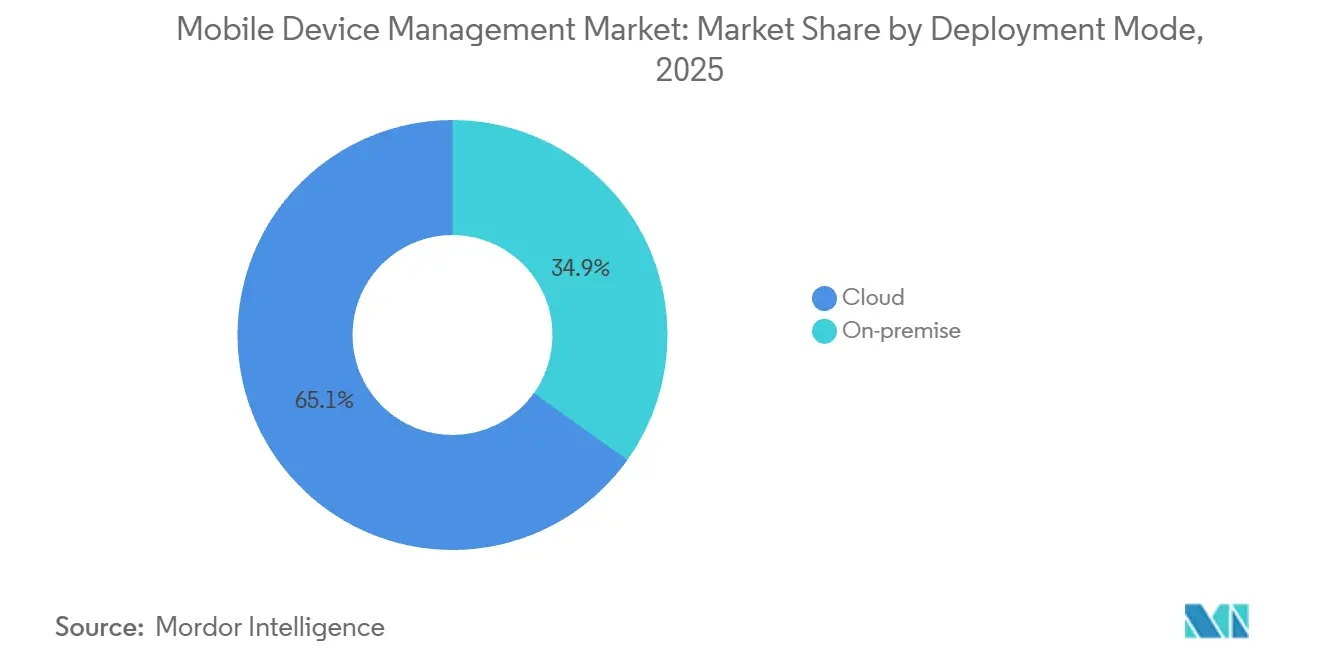
- By deployment mode, cloud deployment captured 65.13% revenue share in 2025 and is forecast to expand at a 19.12% CAGR through 2031.
- By device type, smartphones and tablets led with 48.28% share in 2025, while IoT and industrial IoT endpoints are poised to advance at a 20.34% CAGR through 2031.
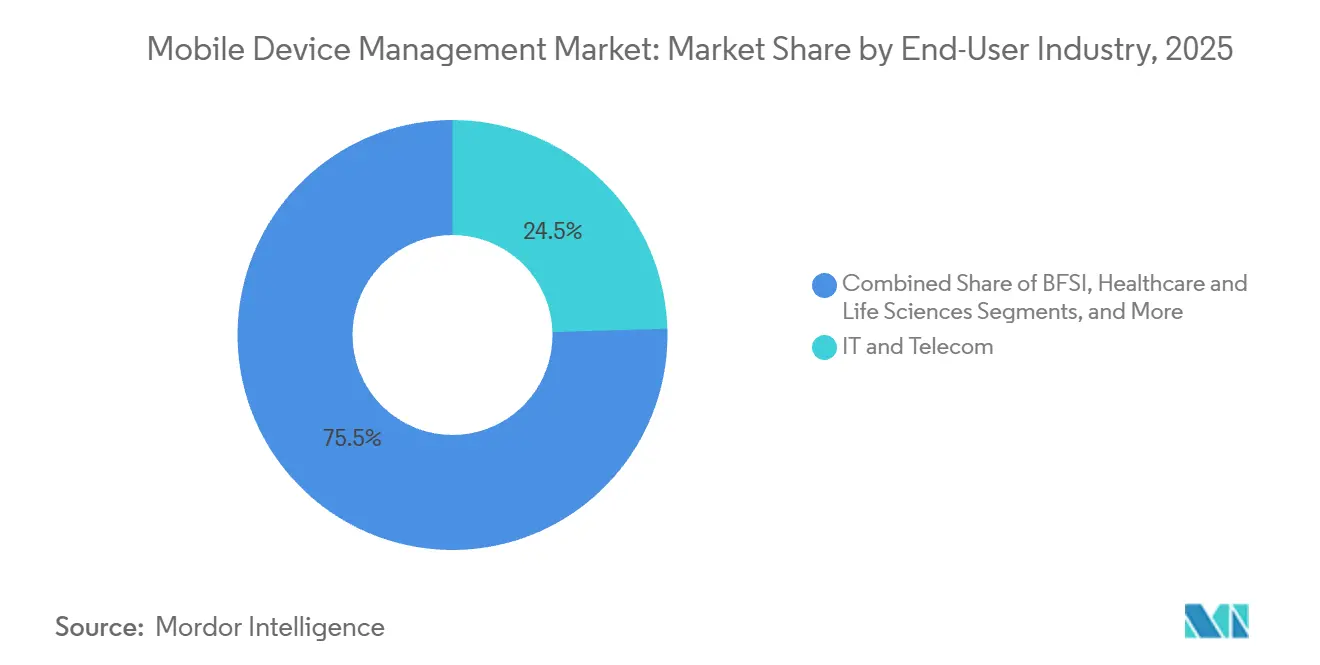
- By end-user industry, IT and telecom held a 24.53% spending share in 2025, but healthcare and life sciences are projected to grow at a 21.32% CAGR through 2031.
- By ownership model, corporate-owned devices retained a 56.91% share in 2025, while BYOD programs are anticipated to grow at a 21.32% CAGR through 2031.
- By geography, North America accounted for 38.71% market share in 2025, whereas Asia Pacific is expected to record the highest regional CAGR at 10.23% through 2031.
Note: Market size and forecast figures in this report are generated using Mordor Intelligence’s proprietary estimation framework, updated with the latest available data and insights as of January 2026.
Global Mobile Device Management Market Trends and Insights
Drivers Impact Analysis*
| Driver | ( ~ ) % Impact on CAGR Forecast | Geographic Relevance | Impact Timeline |
|---|---|---|---|
| Explosion of Enterprise BYOD Policies | +3.8% | Global, with concentration in North America and Europe | Short term (≤ 2 years) |
| Accelerating Shift to Cloud-Native UEM Suites | +4.2% | Global, led by North America and Asia Pacific | Medium term (2-4 years) |
| Surge in Cyber-Insurance Mandates for Endpoint Control | +3.1% | North America and Europe, expanding to Asia Pacific | Medium term (2-4 years) |
| 5G-Enabled Field-Service Workforce Expansion | +2.9% | Global, with early traction in Asia Pacific and Middle East | Long term (≥ 4 years) |
| Post-Quantum Security Preparations Elevating Device Trust Stacks | +2.4% | North America and Europe, with spillover to Asia Pacific | Long term (≥ 4 years) |
| ESG-Linked Procurement Favouring Secure-Device Vendors | +1.8% | Europe, expanding to North America and Asia Pacific | Long term (≥ 4 years) |
| Source: Mordor Intelligence | |||
Explosion of Enterprise BYOD Policies
Hybrid work has pushed 82% of organizations to allow employee-owned phones and tablets on corporate networks in 2025, up from 67% in 2023. This expanded fleet multiplies operating-system permutations, personal cloud apps, and unmanaged data paths, demanding containerization and remote-wipe controls. Insurers are increasingly denying or surcharging coverage when unmanaged endpoints exist, making MDM adoption a prerequisite for risk transfer. Cost savings from eliminating corporate device stipends can entice finance teams; however, breach-related penalties under the GDPR or the California Consumer Privacy Rights Act may offset those savings. As a result, executives view the Mobile Device Management market as a direct hedge against regulatory fines and premium hikes rather than an optional efficiency tool.
Accelerating Shift to Cloud-Native UEM Suites
Organizations are abandoning on-premise consoles for cloud platforms that consolidate phones, laptops, wearables, and IoT devices behind a single policy fabric. Microsoft Intune, integrated with Azure Active Directory, exemplifies how conditional access decisions now assess real-time device health, user identity, and app context.[1]Microsoft Corporation, “Microsoft Intune,” microsoft.com Elastic capacity removes server procurement cycles, while automatic updates ensure continuous compliance with emerging zero-trust guidelines. Medium-term gains include machine-learning remediation of configuration drift and predictive hardware failure alerts, cutting endpoint management labor by as much as 40%. Delayed migrations risk technical debt as emerging standards such as FIDO2 and post-quantum algorithms outpace on-premise software release cycles.
Surge in Cyber-Insurance Mandates for Endpoint Control
After ransomware claims topped USD 20 billion in 2024, carriers such as Lloyd’s of London began requiring attested device encryption, patch management, and remote-wipe capabilities before issuing or renewing policies. The New York State Department of Financial Services echoed this stance by mandating annual endpoint control certification for regulated entities. Enterprises that fall short face premium increases of 50% or outright coverage exclusions, resulting in the shifting of MDM procurement authority from CIOs to CFOs. Financial reporting risk, therefore, fuels Mobile Device Management market purchases, especially in healthcare, where a single breach can unleash HIPAA fines and class-action litigation.
5G-Enabled Field-Service Workforce Expansion
Standalone 5G networks allow rugged tablets, smart helmets, and wearables to stream video diagnostics and AR instructions with millisecond latency. Ericsson forecasts 6.4 billion 5G subscriptions by 2031, with industrial segments expected to capture an outsized share. Utilities, construction firms, and logistics operators now bundle eSIM credentials with MDM policies to enforce geofencing and quality-of-service tiers. Carriers that leverage network slicing allocate dedicated bandwidth to enterprise devices, ensuring that mission-critical traffic outranks consumer data. The Mobile Device Management market, therefore, expands alongside 5G adoption, as every new sensor or handheld requires secure bootstrapping, firmware updates, and posture verification.
Restraint Impact Analysis*
| Restraint | (~) % Impact on CAGR Forecast | Geographic Relevance | Impact Timeline |
|---|---|---|---|
| Up-Front Integration Cost with Legacy IAM/ITSM Stacks | -2.1% | Global, with acute impact in North America and Europe | Short term (≤ 2 years) |
| Fragmented Regulatory Data-Sovereignty Rules | -1.7% | Global, with concentration in Europe, Asia Pacific, and Middle East | Medium term (2-4 years) |
| Growing Employee Privacy Pushback on Device Tracking | -1.3% | Europe and North America, emerging in Asia Pacific | Medium term (2-4 years) |
| Limited Battery/CPU Headroom on Rugged IoT Endpoints | -0.9% | Global, with focus on manufacturing and logistics sectors | Long term (≥ 4 years) |
| Source: Mordor Intelligence | |||
Up-Front Integration Cost with Legacy IAM/ITSM Stacks
Enterprises relying on outdated identity managers and help-desk tools must fund custom APIs, directory sync, and workflow orchestration when deploying modern MDM. Consulting fees often exceed USD 500,000, and projects can last a year, straining budgets for mid-sized firms.[2]IBM Corporation, “MaaS360 with Watson,” ibm.com Mixed authentication protocols create single points of failure and incident-response delays, while strict change-control boards in finance and healthcare prolong testing cycles. This cost friction temporarily slows the uptake of Mobile Device Management among heavily regulated incumbents.
Fragmented Regulatory Data-Sovereignty Rules
GDPR limits cross-border transfers without adequacy rulings, China’s Personal Information Protection Law mandates domestic data storage, and India’s Digital Personal Data Protection Act empowers the government to designate critical data categories. Multi-tenant cloud vendors must build regional data centers or hybrid options, eroding economies of scale. On-the-fly policy shifts as employees travel between jurisdictions remain rare features, forcing many organizations to maintain parallel MDM instances. Compliance overhead, therefore, subdues Mobile Device Management market growth, especially for globally distributed enterprises.
*Our forecasts treat driver/restraint impacts as directional, not additive. The impact forecasts reflect baseline growth, mix effects, and variable interactions.
Segment Analysis
By Deployment Mode: Cloud Suites Capture Two-Thirds Share
Cloud-hosted platforms controlled 65.13% of 2025 revenue, confirming their dominance in the Mobile Device Management market. The model’s 19.12% CAGR to 2031 reflects elastic scaling, automatic feature updates, and pay-as-you-go pricing that converts capital outlays into operating expenses. Vendors such as Microsoft and VMware expose REST APIs that integrate with SIEM, IAM, and EDR tools, trimming integration timelines. Even defense and financial institutions that once rejected public cloud now adopt hybrid blueprints that mirror policies across sovereign data centers for disaster recovery, further enlarging the cloud’s footprint.
Autonomous endpoint management accelerates the shift, as machine-learning engines analyze telemetry, predict component failures, and self-correct drift. Gartner estimates a 40% cut in labor costs by 2029 when autonomous capabilities mature, underscoring why the Mobile Device Management market favors cloud delivery. Zero-touch provisioning enables devices to ship directly to end users and self-enroll through QR codes, a practice that was cemented during pandemic lockdowns. The value proposition, however, hinges on hardware attestation and a secure supply chain, because compromised firmware can defeat remote-management safeguards before devices even connect.


By Device Type: IoT Endpoints Outpace Smartphones
Smartphones and tablets owned 48.28% of 2025 revenue, but industrial IoT endpoints will grow at 20.34% CAGR as factories embed cellular modules in robots, fleets deploy rugged handhelds, and utilities install smart meters.[3]Ericsson, “Ericsson Mobility Report,” ericsson.com Cellular IoT connections are projected to reach 5.6 billion by 2030, each requiring certificate rotation, patching, and network-access controls. Laptops remain vital for code development and financial modeling, yet browser-based apps flatten their growth curve.
Rugged and wearable devices thrive in construction, mining, and clinical settings where harsh environments or infection-control rules preclude consumer hardware. Lightweight protocols such as OMA-DM and LwM2M shrink agent footprints, conserving battery and CPU. 5G network slicing offers dedicated bandwidth for telemetry, ensuring reliable throughput for autonomous vehicles or remote surgery. These dynamics channel investment toward IoT-oriented functionality within the Mobile Device Management market, including power-aware policy polling and edge-cached updates.
By End-User Industry: Healthcare Becomes the Growth Engine
IT and telecom captured 24.53% of 2025 spending thanks to early BYOD acceptance and developer workstation security. Yet, healthcare and life sciences will be the Mobile Device Management market’s fastest-growing segment at a 21.32% CAGR through 2031, driven by telehealth, remote patient monitoring, and decentralized clinical trials. HIPAA demands encryption, role-based permissions, and audit logging on every mobile device accessing electronic health records, propelling hospital procurement cycles.
Financial services continue to invest, maintaining endpoint controls to meet Gramm-Leach-Bliley and PCI DSS requirements, although branch consolidation moderates growth. Retailers deploy mobile point-of-sale terminals and inventory scanners that integrate with ERP platforms, while manufacturers embed tablets on production lines to display quality checklists and predictive maintenance alerts. Education purchasing plateaus as post-pandemic device fleets age without replacement budgets, and privacy concerns restrict student tracking. Logistics operators enforce geofence rules on handheld devices to deter route deviations, reflecting the use-case specificity that broadens but fragments the Mobile Device Management market demand.

By Ownership Model: BYOD Accelerates under Hybrid Work
Corporate-owned hardware retained a 56.91% share in 2025; however, BYOD programs are expanding at a 21.32% CAGR, as employees resist carrying dual devices. Containerization separates corporate data within encrypted partitions; however, privacy statutes such as GDPR Article 88 or the California Consumer Privacy Rights Act require employers to disable intrusive monitoring. Choose-your-own-device schemes reduce support complexity but limit the availability of volume discounts.
Generational expectations are shifting toward personal hardware flexibility, and cyber-insurance underwriters now require mobile application management on any device that touches corporate data. Consequently, the Mobile Device Management market must strike a balance between user autonomy and compliant oversight. Regions with lighter privacy regimes will adopt BYOD more quickly, while European works councils and North American unions may prompt enterprises to revert to corporate-owned models.
Geography Analysis
North America held a 38.71% share in 2025, buoyed by early BYOD uptake, rigorous cyber-insurance clauses, and a dense vendor ecosystem. The United States Cybersecurity and Infrastructure Security Agency classifies endpoint management as a core safeguard for critical infrastructure, accelerating public-sector rollouts.[4]Cybersecurity and Infrastructure Security Agency, “Cross-Sector Cybersecurity Performance Goals,” cisa.gov Canadian and Mexican data-protection laws are driving the growth of regionally hosted cloud instances, yet the United States-Mexico-Canada Agreement facilitates cross-border data flow. Market growth steadies as large enterprises near saturation, but small firms without dedicated IT staff remain a significant expansion vector for the Mobile Device Management market.
Europe’s trajectory depends on GDPR compliance and ESG directives. Germany, the United Kingdom, and France anchor demand, while the Corporate Sustainability Due Diligence Directive rewards vendors that disclose their carbon footprints and support the right to repair. Russian sanctions restrict Western cloud services, prompting the development of domestic alternatives. Works councils routinely negotiate device-tracking limitations under GDPR Article 88, affecting feature uptake more than license volumes.
Asia Pacific is the fastest-growing region at 10.23% CAGR, underpinned by India’s Digital India scheme, China’s smart manufacturing push, and Japan’s Society 5.0 infrastructure vision. South Korea’s mature 5G landscape encourages early adoption of low-latency MDM features for autonomous systems. Australia and New Zealand strengthen cybersecurity baselines through the Essential Eight, reinforcing MDM’s role. The Middle East sees momentum in the United Arab Emirates and Saudi Arabia, while Africa’s nascent uptake concentrates in Nigeria and Kenya’s fintech ecosystems. Collectively, these initiatives broaden the Mobile Device Management market but demand feature localization and sovereign data hosting.

Competitive Landscape
The top five suppliers - Microsoft, VMware, IBM, JAMF, and BlackBerry - hold roughly 45% to 50% combined revenue, creating moderate market concentration. Microsoft bundles Intune with Microsoft 365, cross-selling to an entrenched Azure Active Directory base and automating zero-touch provisioning via Windows Autopilot. VMware Workspace ONE, now under Broadcom, fuses desktop virtualization, device management, and security analytics. IBM’s MaaS360 layers Watson AI for anomaly detection, correlating telemetry against global threat patterns. JAMF controls the Apple niche, where creative and education sectors dominate, and recently partnered with Apple on hardware-backed attestation.
Gap areas persist in rugged IoT devices, where standard MDM agents drain batteries. Emerging players like Hexnode, 42Gears, and Scalefusion target small businesses in India and Southeast Asia with lightweight agents and support in local languages. NIST’s post-quantum cryptography standards have sparked a race to retrofit algorithms, benefiting vendors with deep in-house cryptography expertise. Carriers, including Verizon and AT&T, bundle MDM with 5G data plans, embedding endpoint posture checks into network slices and simplifying procurement for field-service clients.
Price increases, such as Broadcom’s 15% to 20% hike after integrating Workspace ONE with Symantec, prompt some customers to evaluate alternatives, sustaining churn dynamics that prevent oligopoly. Overall, innovation hinges on cryptographic agility, API openness, and sovereignty flexibility rather than classic feature parity, steering the Mobile Device Management market toward services-led differentiation.
Mobile Device Management Industry Leaders
VMware Inc.
Microsoft Corporation (Intune)
IBM Corporation
Citrix Systems Inc.
SAP SE
- *Disclaimer: Major Players sorted in no particular order

Recent Industry Developments
- January 2026: Oracle announced a beta program to integrate post-quantum key exchange into its mobile management suite, targeting government contracts due in 2027.
- December 2025: Microsoft expanded Intune with autonomous remediation capabilities that trim endpoint-management labor by 40%.
- November 2025: JAMF and Apple launched joint zero-trust frameworks for macOS and iOS, introducing hardware-backed attestation.
- October 2025: IBM injected Watson AI into MaaS360 and committed USD 150 million to Asia Pacific data-center expansion.


Research Methodology Framework and Report Scope
Market Definitions and Key Coverage
Our study defines the global Mobile Device Management (MDM) market as all commercial-grade software and related subscription services that let IT teams configure, secure, monitor, and wipe smartphones, tablets, laptops, and rugged or IoT endpoints through a central console; it also contains the ancillary support and maintenance fees that accompany these platforms. We, the analysts at Mordor Intelligence, map value only at the software and services layer, not at the underlying device or connectivity tier.
Scope Exclusions: Stand-alone Mobile Threat Defense tools and hardware-only device locks are excluded.
Segmentation Overview
- By Deployment Mode
- On-Premise
- Cloud
- By Device Type
- Smartphones and Tablets
- Laptops and Desktops
- Rugged and Wearable Devices
- IoT/IIoT Endpoints
- By End-User Industry
- IT and Telecom
- BFSI
- Healthcare and Life Sciences
- Retail and E-Commerce
- Government and Public Sector
- Manufacturing
- Education
- Transportation and Logistics
- By Ownership Model
- Corporate-Owned Devices
- BYOD
- COPE (Corporate-Owned, Personally Enabled)
- CYOD (Choose-Your-Own-Device)
- By Geography
- North America
- United States
- Canada
- Mexico
- South America
- Brazil
- Argentina
- Rest of South America
- Europe
- Germany
- United Kingdom
- France
- Italy
- Spain
- Russia
- Rest of Europe
- Asia Pacific
- China
- Japan
- South Korea
- India
- Australia
- New Zealand
- Rest of Asia Pacific
- Middle East
- United Arab Emirates
- Saudi Arabia
- Turkey
- Rest of Middle East
- Africa
- South Africa
- Nigeria
- Kenya
- Rest of Africa
- North America
Detailed Research Methodology and Data Validation
Primary Research
Our team conducts semi-structured interviews with CIOs, mobile security architects, channel partners, and managed service providers across North America, Europe, and Asia-Pacific. The conversations validate license pricing ranges, cloud adoption pacing, and real-world device per employee ratios that secondary sources seldom quantify.
Desk Research
We pull baseline data from open-access authorities such as the US Bureau of Labor Statistics, Eurostat, India's TRAI, and trade groups like the GSM Association for installed base, BYOD ratio, and mobility spending trends. Regulatory texts from NIST, GDPR, and HIPAA clarify compliance triggers, while patent analytics from Questel spotlight emerging zero-trust functions. Company 10-Ks, device OEM shipments, and news archives on Dow Jones Factiva enrich vendor-side context. Finally, shipment-level clues from Volza help us cross-check regional device flows. This list is illustrative, not exhaustive.
Market-Sizing & Forecasting
We start with a top-down device pool model that layers enterprise smartphone and laptop installed bases with BYOD penetration, average active seats per MDM tenant, and typical SaaS ARPU. Supplier roll-ups and channel checks act as a bottom-up reasonableness screen before totals are locked. Key market fingerprints used inside the model include: 5G workforce expansion rates, cloud versus on-premise migration shares, average device refresh cycles, and regional compliance spending multipliers. A multivariate regression on these drivers supplies the 2025 to 2030 outlook, and gaps in granular bottom-up inputs are bridged with calibrated adoption curves endorsed by our interview panel.
Data Validation & Update Cycle
Outputs pass two analyst reviews; variances beyond ±5% versus historical trend lines trigger a model rerun. We refresh every twelve months, yet we reopen the file sooner if a material event, such as a major zero-day exploit, alters demand assumptions. Before publication, an analyst performs a last-minute data sweep so clients receive the latest view.
Why Mordor's Mobile Device Management Baseline Commands Reliability
Published figures often diverge because each publisher picks its own scope, pricing lens, and refresh rhythm. We acknowledge those differences up front so users can gauge fit.
Key gap drivers include whether MDM is bundled inside broader Enterprise Mobility or UEM scopes, how aggressively BYOD seats are projected, the mix of perpetual versus SaaS licensing, and currency conversions at varying cut-off dates.
Benchmark comparison
| Market Size | Anonymized source | Primary gap driver |
|---|---|---|
| USD 9.34 Bn (2025) | Mordor Intelligence | |
| USD 15.75 Bn (2025) | Global Consultancy A | Bundles EMM and UEM revenue, high BYOD multipliers |
| USD 9.49 Bn (2025) | Trade Journal B | Relies on sampled vendor disclosures, limited regional scaling |
| USD 13.44 Bn (2025) | Industry Association C | Mixes security hardware with software, older FX rates |
The comparison shows that once differing scopes and input biases are stripped away, Mordor Intelligence offers a balanced, transparent baseline anchored to observable device pools and verifiable license economics, giving decision-makers a dependable starting point.


Key Questions Answered in the Report
What is the current value of the Mobile Device Management market?
The market is valued at USD 11.11 billion in 2026 and is forecast to reach USD 26.04 billion by 2031.
How fast is the Mobile Device Management market expected to grow?
It is projected to post an 18.57% CAGR between 2026 and 2031.
Which deployment mode leads revenue?
Cloud platforms held 65.13% of 2025 revenue, reflecting enterprises’ preference for elastic scaling and zero-touch provisioning.
Which region will grow the fastest?
Asia Pacific is expected to register a 10.23% CAGR through 2031, driven by large-scale digitalization programs in India, China, and Japan.
Why is healthcare a high-growth vertical?
Telehealth, remote patient monitoring, and strict HIPAA security rules drive a 21.32% CAGR for healthcare and life sciences through 2031.
How are cyber-insurance requirements influencing adoption?
Insurers now demand proof of endpoint control, and enterprises lacking MDM face premium hikes of 50% or policy denials, prompting accelerated deployment.
Page last updated on:


