Cross Platform And Mobile Advertising Market Size and Share
Market Overview
| Study Period | 2019 - 2030 |
|---|---|
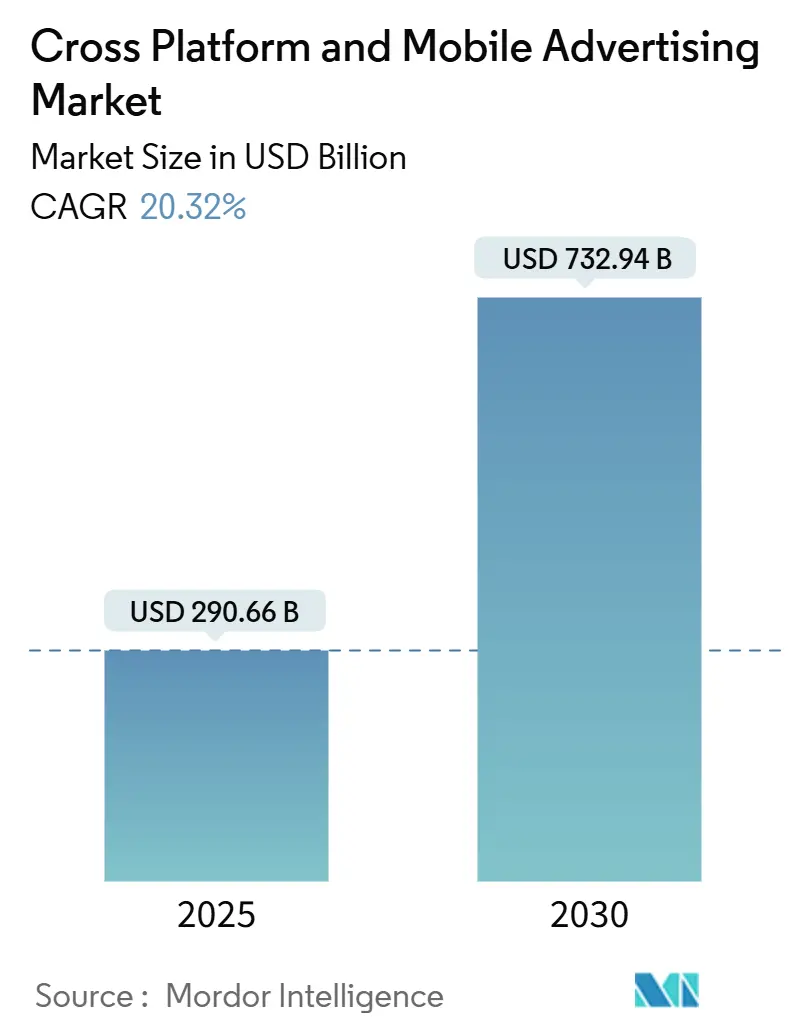
| Market Size (2025) | USD 290.66 Billion |
| Market Size (2030) | USD 732.94 Billion |
| Growth Rate (2025 - 2030) | 20.32% CAGR |
| Fastest Growing Market | Middle East |
| Largest Market | Asia Pacific |
| Market Concentration | High |
Major Players *Disclaimer: Major Players sorted in no particular order Image © Mordor Intelligence. Reuse requires attribution under CC BY 4.0. | |
Cross Platform And Mobile Advertising Market Analysis by Mordor Intelligence
The Cross Platform and Mobile Advertising Market stood at USD 290.66 billion in 2025 and is projected to reach USD 732.94 billion by 2030, reflecting a 20.32% CAGR. The current Cross Platform and Mobile Advertising market size is propelled by the rapid spread of programmatic in-app bidding, which now processes more than 10 million bid requests per second on leading demand-side platforms. Edge analytics over 5G networks, rising first-party data strategies, and privacy-safe contextual targeting each reinforce spending momentum. Video formats keep users engaged longer, while immersive in-app placements sustain higher click-through rates than legacy banners. Asia-Pacific’s mobile-first culture, the rollout of retail media networks in North America and Europe, and the Middle East’s mega-project investments collectively expand inventory and budgets.
Key Report Takeaways
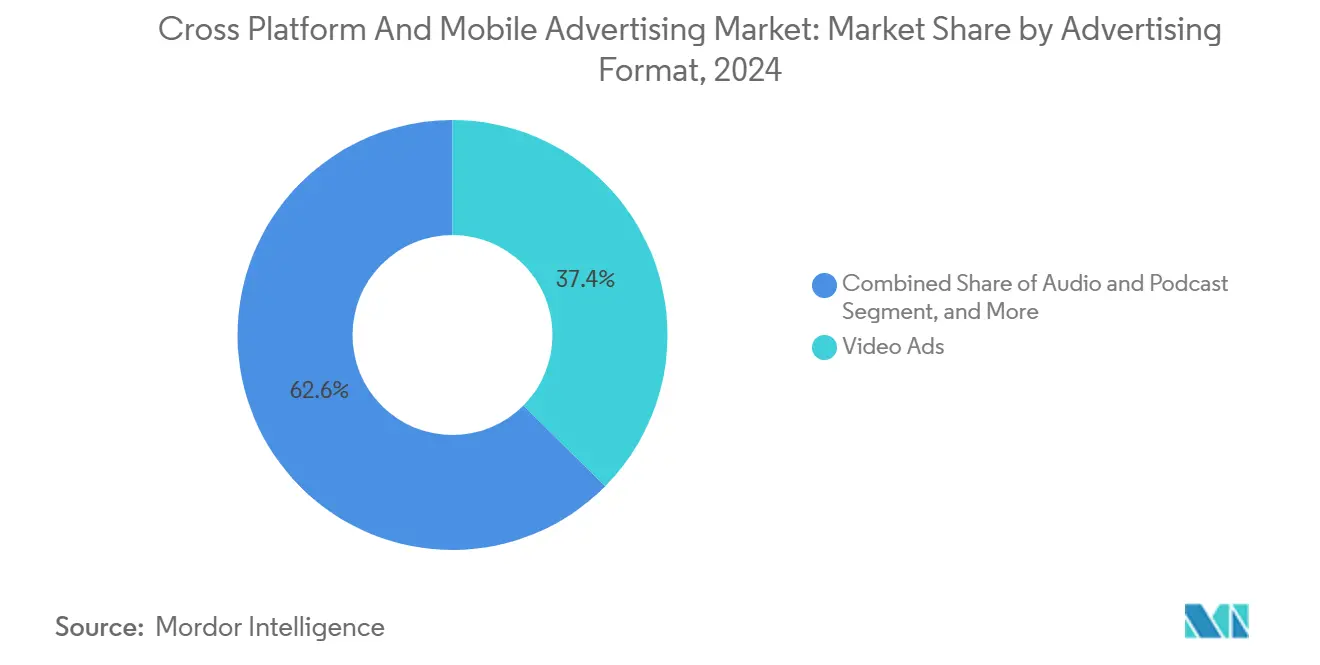
- By advertising format, video commanded 37.43% of the Cross Platform and Mobile Advertising market share in 2024, whereas audio and podcast placements are set to rise at 20.53% CAGR through 2030.
- By platform, Android held 71.19% share of the Cross Platform and Mobile Advertising market size in 2024; iOS monetization, though smaller in reach, drove the highest revenue per user and is forecast to climb at 22.38% CAGR to 2030.
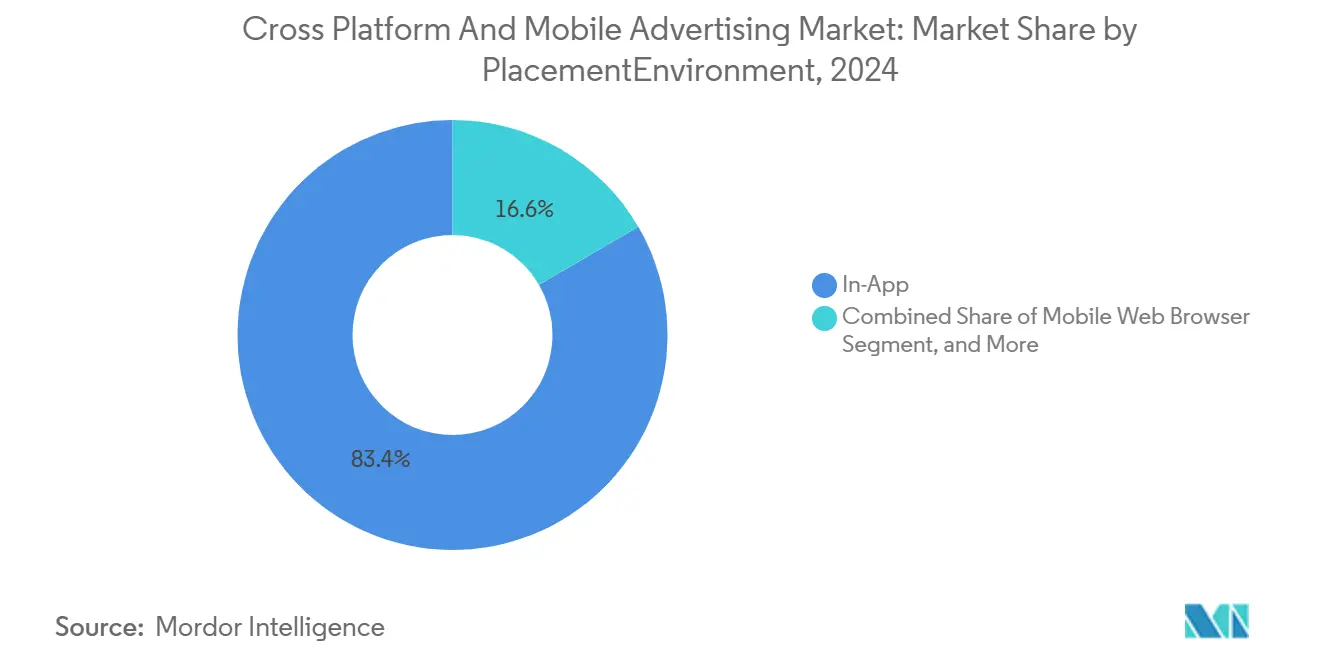
- By placement, in-app environments captured 83.39% revenue in 2024, while omnichannel and cross-device campaigns show a 21.11% CAGR outlook to 2030.
- By end-use industry, retail and e-commerce retained 25.98% spending in 2024; healthcare and fitness apps are advancing at 20.44% CAGR through 2030.
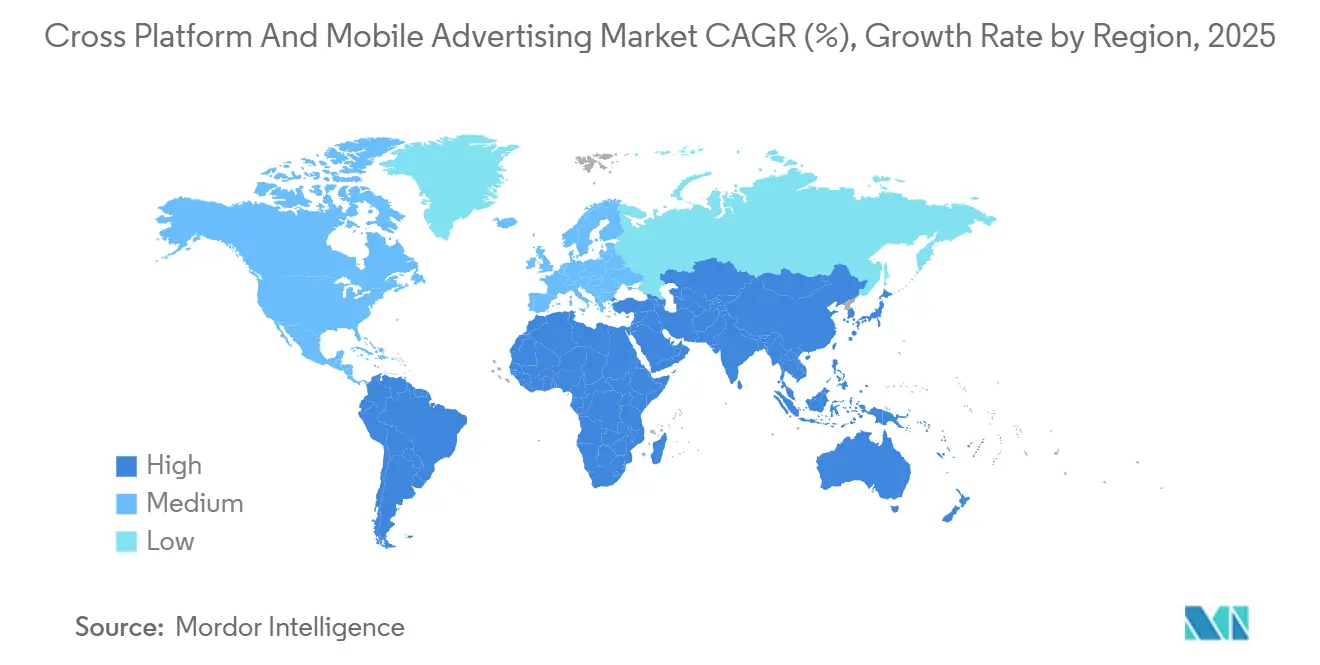
- By geography, Asia-Pacific accounted for 42.33% revenue in 2024, and the Middle East is expanding fastest at 20.97% CAGR to 2030.
Global Cross Platform And Mobile Advertising Market Trends and Insights
Drivers Impact Analysis*
| Driver | (~) % Impact on CAGR Forecast | Geographic Relevance | Impact Timeline |
|---|---|---|---|
| Programmatic in-app video spend | +4.2% | Global – Asia-Pacific and North America lead | Medium term (2-4 years) |
| Retail-media first-party data on mobile | +3.8% | North America and EU; scaling in Asia-Pacific | Short term (≤ 2 years) |
| Privacy-safe contextual targeting | +3.1% | Global; EU compliance drives adoption | Medium term (2-4 years) |
| Generative-AI creative optimization | +2.9% | North America and EU; spill-over into Asia-Pacific | Long term (≥ 4 years) |
| 5G-enabled edge analytics | +2.7% | Asia-Pacific core; MEA and North America follow | Long term (≥ 4 years) |
| Mobile-CTV measurement stack convergence | +2.1% | North America and EU; early urban Asia-Pacific uptake | Medium term (2-4 years) |
| Source: Mordor Intelligence | |||
Surge in Programmatic In-App Video Spend
Bid-automation engines now complete transactions within 100 milliseconds, letting marketers refresh creative on the fly based on real-time completion-rate signals.[1]Unity, “Unity Ads Products,” unity.com Rewarded video inside gaming apps produces opt-in engagement and raises lifetime value metrics, while healthcare apps register 40% higher interaction levels versus static banners. Cost efficiencies appear as exchanges aggregate inventory across publishers, leaving even indie developers with access to premium demand. These efficiencies anchor sustained spending gains and reinforce the Cross Platform and Mobile Advertising Market growth path.
Retail-Media Demand for First-Party Data on Mobile
Retailers running closed-loop attribution inside proprietary shopping apps match ads to cart-level behaviors. Grocery chains that blend loyalty data and location cues now record conversion rates three-to-five times stronger than third-party-cookie display buys.[2]The Trade Desk, “New Retail Data Partnerships,” thetradedesk.com Eliminating middle-layer ad-tech fees, merchants redirect savings into dynamic creative and secure higher margin on-site placements another driver that keeps the Cross Platform and Mobile Advertising Market dynamic.
De-Facto Shift to Privacy-Safe Contextual Targeting
With cookies and identifiers fading, advertisers rely on language models, image recognition, and audio parsing to map content without personal data.[3]Google, “Updated Privacy Sandbox Timeline,” google.com These contextual layers sustain near-behavioral accuracy while dodging consent fatigue under GDPR and CCPA. Automotive apps, for example, fuse location and driving pattern data excluding personal IDs to promote maintenance offers while staying compliant. Such approaches stabilize performance and cement contextual as a long-run engine for the Cross Platform and Mobile Advertising Market.
Generative-AI Creative Optimization at Scale
Large language and diffusion models generate thousands of ad variations, live-testing call-to-action phrases, color schemes, and offers. Financial-services apps applying AI-driven creative report 25% higher click-throughs than static assets. Lower production costs widen access for small brands, and when fused with real-time bidding, creative elements re-compose around signals like weather or live events, ensuring campaigns stay fresh throughout the customer journey.
Restraints Impact Analysis*
| Restraint | (~) % Impact on CAGR Forecast | Geographic Relevance | Impact Timeline |
|---|---|---|---|
| Identifier deprecation and signal loss | -2.8% | Global - EU and California spearhead restrictions | Short term (≤ 2 years) |
| Ad-fraud and viewability gaps | -2.1% | Global - higher fraud in emerging markets | Medium term (2-4 years) |
| Rising user-acquisition costs | -1.9% | Global - gaming and fintech hardest hit | Short term (≤ 2 years) |
| Creative fatigue in saturated app genres | -1.6% | North America, EU, mature Asia-Pacific | Medium term (2-4 years) |
| Source: Mordor Intelligence | |||
Identifier Deprecation and Signal Loss
Apple’s ATT limits drove opt-ins to only 35%, making deterministic attribution scarce. Marketers scramble toward server-side tracking, modeled measurement, and first-party integrations each demanding new tech stacks and fresh skills. Temporary reallocations toward channels with clearer metrics restrain short-run budgets and shave points off the Cross Platform and Mobile Advertising Market trajectory.
Ad-Fraud and Viewability Challenges
Bots simulating scroll depth and session duration erode budgets before detection. Gaming apps face “reward fraud,” where users generate fake events to earn in-game perks, distorting optimization models. Brands respond by layering fraud-detection subscriptions and manual audits, inflating operating costs and dampening ROI until the ecosystem curbs invalid traffic.
*Our forecasts treat driver/restraint impacts as directional, not additive. The impact forecasts reflect baseline growth, mix effects, and variable interactions.
Segment Analysis
By Advertising Format: Video Dominance Drives Engagement
Video ads held 37.43% revenue in 2024, and that leadership remains durable as 5G speeds eliminate buffering and amplify high-definition storytelling. Audio and podcast slots, while holding a smaller base, will grow at a 20.53% CAGR through 2030, capturing commuter and smart-speaker moments. Banner displays persist in information-dense news and finance apps, where unobtrusive footprints maintain reader flow. Playable ads inside gaming titles let prospects test features, elevating conversions among younger cohorts. Native social-feed units integrate into scrolling behavior, softening ad fatigue and sustaining completion metrics. Rich-media creatives now ingest contextual data, changing copy or color on session start. Programmatic pipes route these formats dynamically, sharpening fill rates and raising average CPMs. Lower video-production costs from AI generators democratize high-quality assets, expanding adoption across midsize firms. The segment therefore underpins recurring demand within the Cross Platform and Mobile Advertising Market landscape.
In contrast, audio placements attract brands aiming for hands-free engagement. Contextual host-read messages bring authenticity, and dynamic ad-insertion tools swap copy based on listener location or time of day. Cross-platform planning links podcast touchpoints to in-app coupons, closing the loop for grocery chains and ride-sharing services alike. As media habits diversify, creative mixes broaden, ensuring format innovation fuels the wider Cross Platform and Mobile Advertising Market.


By Platform/Operating System: Android Ecosystem Leadership
Android devices commanded 71.19% user share in 2024, granting the platform decisive reach in emerging markets. The system’s 22.38% CAGR forecast through 2030 rests on affordable 5G handsets across India, Southeast Asia, and Latin America. Automotive OEMs embed Android Automotive, unlocking in-vehicle ad inventory that blends navigation and commerce. Although iOS trails in audience size, its premium demographics hoist monetization yields, sustaining brand spend despite identifier limits. Harmony OS and KaiOS serve regional niches, often tied to national tech strategies or ultra-budget feature phones.
Cross-device identity stitching becomes crucial as advertisers wish to follow a user switching from Android phone to iOS tablet to connected TV. Privacy-preserving IDs meet that need, though complexity raises integration costs. Still, global brands budget for both ecosystems, accepting fragmentation overhead because reach plus revenue lift outweigh the expense another sign of resilience in the Cross Platform and Mobile Advertising Market.
By Placement/Environment: In-App Experiences Prevail
In-app impressions contributed 83.39% revenue in 2024, affirming user preference for seamless experiences. SDK-level access to device sensors accelerometer, camera, location lets marketers tailor messages contextually, spiking engagement. Omnichannel placements that synchronize mobile, CTV, desktop, and DOOH log a 21.11% CAGR outlook as households juggle screens. Browser-based mobile web decelerates, yet remains essential for discovery through search and social shares. In-game ads merge naturally within gameplay billboards in racing titles or branded outfits in role-playing games achieving strong recall with minimal disruption.
Chat and messaging apps weave “click-to-purchase” flows into conversations, shortening the funnel for CPG and fashion. Standardized APIs across placements have lowered integration friction, allowing even niche publishers to sell to large programmatic buyers. Consequently, inventory breadth sustains liquidity and bolsters the Cross Platform and Mobile Advertising Market.
Retail and e-commerce consumed 25.98% of 2024 spend, deploying store-app browsing signals to personalize promotions. Digitally native brands push product carousels tied to real-time inventory, trimming wasted impressions. Healthcare and fitness apps, expanding at 20.44% CAGR to 2030, deliver HIPAA-compliant motivation messages synced with wearable data. Gaming and esports marketers continue deep funnel user-acquisition at scale, balancing revenue with gameplay integrity.
Financial-services firms leverage in-app behavior, detecting mortgage prospects from property-search activity and serving contextually timed offers. Media platforms monetize recommendation surfaces, while automotive players trigger service coupons based on mileage. Telecom operators bundle zero-rating or sponsored-data deals, providing brands with gigabyte subsidies in exchange for impressions. This breadth keeps vertical diversification healthy inside the Cross Platform and Mobile Advertising Market ecosystem.
Geography Analysis
Asia-Pacific led with 42.33% share in 2024, supported by 5G rollouts and 2.6 billion mobile-wallet users in 2025. China’s super-apps link e-commerce, social, and payments, turning every screen into shoppable media, while India’s vernacular creators open new ad inventory in local languages. Japan and South Korea deploy edge-compute nodes that let brands render personalized creative at millisecond speed, and Southeast Asia posts 26% growth in in-app purchase revenue.
The Middle East shows the fastest climb at 20.97% CAGR, as Saudi Arabia’s Vision 2030 and UAE innovation agendas channel over USD 38 billion into gaming and ad-tech infrastructure. MENA ad spend jumped from USD 5.5 billion in 2022 to USD 25.5 billion in 2024. High smart-phone penetration and rising CTV co-viewing turn mobile devices into companion screens, prompting synchronized campaigns.
North America and Europe manage mature but regulation-heavy markets. GDPR and CCPA rules raise compliance costs, steering budgets to platforms offering turnkey consent. Retail-media ascends rapidly as grocers and big-box chains monetize app traffic. South America sees brisk mobile adoption, led by Brazil, though currency swings prompt cautious pacing. African regions embrace leapfrog models mobile money, lightweight apps to unlock advertising even where infrastructure is sparse. Collectively, geographic diversity undergirds the overall Cross Platform and Mobile Advertising Market expansion.

Competitive Landscape
The Cross Platform and Mobile Advertising Market is moderately concentrated, with global platforms blending demand-side, supply-side, and creative services to manage over 10 million bid requests per second at sub-100 millisecond latency. Alphabet, Meta, Unity, AppLovin, InMobi, and Digital Turbine maintain large-scale AI and edge networks, making barriers high for new entrants. Their vertical integration from creation to measurement—contains client churn and captures broader revenue pools.
White-space emerges in privacy-compliant attribution. Start-ups offering clean-room analytics gain traction with brands wanting cross-publisher insights without violating policy. Generative-AI disruptors automate copy, imagery, and even audience simulations, undercutting traditional agency fees. Patent filings in edge-compute optimization, contextual analysis, and fraud mitigation suggest escalating R&D races.
Supply-chain costs for 5G node hosting and compliance auditing compress smaller vendor margins, nudging sector consolidation. Mergers such as LoopMe-Chartboost and acquisitions like T-Mobile-Mint Mobile expand inventory control, illustrating how telcos and ad-tech converge to defend scale economics. Consequently, leadership stability looks secure even as innovation niches keep competitive tension alive.
Cross Platform And Mobile Advertising Industry Leaders
Alphabet Inc. (Google LLC)
Meta Platforms Inc. (Meta Ads)
AppLovin Corporation
Unity Software Inc.
InMobi Pte Ltd.
- *Disclaimer: Major Players sorted in no particular order

Recent Industry Developments
- August 2024: Affle posted 639% revenue growth from FY19 to FY24 by scaling cost-per-conversion models and vernacular ad strategies across India and Asia-Pacific.
- July 2024: T-Mobile acquired Mint Mobile for USD 1.35 billion, unlocking subscriber data-driven ad inventory via integrated telecom services.
- June 2024: AppLovin upgraded its machine-learning bidder, sharply improving gaming user-acquisition efficiency.
- May 2024: Savvy Games Group (Saudi PIF) bought Scopely for USD 4.9 billion, underscoring MENA ambitions in mobile gaming and ads.


Global Cross Platform And Mobile Advertising Market Report Scope
| Banner Display |
| Video (Pre-roll, Rewarded, Out-stream) |
| Native and Social Feed |
| Rich-Media and Playable |
| Audio and Podcast |
| Digital-Out-of-Home (Mobile Triggered) |
| Android |
| iOS |
| Other Platforms |
| In-App |
| Mobile Web Browser |
| In-Game (Intrinsic / Interstitial) |
| Social and Messaging Apps |
| Omnichannel / Cross-Device |
| Retail and E-commerce |
| Gaming and Esports |
| Media and Entertainment (OTT / Streaming) |
| BFSI |
| Healthcare and Fitness |
| Travel and Hospitality |
| Automotive |
| Telecom and IT |
| Others End-use Industries |
| North America | United States | |
| Canada | ||
| Mexico | ||
| Europe | Germany | |
| United Kingdom | ||
| France | ||
| Russia | ||
| Rest of Europe | ||
| Asia-Pacific | China | |
| Japan | ||
| India | ||
| South Korea | ||
| Australia | ||
| Rest of Asia-Pacific | ||
| Middle East and Africa | Middle East | Saudi Arabia |
| United Arab Emirates | ||
| Rest of Middle East | ||
| Africa | South Africa | |
| Egypt | ||
| Rest of Africa | ||
| South America | Brazil | |
| Argentina | ||
| Rest of South America | ||
| By Advertising Format | Banner Display | ||
| Video (Pre-roll, Rewarded, Out-stream) | |||
| Native and Social Feed | |||
| Rich-Media and Playable | |||
| Audio and Podcast | |||
| Digital-Out-of-Home (Mobile Triggered) | |||
| By Platform | Android | ||
| iOS | |||
| Other Platforms | |||
| By Placement / Environment | In-App | ||
| Mobile Web Browser | |||
| In-Game (Intrinsic / Interstitial) | |||
| Social and Messaging Apps | |||
| Omnichannel / Cross-Device | |||
| By End-use Industry | Retail and E-commerce | ||
| Gaming and Esports | |||
| Media and Entertainment (OTT / Streaming) | |||
| BFSI | |||
| Healthcare and Fitness | |||
| Travel and Hospitality | |||
| Automotive | |||
| Telecom and IT | |||
| Others End-use Industries | |||
| By Geography | North America | United States | |
| Canada | |||
| Mexico | |||
| Europe | Germany | ||
| United Kingdom | |||
| France | |||
| Russia | |||
| Rest of Europe | |||
| Asia-Pacific | China | ||
| Japan | |||
| India | |||
| South Korea | |||
| Australia | |||
| Rest of Asia-Pacific | |||
| Middle East and Africa | Middle East | Saudi Arabia | |
| United Arab Emirates | |||
| Rest of Middle East | |||
| Africa | South Africa | ||
| Egypt | |||
| Rest of Africa | |||
| South America | Brazil | ||
| Argentina | |||
| Rest of South America | |||


Key Questions Answered in the Report
How large is the Cross Platform and Mobile Advertising space in 2025?
The Cross Platform and Mobile Advertising market size is USD 290.66 billion in 2025.
What CAGR is expected for spending through 2030?
Total expenditure is forecast to advance at a 20.32% CAGR to hit USD 732.94 billion by 2030.
Which ad format currently generates the most revenue?
Video advertising leads with 37.43% revenue share in 2024.
Why is Asia-Pacific the leading region?
Mobile-first consumers, 5G rollouts, and super-app ecosystems pushed Asia-Pacific to 42.33% global share in 2024.
What makes the Middle East the fastest-growing region?
Vision 2030 investments and sovereign wealth funding drive a 20.97% CAGR outlook through 2030.
How is identifier deprecation affecting campaigns?
Opt-in scarcity forces advertisers toward contextual targeting and first-party data, reducing short-term measurement precision.
Page last updated on:


