Mobile Accessories Market Size and Share
Market Overview
| Study Period | 2020 - 2031 |
|---|---|
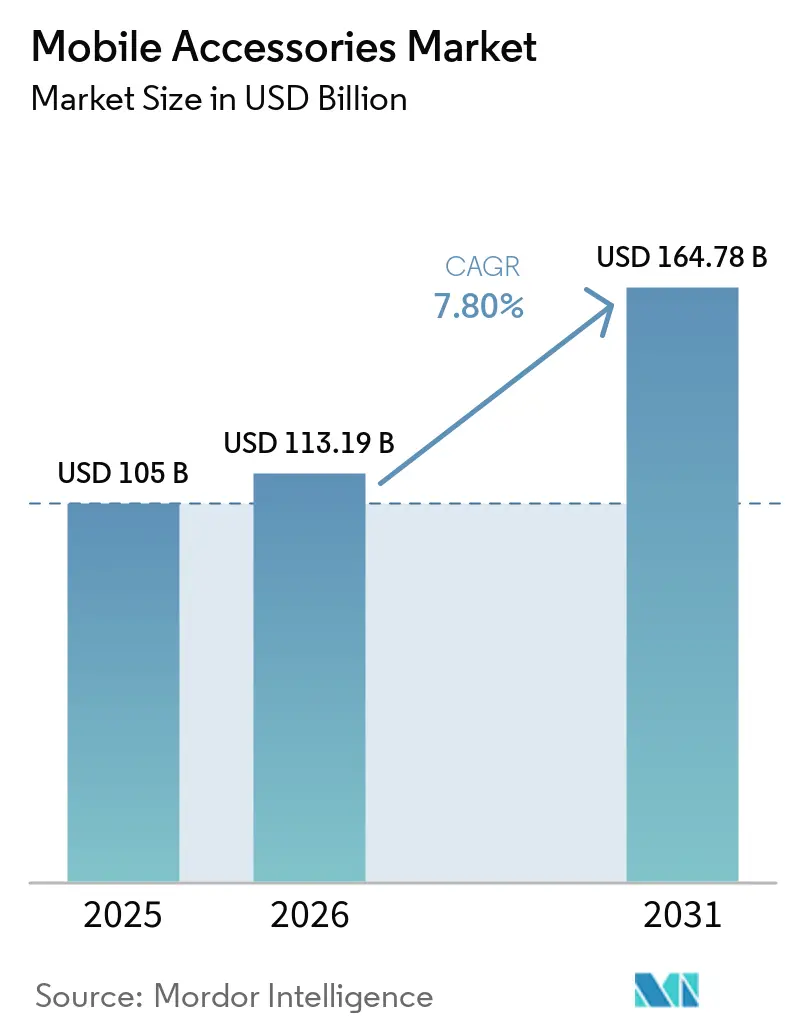
| Market Size (2026) | USD 113.19 Billion |
| Market Size (2031) | USD 164.78 Billion |
| Growth Rate (2026 - 2031) | 7.80% CAGR |
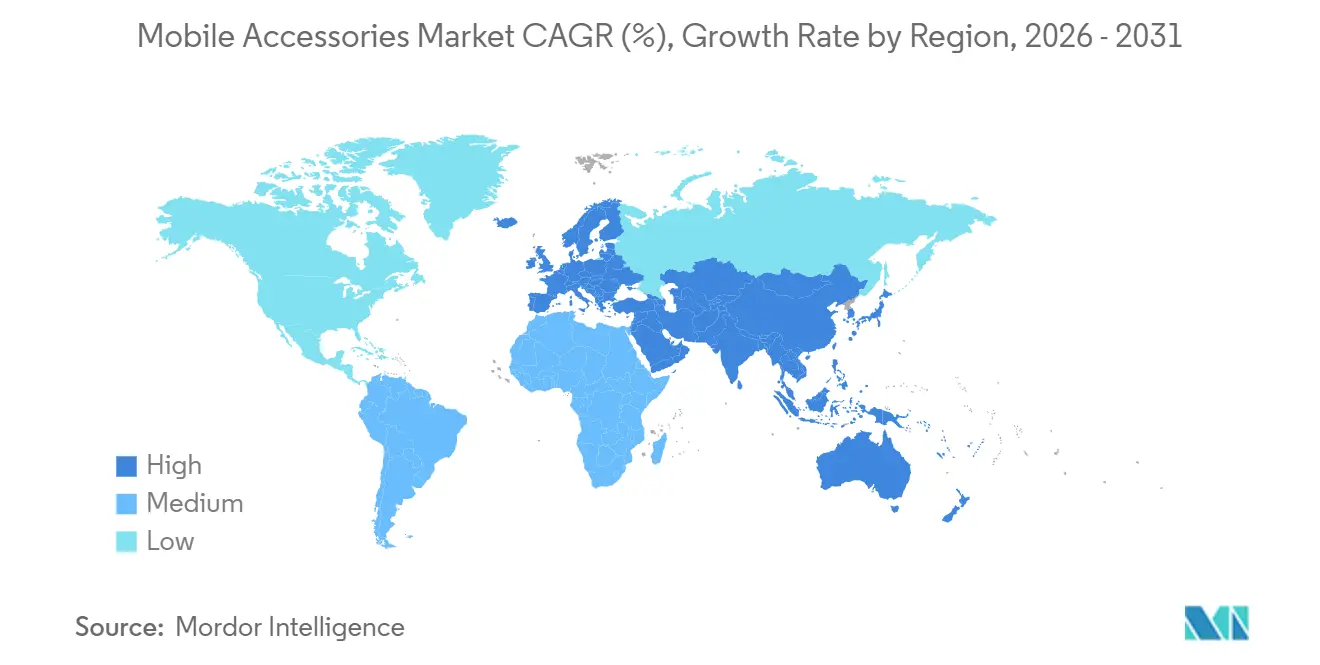
| Fastest Growing Market | Asia Pacific |
| Largest Market | North America |
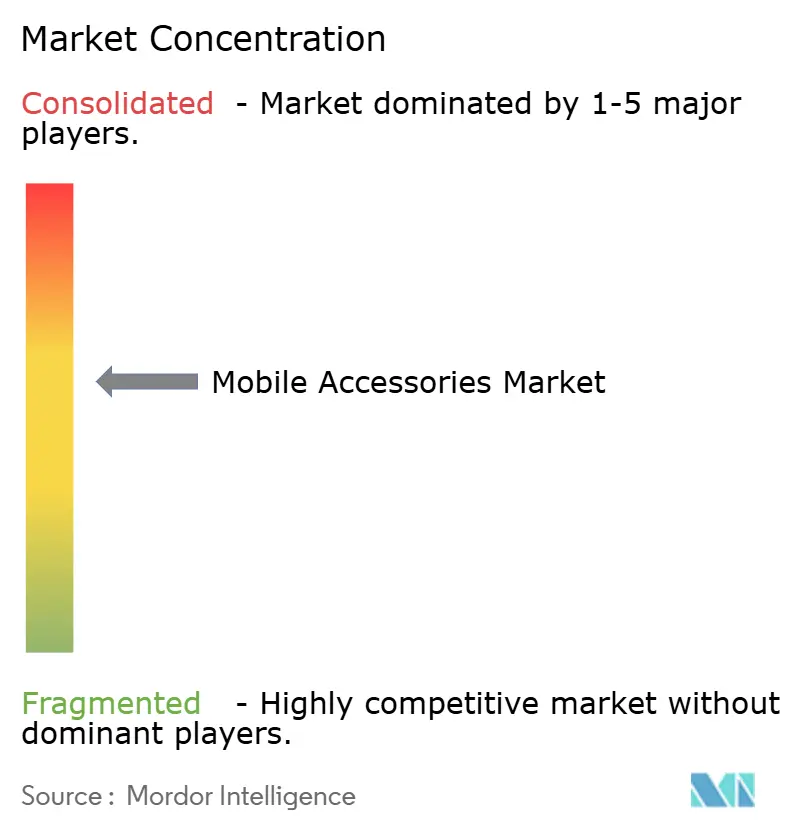
| Market Concentration | Medium |
Major Players*Disclaimer: Major Players sorted in no particular order Image © Mordor Intelligence. Reuse requires attribution under CC BY 4.0. |
|
Mobile Accessories Market Analysis by Mordor Intelligence
The mobile accessories market size stands at USD 113.19 billion in 2026 and is projected to reach USD 164.78 billion in 2031, advancing at a 7.8% CAGR over the forecast period. Robust gallium nitride (GaN) charging technology, USB-C universal charging rules in Europe, and the Qi2 magnetic wireless standard are reducing form-factor, connector, and alignment barriers, encouraging consumers to buy high-value accessories whether or not they upgrade their handsets. Online retail captures rising share as direct-to-consumer models sidestep the 35-45% margin drag of bricks-and-mortar channels, while premium brands exploit ecosystem lock-in to claim price points above USD 50. Universal designs now outsell platform-specific SKUs after the USB-C mandate removed the risk of proprietary interfaces, and Asia-Pacific continues to anchor production scale and deliver the fastest growth, even as the Middle East delivers rapid volume expansion on the strength of near-total smartphone penetration. Competitive pressure intensifies as counterfeit listings erode price ceilings, while extended producer responsibility fees inflate compliance costs for brands without reverse logistics capabilities.
Key Report Takeaways
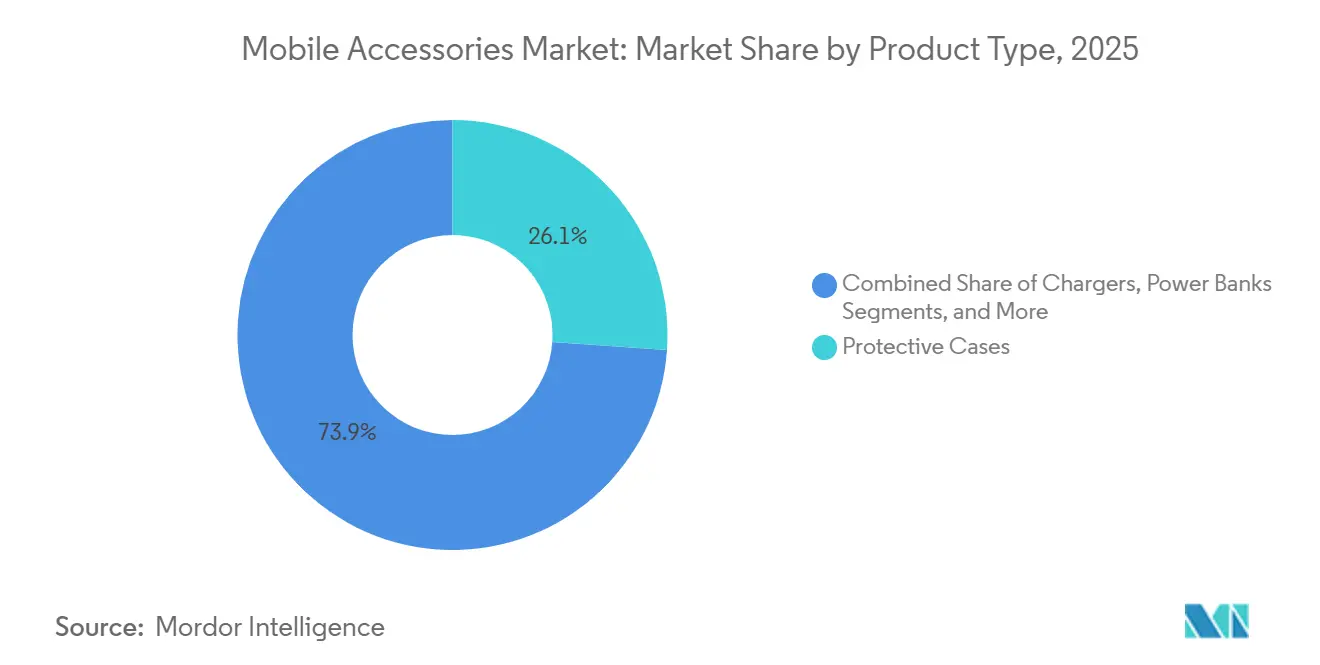
- By product type, protective cases held 26.11% revenue share in 2025, while wireless chargers are forecast to register a 6.96% CAGR through 2031.
- By distribution channel, online retail commanded 54.22% share in 2025 and is set to expand at 7.67% CAGR during 2026-2031.
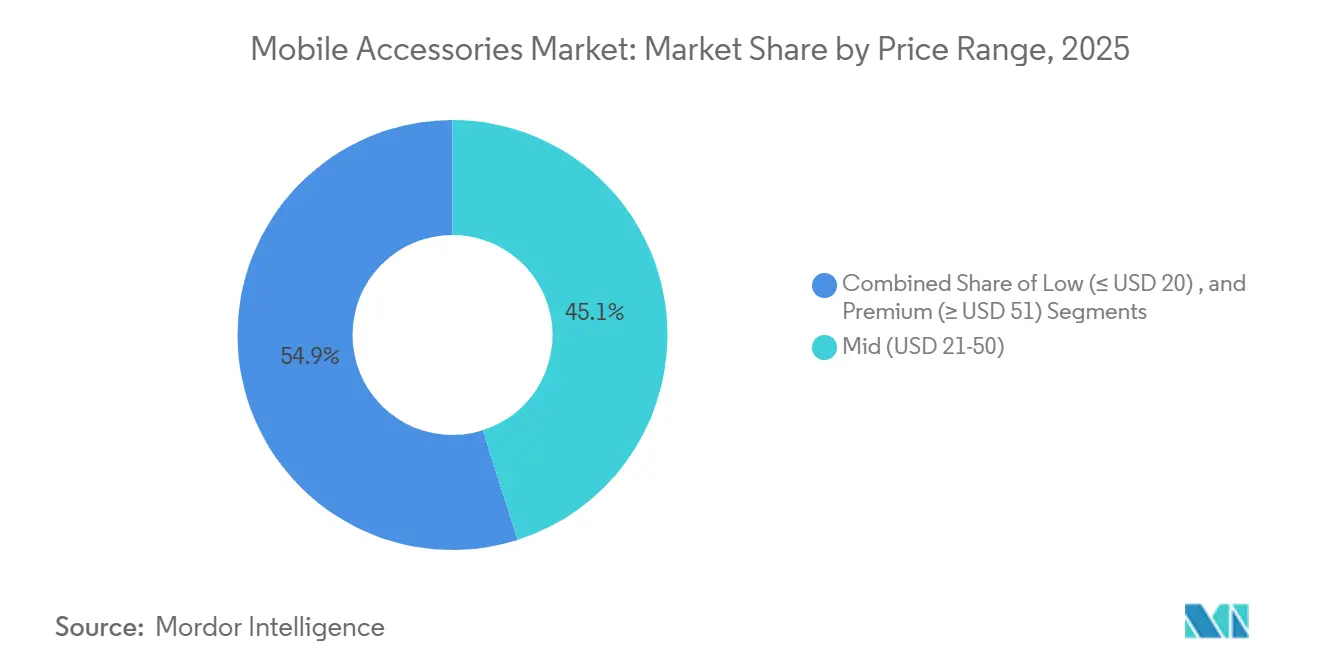
- By price range, the premium tier above USD 51 is poised for 6.87% CAGR to 2031; the mid-tier USD 21-50 held 45.10% share in 2025.
- By compatibility, universal accessories captured 60.12% share in 2025 and are projected to rise at a 7.45% CAGR through 2031.
- By geography, Asia-Pacific led with 39.75% contribution in 2025, whereas the Middle East is expected to post a 7.77% CAGR to 2031.
Note: Market size and forecast figures in this report are generated using Mordor Intelligence’s proprietary estimation framework, updated with the latest available data and insights as of January 2026.
Global Mobile Accessories Market Trends and Insights
Drivers Impact Analysis*
| Driver | (~) % Impact on CAGR Forecast | Geographic Relevance | Impact Timeline |
|---|---|---|---|
| Adoption of GaN technology enabling ultra-compact fast chargers | +2.4% | Global, with early concentration in North America and Asia-Pacific | Medium term (2-4 years) |
| Integration of sustainable materials in accessory manufacturing | +1.8% | Europe and North America, expanding to Asia-Pacific | Long term (≥ 4 years) |
| Growing adoption of wireless audio | +2.1% | Global, led by North America and Europe | Short term (≤ 2 years) |
| Increasing smartphone penetration | +1.6% | Middle East, Africa, Southeast Asia | Medium term (2-4 years) |
| Expansion of e-commerce channels | +1.9% | Global, strongest in Asia-Pacific and Middle East | Short term (≤ 2 years) |
| Rising consumer spending on mobile gaming accessories | +1.2% | North America, Europe, China, South Korea | Medium term (2-4 years) |
| Source: Mordor Intelligence | |||
Adoption of GaN Technology Enabling Ultra-Compact Fast Chargers
Gallium-nitride devices switch at frequencies 10-times higher than silicon, allowing designers to shrink magnetic components by 40% while supporting USB Power Delivery 3.1 Extended Power Range up to 240 W. Anker’s GaNPrime, launched in 2024, delivers 150 W in a brick 30% smaller than legacy silicon equivalents and captured premium share from bundled chargers. ITU’s L.1004 interoperability standard, ratified in 2024, cut certification costs by 20%, helping makers pursue multi-device households.[1]ITU. "L.1004 Standard for Universal Charger Interoperability." 2024. Travelers and airlines value lighter adapters that power laptops, tablets, and phones from one outlet, while yield gains are trimming GaN bill-of-materials by 15-18% per year, protecting margins even as average selling prices soften.
Integration of Sustainable Materials in Accessory Manufacturing
The European Union’s Ecodesign for Sustainable Products Regulation phases in a 25% recycled-plastic requirement for accessories by 2027, forcing redesign of supply chains around post-consumer resin. Apple’s FineWoven MagSafe case contains 68% recycled content and cuts carbon footprint 45%, yet feedback shows early durability compromises. Peak Design added Fair Trade USA labor certification in 2024, spotlighting social compliance in a price-sensitive category. Brands under USD 50 million sales face per-unit testing costs triple those of multinationals, granting scale players a structural edge and accelerating consolidation in cases and cables where composition dictates Restriction of Hazardous Substances compliance.
Growing Adoption of Wireless Audio
True wireless stereo (TWS) earbuds shipped 78.3 million units in Q1 2025, up 18% despite a 3% drop in handset units. LE Audio introduces Auracast broadcast and the LC3 codec, halving power draw and enabling venue audio distribution. Bowers & Wilkins Pi8 earbuds, priced at USD 499, pair Qualcomm aptX Lossless for 24-bit/96 kHz streams, drawing audiophiles willing to pay quadruple mass-market prices. As sub-USD 50 models chase battery and noise-cancel parity, USD 200-plus offerings differentiate through spatial sound and hearing-health features, eroding phone-maker attachment rates and shifting audio revenue to specialists.
Increasing Smartphone Penetration
Smartphone uptake reached 95% in the United Arab Emirates and 87% in Saudi Arabia by 2025, yet accessory attach rates trail North America by 40%, underscoring pent-up demand as e-commerce logistics move beyond major cities. India hosts 750 million devices but spends only USD 12 in accessories per phone, reflecting price sensitivity and informal retail dominance. Sub-Saharan buyers emphasize power banks and solar chargers to offset grid instability, prioritizing capacity over brand. Mid-tier phones priced USD 200-400 dominate emerging markets and require protection to preserve resale value, elongating the accessory revenue tail over multiple owners.
Restraints Impact Analysis*
| Restraint | (~) % Impact on CAGR Forecast | Geographic Relevance | Impact Timeline |
|---|---|---|---|
| Prevalence of counterfeit mobile accessories | -1.7% | Global, acute in Asia-Pacific and online marketplaces | Short term (≤ 2 years) |
| Stricter e-waste regulations raising compliance costs | -1.3% | Europe, expanding to North America and select Asia-Pacific markets | Long term (≥ 4 years) |
| Saturation in replacement accessory cycles | -0.9% | North America and Europe | Medium term (2-4 years) |
| Supply constraints in advanced battery cells for high-capacity power banks | -0.8% | Global, with bottlenecks in China and South Korea | Short term (≤ 2 years) |
| Source: Mordor Intelligence | |||
Prevalence of Counterfeit Mobile Accessories
US Customs and Border Protection seized USD 20.7 million in fake accessories in Q1 2025, 62% of which imitated Apple cables and earbuds. EUIPO estimates EUR 1.3 billion (USD 1.47 billion) in lost sales across member states in 2024. Amazon’s Brand Registry cut complaint rates 25% yet shifted the USD 50 000-200 000 annual policing burden onto brands. Counterfeits anchor consumer price expectations 60-70% lower than genuine items, while legitimate firms divert 8-12% of revenue to authentication tools, nudging them toward owned-web channels where they now capture 35-40% of sales.
Stricter E-waste Regulations Raising Compliance Costs
The European Union extended-producer-responsibility fee of EUR 0.10-0.50 (USD 0.11-0.57) per unit plus collection charges of EUR 0.08-0.15 sparked a compliance-cost surge for small players. France’s repairability index, enacted January 2025, levies fines up to EUR 15 000 on accessories lacking clear disassembly data. ISWA calculates USD 0.5-2 million in up-front investment for tracking and take-back systems, cementing a barrier that favors vertically integrated brands. As designs standardize for recyclability, aesthetic differentiation erodes and commoditization pressures rise.
*Our forecasts treat driver/restraint impacts as directional, not additive. The impact forecasts reflect baseline growth, mix effects, and variable interactions.
Segment Analysis
By Product Type - Wireless Chargers Gain Momentum
Protective cases controlled 26.11% of the mobile accessories market share in 2025, confirming their role as the first add-on after a handset purchase. Wireless chargers, however, are projected to post a 6.96% CAGR that is slightly below the mobile accessories market size baseline, driven by Qi2’s Magnetic Power Profile that lifts power from 15 W to 25 W and guarantees coil alignment, trimming energy loss 30%. Headphones and earbuds form the next-largest slice, propelled by TWS features once found only in premium models.
Power banks struggle with cell supply as battery makers prioritize electric vehicles, curbing high-capacity innovation, while screen protectors and car mounts plateau in low-growth territory. Smartwatch bands emerge as a fresh value pool because wearables refresh more often than phones, letting brands levy 40-60% gross margins. Category dynamics thus bifurcate into commoditized protection-and-charging goods where scale wins, versus ecosystem-anchored SKUs such as MagSafe chargers that sustain premium pricing despite limited technical gaps.


By Distribution Channel - Online Retail Extends Lead
Online storefronts captured 54.22% of 2025 revenue and are slated for 7.67% CAGR as brands hunt data and margin by bypassing store rent and staffing costs. Amazon remains the top discovery venue even where final purchase occurs elsewhere, pressuring sellers to accept 15-20% commissions. Physical outlets, holding 45.78% share, fight falling foot traffic and rising rents that drag productivity below USD 400 per square foot.
Carrier shops lose relevance because device subsidies faded and consumers decouple accessory purchases. Brand-owned stores blend showroom flair with premium attachment, generating 35-40% of gross profit from accessories though they supply only a fifth of sales. In emerging markets, wholesale channels still matter but see margins squeezed as brands partner directly with platforms such as Flipkart and Noon. The EU Digital Services Act raised platform liability costs 12-15% yet boosted shopper trust online, accelerating channel polarization between premium owned-web sales and value-driven marketplaces.
By Price Range - Premium Tier Defies Commoditization
The mid-tier USD 21-50 band held 45.10% share in 2025, but the premium tier above USD 51 will clock a 6.87% CAGR, trailing the 7.8% mobile accessories market baseline. Leica’s LUX Grip at USD 329 and Gucci’s Ophidia case at EUR 290-350 (USD 328-396) illustrate how luxury co-branding monetizes device ecosystems for affluent users. The low-end (≤ USD 20) and premium (≥ USD 51) tiers together account for 54.90% share, with the sub-USD 20 segment posting only 8.90% growth as counterfeits cap prices and squeeze innovation
Bowers & Wilkins Pi8 earbuds priced USD 499 exemplify premiumization in audio, bundling lossless codecs and spatial algorithms to justify four-fold premiums.[2]Bowers & Wilkins. "Pi8 True Wireless Earbuds Product Specifications." 2025. Technical legibility in charging speed, codec bit-rate, and recycled content supports elevated prices, whereas protective cases depend more on brand cachet. Accessory makers thus face a strategic fork: compete on volume efficiency below USD 20 or invest in ecosystem features that uphold premium tickets.
By Compatibility - Universal Designs Widen Reach
Universal accessories owned 60.12% share in 2025 and will advance 7.45% CAGR through 2031 after the USB-C rule erased Lightning exclusivity in Europe. Android-only items serve 72% of phone users but land just 18% of market value due to fragmentation across 1200 plus handset models, limiting economies of scale.
iOS-specific accessories retain 21.88% share because MagSafe’s 340 million installed base anchors charging, mounting, and wallet SKUs, though Qi2’s magnetic upgrade gives Android makers a royalty-free path to parity. Over the outlook, universal designs will dominate commoditized lines such as cables, but proprietary fast-chargers and watch bands will still reward platform control with price premiums.
Geography Analysis
Asia-Pacific contributed 39.75% of 2025 value, anchored by Shenzhen’s factory network and India’s INR 17 000 crore (USD 2.04 billion) production-linked incentives that localize component output. North America’s 28% share faces lengthening handset cycles and category saturation, yet large brands benefit from regulatory demands that smaller rivals cannot meet. Europe’s roughly 22% slice is reshaped by USB-C and e-waste rules that add USD 0.11-0.57 per unit in fees, favoring firms with in-house recycling.
The Middle East, though single-digit in size, is on track for a 7.77% CAGR as 95% smartphone penetration collides with USD 500 billion digital-infrastructure outlays under Saudi Vision 2030.[3]Saudi Vision 2030. "Digital Infrastructure Investment Programs." 2025. South America grows mid-single-digits hindered by import duties up to 60%, triggering local assembly to tap Mercosur tariff breaks. Africa focuses on power continuity products like solar banks because grid reliability trumps brand.
Across regions, mature markets monetize through premium ecosystem gear, whereas emerging economies favor sub-USD 20 basics, creating a dual-speed outlook. Asia-Pacific will stay the volume hub while the Middle East and Southeast Asia capture outsized growth as e-commerce fulfillment penetrates secondary cities.

Competitive Landscape
The top 10 vendors controlled around 42% of global value in 2025. Apple, Samsung, and Xiaomi defend ecosystem margins by embedding proprietary standards such as MagSafe or HyperCharge. Apple alone booked roughly USD 4.8 billion in annual MagSafe accessory revenue at 40-60% premiums over universal substitutes. Incorporating Apple’s magnetic design into Qi2 gives Android brands a free route to parity, eroding that moat over time.
Specialists like Anker and Belkin leverage GaN to ship 240 W USB-C chargers 30% smaller than handset-maker inserts, winning premium buyers through speed and portability rather than lock-in. Marketplace insurgents such as Ugreen and Baseus grow 25-30% per year by exploiting algorithmic visibility and rapid review velocity on Amazon, signaling that operational excellence can outweigh heritage in undifferentiated SKUs.
White-space opportunities lie in hearing-health earbuds, high-recycled-content cases, and modular systems that outlive phone cycles. Compliance overhead from e-waste laws and counterfeit policing shifts advantage to vertically integrated firms with deep logistics, nudging smaller rivals toward acquisition or niche specialization.
Mobile Accessories Industry Leaders
-
Apple Inc.
-
Samsung Electronics Co., Ltd.
-
Sony Corporation
-
Belkin International, Inc.
-
Anker Innovations Limited
- *Disclaimer: Major Players sorted in no particular order

Recent Industry Developments
- July 2025: The Wireless Power Consortium issued Qi2 v2.2.1, lifting magnetic wireless charging from 15 W to 25 W and debuting Active Alignment for moving-coil applications.
- June 2025: Anker committed USD 120 million to a Vietnam GaN-charger plant targeting 15 million units annual output by Q2 2026, cutting logistics costs 18% relative to China.
- March 2025: Samsung unveiled Galaxy Buds3 Pro at USD 249 with Bluetooth 5.4 LE Audio and 35 dB adaptive noise cancelation to undercut AirPods Pro.
- December 2024: The European Union enforced the USB-C universal charging directive, projected to trim 11 000 metric tons of e-waste annually by 2030.


Global Mobile Accessories Market Report Scope
Mobile accessories include any hardware that is not integral to the operation of a mobile smartphone as designed by the manufacturer, and adds utility to the mobile phone.
The Mobile Accessories Market Report is Segmented by Product Type (Headphones/Earbuds, Chargers, Power Banks, Cases, Screen Protectors, Other), Distribution Channel (Online, Offline, Carrier, Brand Stores, Wholesale), Price Range (Low, Mid, Premium), Compatibility (Android, iOS, Universal), and Geography (North America, South America, Europe, Asia-Pacific, Middle East, Africa). Market Forecasts are Provided in Value (USD).
| Headphones / Earbuds |
| Chargers |
| Power Banks |
| Protective Cases |
| Screen Protectors |
| Car Mounts |
| Selfie Sticks and Gimbals |
| Smartwatch Bands and Straps |
| Other Product Types |
| Online Retail |
| Offline Retail |
| Carrier Stores |
| Brand-exclusive Stores |
| Wholesale and Distributors |
| Low (Greater than or equal to USD 20) |
| Mid (USD 21-50) |
| Premium (Less than or equal USD 51) |
| Android-specific Accessories |
| iOS-specific Accessories |
| Universal / Multi-platform Accessories |
| North America | United States |
| Canada | |
| Mexico | |
| South America | Brazil |
| Argentina | |
| Rest of South America | |
| Europe | Germany |
| United Kingdom | |
| France | |
| Italy | |
| Spain | |
| Russia | |
| Rest of Europe | |
| Asia-Pacific | China |
| India | |
| Japan | |
| South Korea | |
| Southeast Asia | |
| Rest of Asia-Pacific | |
| Middle East | Saudi Arabia |
| United Arab Emirates | |
| Turkey | |
| Rest of Middle East | |
| Africa | South Africa |
| Nigeria | |
| Kenya | |
| Rest of Africa |
| By Product Type | Headphones / Earbuds | |
| Chargers | ||
| Power Banks | ||
| Protective Cases | ||
| Screen Protectors | ||
| Car Mounts | ||
| Selfie Sticks and Gimbals | ||
| Smartwatch Bands and Straps | ||
| Other Product Types | ||
| By Distribution Channel | Online Retail | |
| Offline Retail | ||
| Carrier Stores | ||
| Brand-exclusive Stores | ||
| Wholesale and Distributors | ||
| By Price Range | Low (Greater than or equal to USD 20) | |
| Mid (USD 21-50) | ||
| Premium (Less than or equal USD 51) | ||
| By Compatibility | Android-specific Accessories | |
| iOS-specific Accessories | ||
| Universal / Multi-platform Accessories | ||
| By Geography | North America | United States |
| Canada | ||
| Mexico | ||
| South America | Brazil | |
| Argentina | ||
| Rest of South America | ||
| Europe | Germany | |
| United Kingdom | ||
| France | ||
| Italy | ||
| Spain | ||
| Russia | ||
| Rest of Europe | ||
| Asia-Pacific | China | |
| India | ||
| Japan | ||
| South Korea | ||
| Southeast Asia | ||
| Rest of Asia-Pacific | ||
| Middle East | Saudi Arabia | |
| United Arab Emirates | ||
| Turkey | ||
| Rest of Middle East | ||
| Africa | South Africa | |
| Nigeria | ||
| Kenya | ||
| Rest of Africa | ||


Key Questions Answered in the Report
What is the projected revenue for the mobile accessories market in 2031?
The mobile accessories market size is forecast to reach USD 164.78 billion by 2031.
Which product type will register the fastest growth through 2031?
Wireless chargers are expected to expand at a 6.96% CAGR, the fastest among major categories.
Why are universal accessories gaining ground despite platform ecosystems?
Europe’s USB-C mandate and Qi2 magnetic standards eliminate proprietary connectors, letting brands design one SKU for both iOS and Android phones.
How are e-waste regulations influencing competitive dynamics?
Extended-producer-responsibility fees and repairability rules raise per-unit costs, favoring large players with in-house recycling and squeezing smaller brands.
Which region will deliver the highest CAGR over 2026-2031?
Asia Pacific is projected to achieve the highest CAGR over 2026-2031, supported by manufacturing scale, rapid e-commerce adoption, and a large installed smartphone base.
What strategic moves are leaders taking to defend margins against counterfeits?
Brands are shifting 35-40% of online sales to owned websites, embedding authentication chips, and investing in GaN and MagSafe-compatible innovations that counterfeiters struggle to replicate.
Page last updated on:


