
Technology, Media and Telecom
5th MayPricing Strategy for Semiconductor Components
3 Min Read
Transportation Analytics Market is Segmented by Component (Solutions, Services), Type (Descriptive Analytics, Predictive Analytics, Prescriptive Analytics), Deployment (Cloud, On-Premises), Mode of Transport (Roadways, Railways, Airways, Waterways), and by Geography. The Market Forecasts are Provided in Terms of Value (USD).
Market Overview
| Study Period | 2020 - 2031 |
|---|---|
| Market Size (2026) | USD 27.86 Billion |
| Market Size (2031) | USD 91.35 Billion |
| Growth Rate (2026 - 2031) | 26.82 % CAGR |
| Fastest Growing Market | Asia Pacific |
| Largest Market | Europe |
| Market Concentration | Medium |
Major Players *Disclaimer: Major Players sorted in no particular order. Image © Mordor Intelligence. Reuse requires attribution under CC BY 4.0. |
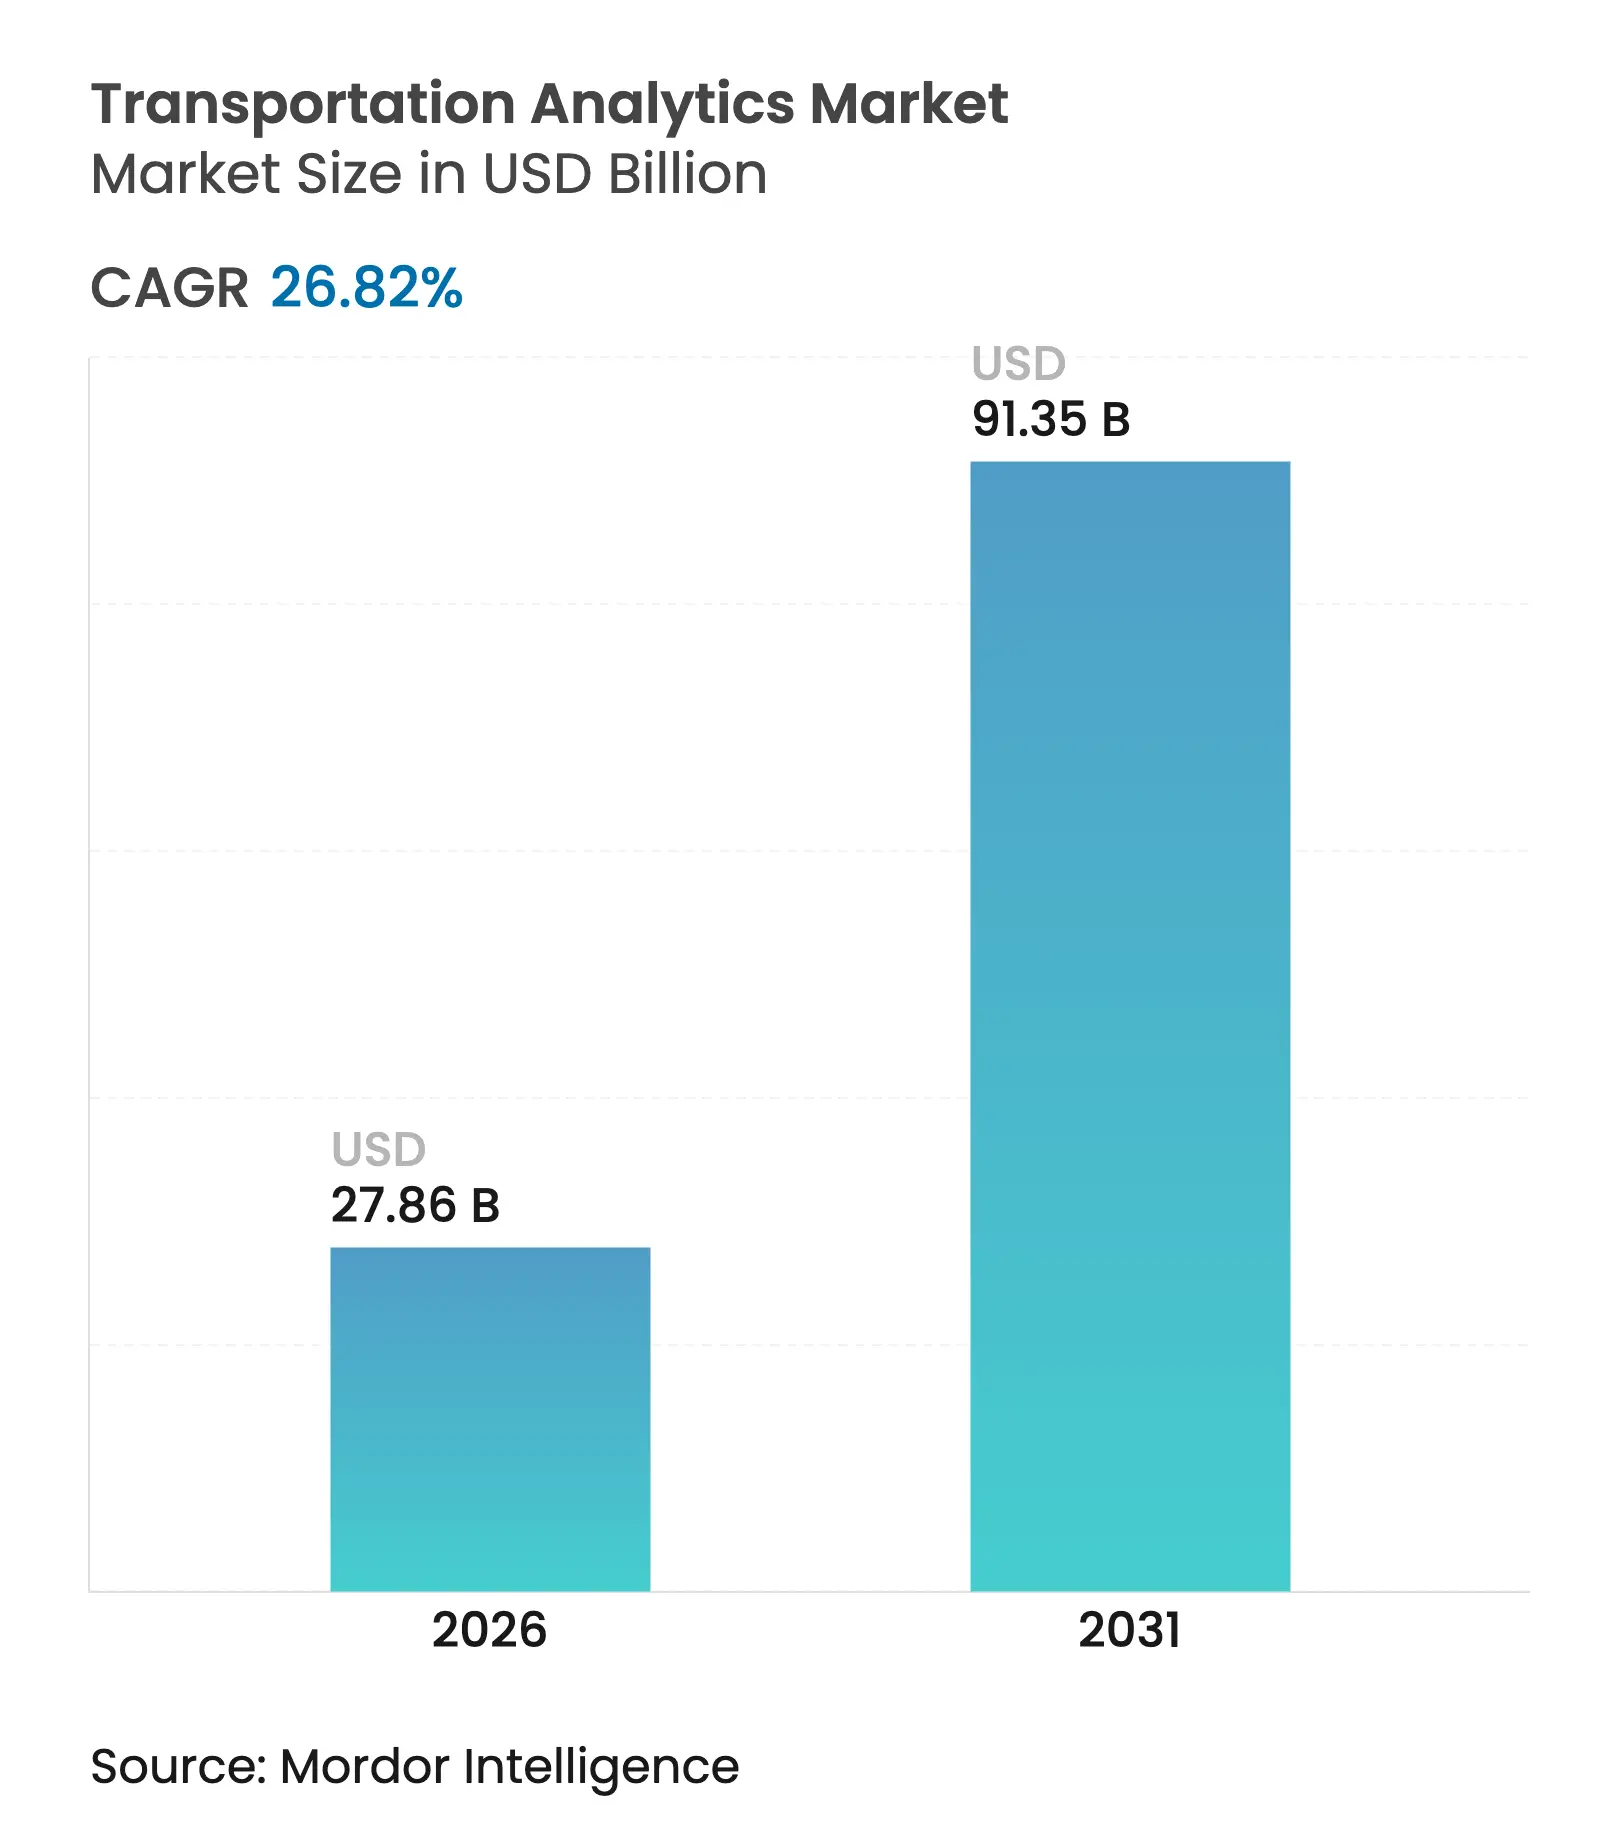
The transportation analytics market size was valued at USD 21.97 billion in 2025 and estimated to grow from USD 27.86 billion in 2026 to reach USD 91.35 billion by 2031, at a CAGR of 26.82% during the forecast period (2026-2031). Aggressive smart-city programs, rising e-commerce parcel volumes, and inexpensive cloud storage are driving rapid platform roll-outs that collect, clean, and analyze traffic, fleet, and safety data at city and corridor scale. Government Vision Zero targets are mandating data-driven crash-reduction plans, while AI-enabled sensors and connected-vehicle feeds are expanding the available data pool. At the same time, ubiquitous 5G coverage and satellite IoT links are closing long-standing connectivity gaps, making real-time decision support feasible even in rural corridors. Vendors able to combine multimodal data lakes with privacy-preserving learning tools are well positioned as transportation agencies demand both insights and compliance guarantees. Competitive intensity remains high as cloud hyperscalers, industrial automation majors, and analytics specialists all vie to secure platform contracts that often span ten-year upgrade cycles.
Key Report Takeaways
Note: Market size and forecast figures in this report are generated using Mordor Intelligence's proprietary estimation framework, updated with the latest available data and insights as of 2026.
Drivers Impact Analysis
| Driver | % Impact on CAGR Forecast | Geographic Relevance | Impact Timeline | |||
|---|---|---|---|---|---|---|
Smart-city investments driving nationwide
traffic-management analytics
Smart-city investments driving nationwide
traffic-management analytics
| 8.2% | Global, with early gains in North America, Europe, and Asia Pacific urban centers | Medium term (2-4 years) |
% Impact on CAGR Forecast
:
8.2%
|
Geographic Relevance
:Global, with early gains in North America, Europe, and
Asia Pacific urban centers |
Impact Timeline
:
Medium term (2-4 years)
|
Explosive e-commerce fuelling real-time fleet optimisation
demand
Explosive e-commerce fuelling real-time fleet optimisation
demand
| 7.8% | Global, with highest impact in North America and Europe | Short term (≤ 2 years) | |||
Falling cloud-storage costs enabling multi-modal data
lakes
Falling cloud-storage costs enabling multi-modal data
lakes
| 6.1% | Global, with accelerated adoption in Asia-Pacific and emerging markets | Short term (≤ 2 years) | |||
Government Vision-Zero road-safety mandates boosting
analytics spend
Government Vision-Zero road-safety mandates boosting
analytics spend
| 5.4% | North America and Europe primarily, expanding to Asia-Pacific | Medium term (2-4 years) | |||
Edge-based federated learning improves privacy-compliant
data sharing
Edge-based federated learning improves privacy-compliant
data sharing
| 3.2% | Global, with early adoption in regulated markets | Long term (≥ 4 years) | |||
Satellite-AIS and drone imagery fusion unlocking corridor
analytics
Satellite-AIS and drone imagery fusion unlocking corridor
analytics
| 2.8% | Global, with maritime and aviation corridors leading | Long term (≥ 4 years) | |||
| Source: Mordor Intelligence | ||||||
Smart-city investments driving nationwide traffic-management analytics
Large municipal grants are funding dense networks of AI cameras, lidar, and atmosphere sensors that stream into centralized dashboards, allowing traffic engineers to adjust signal timing in real time and publish multimodal journey advice to travelers.[1]Rekor Systems, “Strategic Corridor Monitoring,” rekor.ai Federal Transit Administration pilots, such as dynamic micro-transit dispatch in South Dakota, demonstrate how predictive routing improves on-time performance for paratransit fleets. European metros including Hamburg use enterprise analytics suites to avert bottlenecks by forecasting congestion up to two hours ahead. Academic studies from Poland report measurable CO₂ cuts once adaptive signals and smart parking enter full operation. Each successful deployment creates demonstration effects that accelerate procurement in neighboring cities, reinforcing a positive adoption cycle.
Explosive e-commerce fueling real-time fleet optimisation demand
Parcel operators are embedding AI schedulers that synthesise order spikes, traffic flow, and driver hours into updated route plans every few minutes. FedEx has rolled out sensor-rich devices that geotag every package movement, cutting search time for misplaced parcels. Walmart applies deep-learning demand forecasts to align inventory with trucking capacity, smoothing warehouse dock utilisation. Japanese forwarder Nippon Express acquired Singapore’s SWAT Mobility to gain dynamic routing algorithms that shave fuel costs and mitigate driver shortages. As same-day delivery becomes the norm, predictive and prescriptive analytics turn into indispensable cost-containment tools for logistics carriers.
Falling cloud-storage costs enabling multimodal data lakes
Prices for object storage and GPU compute continue to decline, letting mid-sized transit agencies create petabyte-scale archives of historical AVL, CCTV, and fare-collection data. Microsoft’s transportation reference stack merges Azure IoT Edge, Maps, and Synapse services so operators can ingest and analyze telematics feeds without procuring on-premises hardware. SAP is extending its Business Technology Platform to additional data-center regions, reducing latency for interactive dashboards and machine-learning training.[2]SAP SE, “Hamburg Uses SAP Technology to Prevent Traffic Congestion,” news.sap.com Edge nodes placed inside buses and freight trailers pre-process HD video, sending only compressed metadata to the cloud, which further shrinks bandwidth bills while preserving analytic depth. The economics now favor continuous high-resolution monitoring rather than periodic traffic counts.
Government Vision Zero road-safety mandates boosting analytics spend
City and state DOTs must demonstrate year-on-year crash reductions, prompting investment in platforms that combine connected-vehicle speed data, historical crash maps, and demographic equity layers. New York City deploys AI classifiers that flag speeding hotspots and near-miss incidents in school zones. Flow Labs aggregates probe-vehicle telemetry to create surrogate safety metrics—hard braking, red-light running—that guide targeted engineering fixes. The U.S. Department of Transportation’s ARPA-I program highlights data fusion across traffic, freight, and asset health as a core requirement for Vision Zero compliance. Vendors able to offer out-of-the-box algorithms that quantify safety benefits gain an edge in competitive procurements.
Restraints Impact Analysis
| Restraint | (~) % Impact on CAGR Forecast | Geographic Relevance | Impact Timeline | |||
|---|---|---|---|---|---|---|
Persistent data-security and cyber-risk concerns in open
data platforms
Persistent data-security and cyber-risk concerns in open
data platforms
| -4.3% | Global, with highest impact in regulated industries | Short term (≤ 2 years) | (~) % Impact on CAGR Forecast:
-4.3%
|
Geographic Relevance
:
Global, with highest impact in regulated industries
|
Impact Timeline
:
Short term (≤ 2 years)
|
Legacy ITS infrastructure compatibility constraints
Legacy ITS infrastructure compatibility constraints
| -3.8% | North America and Europe primarily, with aging infrastructure | Medium term (2-4 years) | |||
Algorithmic bias attracting regulatory scrutiny
Algorithmic bias attracting regulatory scrutiny
| -2.1% | Global, with strongest impact in North America and Europe | Medium term (2-4 years) | |||
Carbon-accounting audits demanding verified data
provenance
Carbon-accounting audits demanding verified data
provenance
| -1.6% | Europe and North America leading, expanding globally | Long term (≥ 4 years) | |||
| Source: Mordor Intelligence | ||||||
Persistent data-security and cyber-risk concerns in open data platforms
Ransomware attacks on ticketing and signal systems have raised alarms about exposing operational technology networks to the public cloud. The Federal Transit Administration warns that smaller agencies lack resources to implement zero-trust architectures and continuous monitoring, urging federal assistance and workforce training.[3]Digital Transit Limited, “IEC 63452 Railway Cybersecurity Standard,” digitaltransit.uk Rail operators are adopting the IEC 63452 standard, which blends safety and cybersecurity engineering from project inception through de-commissioning, but compliance adds both time and cos. Connected-vehicle interfaces enlarge the attack surface, forcing platform vendors to certify cryptographic modules and over-the-air patch pipelines before systems can go live. As a result, procurement cycles lengthen and some agencies opt for on-premises deployment despite the higher CapEx.
Legacy ITS infrastructure compatibility constraints
Many traffic signal controllers, wayside detectors, and radio networks installed two decades ago transmit data only every five minutes or use proprietary protocols. Integrating these assets requires protocol converters and middleware that inflate project budgets. Research into roadside-unit deterioration shows that partial upgrades can trigger cascading maintenance once heavy vehicles start using connected-corridor lanes. Agencies must therefore stage roll-outs, replacing controllers in critical corridors first, which slows overall analytics adoption. Integration specialists that can wrap legacy devices with secure APIs find steady demand, but the pace of wholesale modernization in North America and Europe remains constrained by fiscal realities.
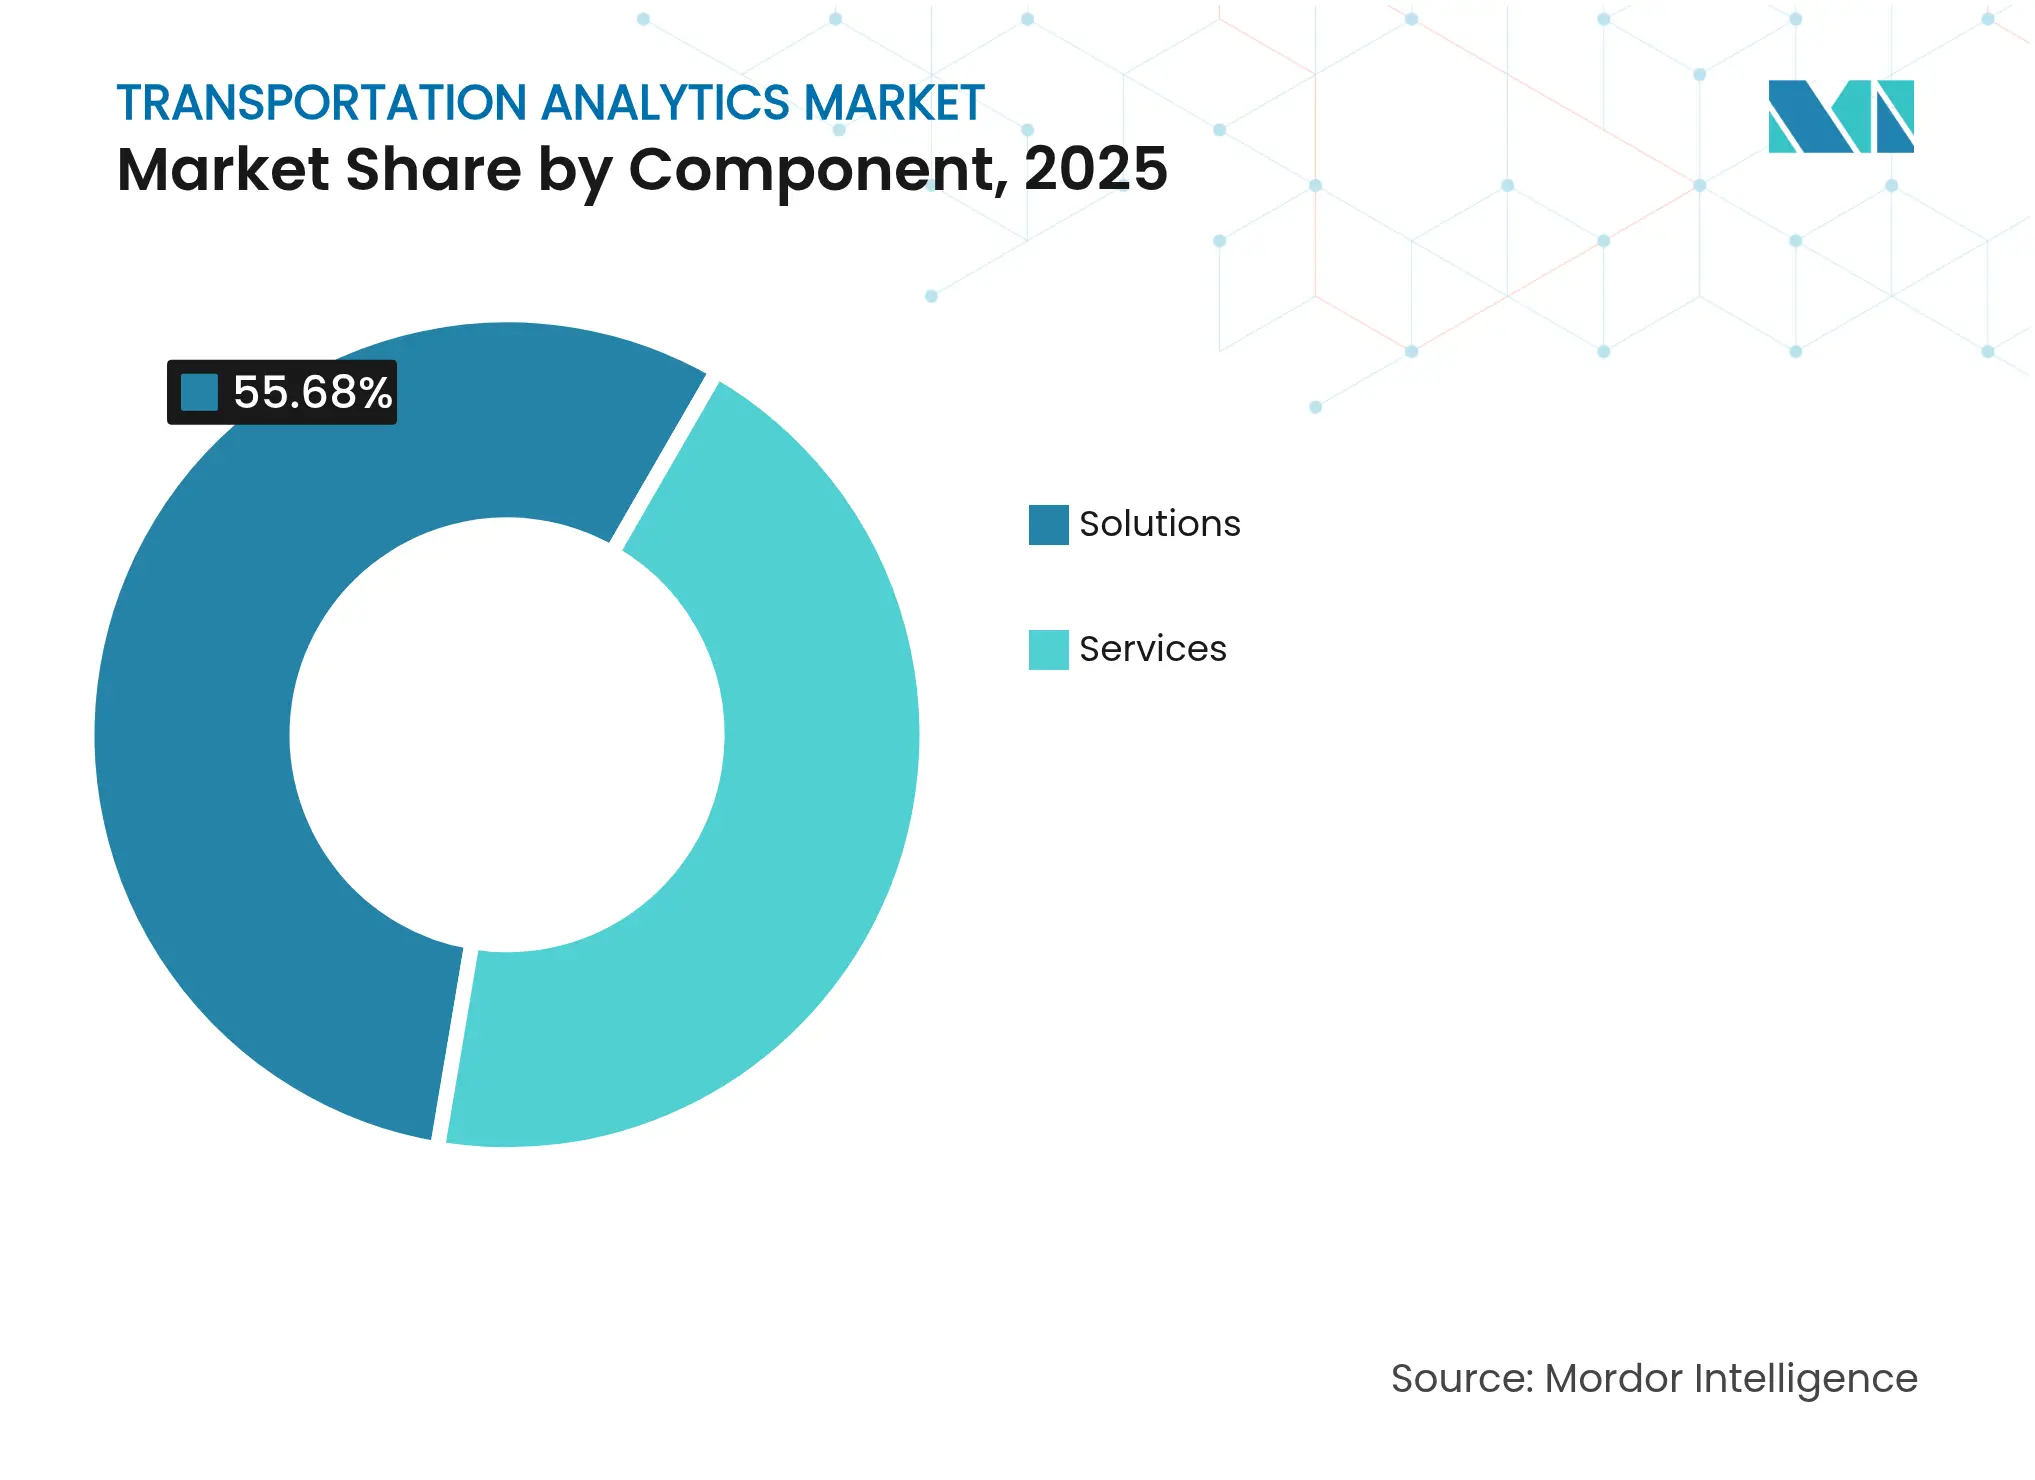
By Component: Solutions dominate while services accelerate
The solutions segment generated 55.68% of 2025 revenue, underscoring agencies’ initial focus on acquiring core platforms for traffic management, passenger information, and freight optimisation. Services revenue is rising faster at a 27.15% CAGR as operators realise they need ongoing data engineering, model tuning, and 24/7 system support. The transportation analytics market size for services is projected to widen steadily alongside platform refreshes that bundle managed services agreements.
Demand for implementation expertise is especially high when agencies migrate from pilot projects to city-wide deployments. Managed analytics centres handle model versioning, anomaly detection, and cybersecurity patching, freeing municipal IT teams to concentrate on policy enforcement. IBM’s shift toward generative-AI advisory offerings illustrates how global consultancies are extending beyond installation to continuous performance improvement. This trend positions services as a stable annuity stream within the transportation analytics industry.
Note: Segment shares of all individual segments available upon report purchase
By Type: Predictive leads yet prescriptive grows fastest
Predictive analytics captured 43.35% revenue in 2025, reflecting its use in congestion forecasting and fleet maintenance scheduling. However, prescriptive engines that recommend signal plans, vehicle rebalancing, or runway sequencing are forecast to expand at 28.44% CAGR, outpacing descriptive and predictive tools. A notable example is MIT’s predictive-prescriptive model that trimmed ride-hail wait times by rebalancing idle vehicles in real time. As agencies trust algorithmic recommendations, decision-support screens evolve into closed-loop optimisers that actuate field devices automatically. The transportation analytics market will therefore pivot from insight generation to action orchestration, further increasing demand for integrated optimisation solvers.
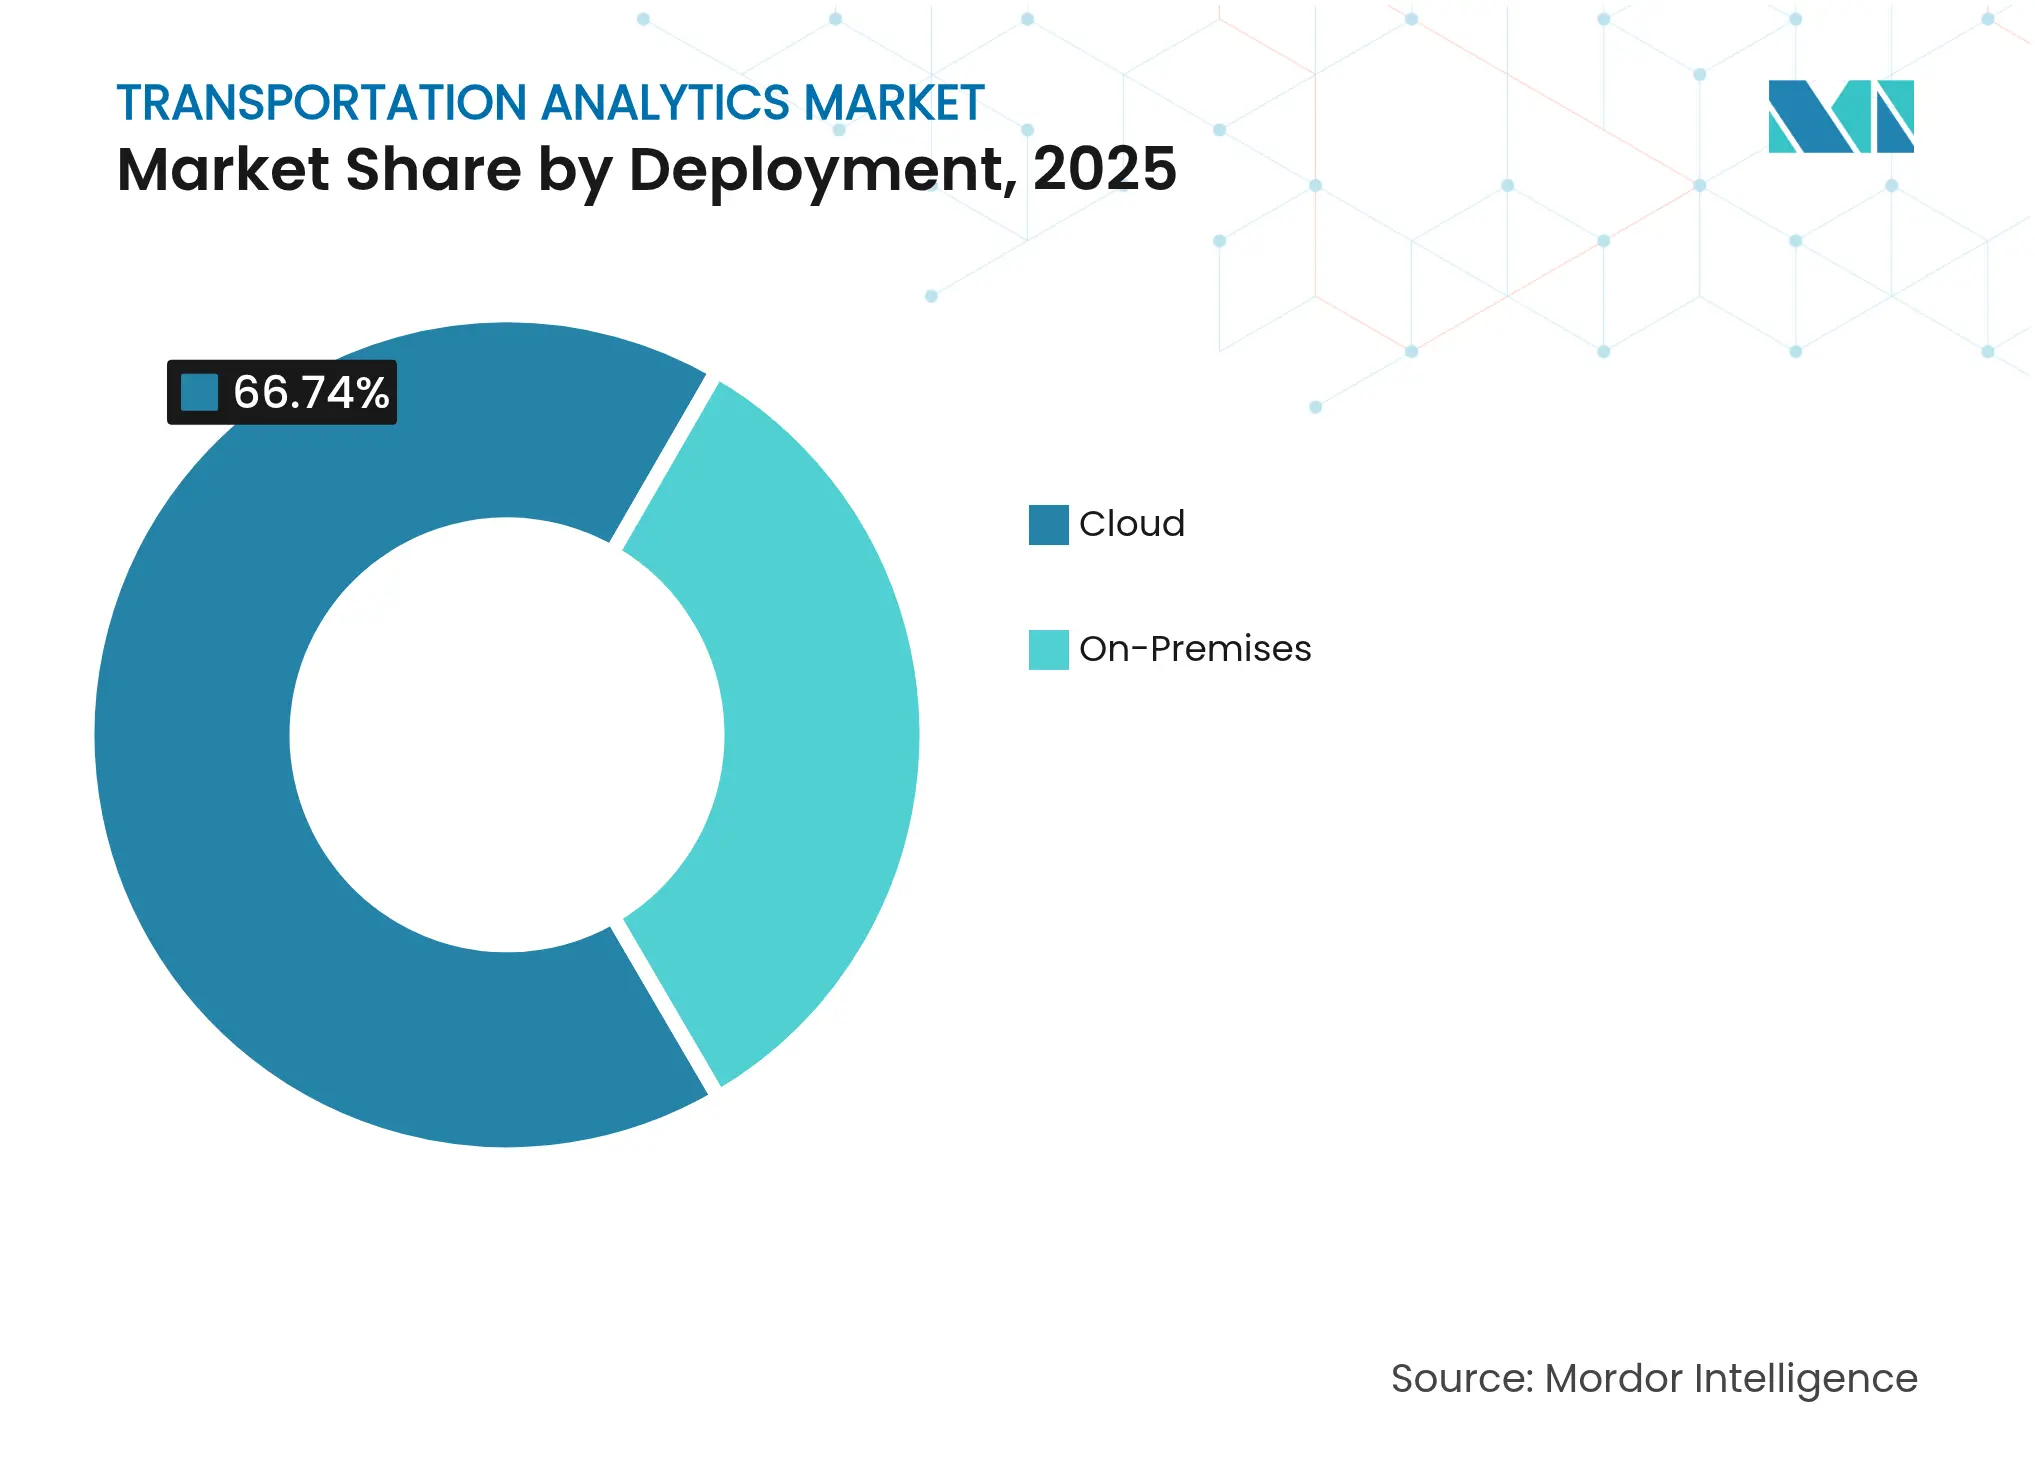
By Deployment: Cloud dominance shapes infrastructure strategy
Cloud deployments held 66.74% of 2025 spending and will maintain leadership as operators prioritize elasticity, high availability, and pay-as-you-go economics. The transportation analytics market size for cloud solutions is projected to expand rapidly because GPU-intensive video analytics and large-language-model customer interfaces scale better in shared environments. Organizations with strict sovereignty rules still procure on-premises clusters but often add cloud bursting for peak demand. Hybrid architectures place inference models at the edge—inside buses or trackside cabinets—while streaming summaries to regional clouds for training and visualization. Edge-to-cloud symmetry reduces latency for safety-critical use cases without abandoning centralised governance.
Note: Segment shares of all individual segments available upon report purchase
By Mode of Transport: Roadways lead, aviation surges
Roadways commanded 46.62% revenue in 2025, driven by urban congestion management and highway freight optimisation projects. The airways segment is forecast to log the highest 27.95% CAGR as airlines deploy flight-path optimisation to trim fuel burn and emissions. Viasat reports that satellite-enabled route planning can cut cruise distance by up to 2% on transcontinental flights. Railways remain stable adopters of asset-health analytics, while maritime operators embrace satellite-AIS fusion to monitor remote sea lanes. Vendors offering cross-modal dashboards have an opportunity to harmonise KPIs—delay minutes, capacity utilisation—across the full mobility chain, positioning themselves as orchestrators of end-to-end journeys in the transportation analytics market.
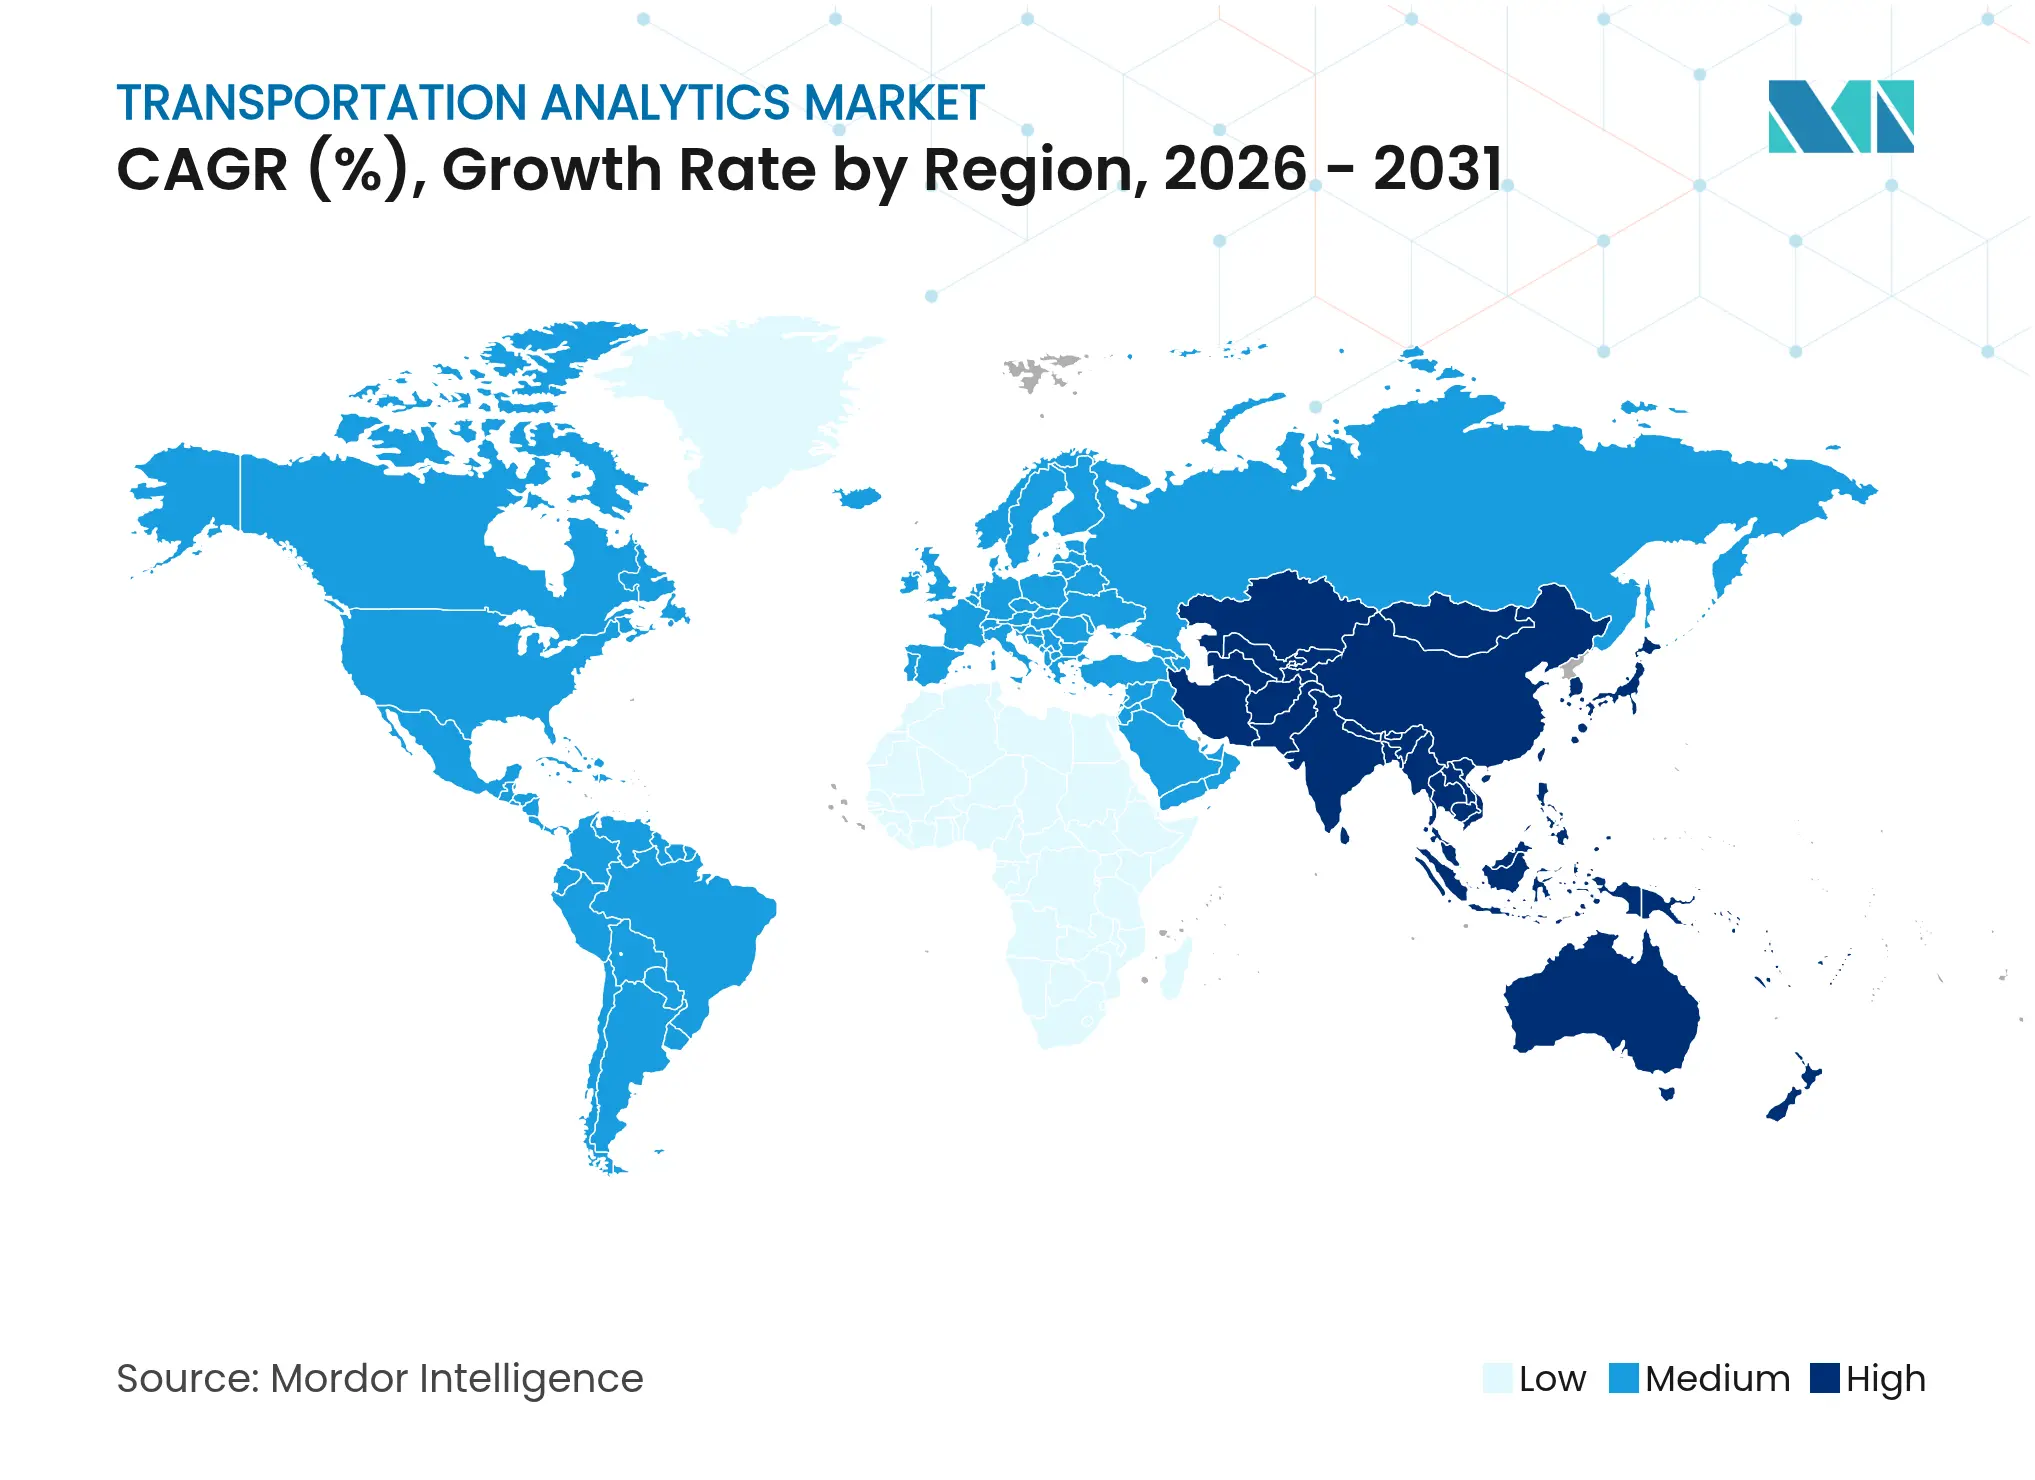
Europe retained leadership with 34.12% 2025 revenue owing to strong data-privacy laws and early smart-city investments that encourage platformised traffic management. German cities showcase predictive congestion avoidance using enterprise software that links incident feeds, parking-bay sensors, and public-transit headways. The IEC 63452 railway cybersecurity framework, published in 2025, offers a harmonised baseline that accelerates procurement across EU member states. Vision Zero directives and carbon-pricing schemes further compel agencies to document safety and emissions outcomes using advanced analytics.
Asia-Pacific is the fastest-growing region at a 27.14% CAGR. E-commerce hotspots such as Shenzhen, Singapore, and Bengaluru require high-frequency logistics planning, pushing carriers to ingest live congestion, weather, and customs-clearance data. GEODIS extended its secure road network from Singapore to China, embedding IoT devices that report vehicle location every minute. DACHSER aims for 10% of corporate revenue from APAC, highlighting logistics-sector confidence in regional digital infrastructure growth. National AI roadmaps in India and Singapore provide funding pools that lower barriers for small fleets to adopt subscription-based analytics.
Market Concentration
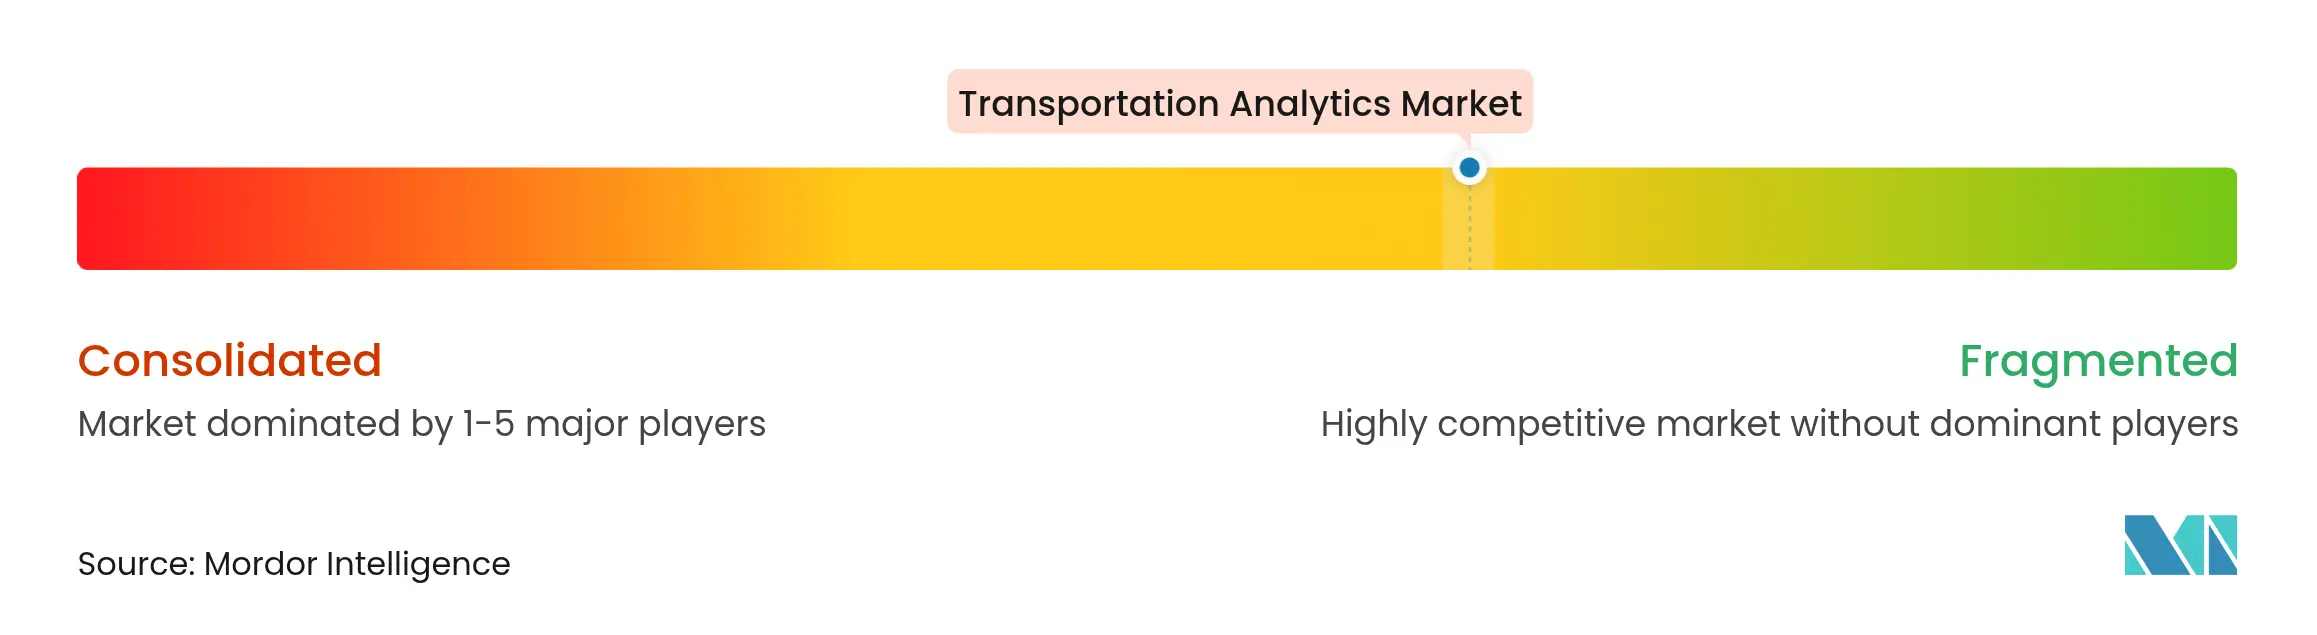
Competition is moderately fragmented, with no single vendor holding double-digit global share. Cloud hyperscalers leverage massive AI budgets to embed analytics into their IoT suites, while industrial vendors integrate analytics into signal controllers, onboard units, and ticketing devices. Rekor Systems expanded traffic-sensor coverage by acquiring All Traffic Data Services, adding twenty-year datasets that boost model accuracy in Western U.S. corridors. Microsoft bundles digital-twin tooling with edge inference kits, reducing integration friction for transit agencies. Siemens Mobility pairs SCADA and analytics under one contract, capturing upgrade cycles when railroads renew signalling and rolling-stock telemetry.
Niche specialists differentiate on modal depth. Flow Labs focuses on connected-vehicle safety analytics; Viasat provides aviation SATCOM links plus analytics; SWAT Mobility targets ASEAN last-mile routing. Their success signals white-space for vendors that can solve domain-specific issues such as airline gate conflicts or maritime berth allocation. Platform openness is a growing tender criterion, with agencies insisting on API access and algorithmic transparency to audit bias and fairness.

*Disclaimer: Major Players sorted in no particular order
1. INTRODUCTION
2. RESEARCH METHODOLOGY
3. EXECUTIVE SUMMARY
4. MARKET LANDSCAPE
5. MARKET SIZE AND GROWTH FORECASTS (VALUE)
6. COMPETITIVE LANDSCAPE
7. MARKET OPPORTUNITIES AND FUTURE OUTLOOK
Transportation analytics searches for patterns, anomalies, and opportunities for improvement. It uses data collection and data analysis methods to gain insights into the different aspects of transportation services.
The transportation analytics market is segmented by component (solution, services), by type (descriptive analytics, predictive analytics, prescriptive analytics), by deployment (cloud, on-premises), by mode of transport (roadways, railways, airways, waterways), by geography (North America, Europe, Asia-Pacific, Latin America, Middle East and Africa). The market sizes and forecasts are provided in terms of value (USD) for all the above segments.
Pricing Strategy for Semiconductor Components
3 Min Read
Accelerating Additive Manufacturing Adoption in India
3 Min Read
When decisions matter, industry leaders turn to our analysts. Let’s talk.