
Business Analytics Market Size and Share
Market Overview
| Study Period | 2020 - 2031 |
|---|---|
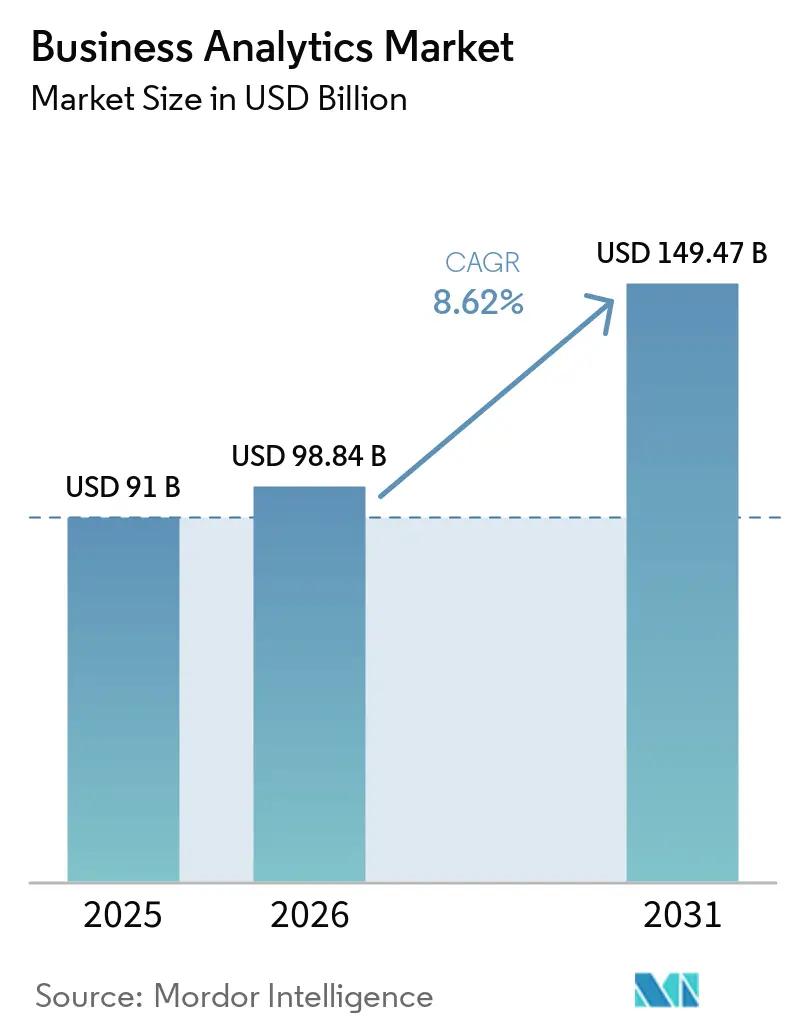
| Market Size (2026) | USD 98.84 Billion |
| Market Size (2031) | USD 149.47 Billion |
| Growth Rate (2026 - 2031) | 8.62 % |
| Fastest Growing Market | Asia Pacific |
| Largest Market | North America |
| Market Concentration | Medium |
Major Players *Disclaimer: Major Players sorted in no particular order Image © Mordor Intelligence. Reuse requires attribution under CC BY 4.0. | |
Business Analytics Market Analysis by Mordor Intelligence
The business analytics market size was valued at USD 91 billion in 2025 and estimated to grow from USD 98.84 billion in 2026 to reach USD 149.47 billion by 2031, at a CAGR of 8.62% during the forecast period (2026-2031). Cloud-native platforms, AI-driven automation, and a widespread push for digital transformation underpin this expansion. Organizations across industries now embed analytics into day-to-day workflows to uncover inefficiencies, sharpen customer engagement, and shorten decision cycles. The convergence of artificial intelligence with established analytics stacks is shifting the discipline from retrospective reporting toward real-time predictive intelligence, while pervasive cloud adoption lowers entry barriers for firms of every size. Competitive intensity remains lively as incumbent enterprise software vendors revamp portfolios to match the pace set by cloud specialists and AI-first start-ups that promise faster deployment and simpler user experiences. Talent shortages, data-sovereignty rules, and high initial costs continue to temper growth yet have not derailed the structural migration toward data-centric operations.
Key Report Takeaways
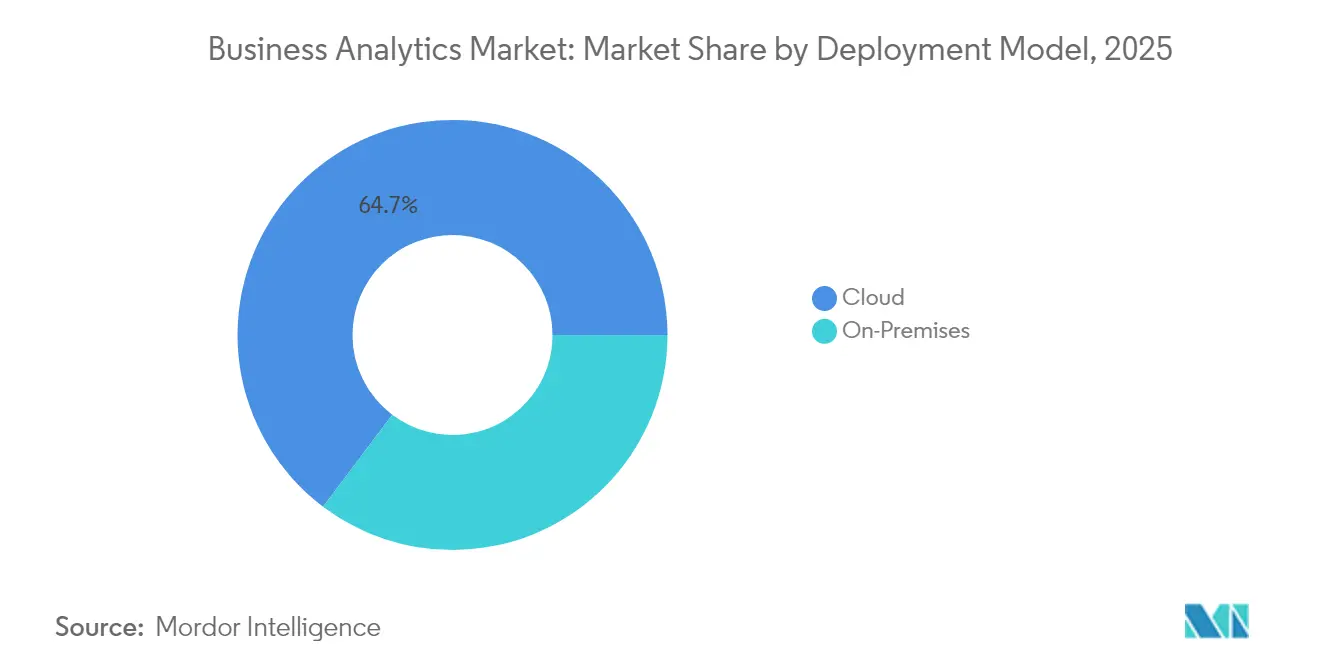
- By deployment model, the cloud segment captured 64.72% of business analytics market share in 2025 and is expanding at a 10.18% CAGR through 2031.
- By analytics type, descriptive analytics held 32.05% of revenue in 2025, while predictive analytics is forecast to grow at an 8.74% CAGR to 2031.
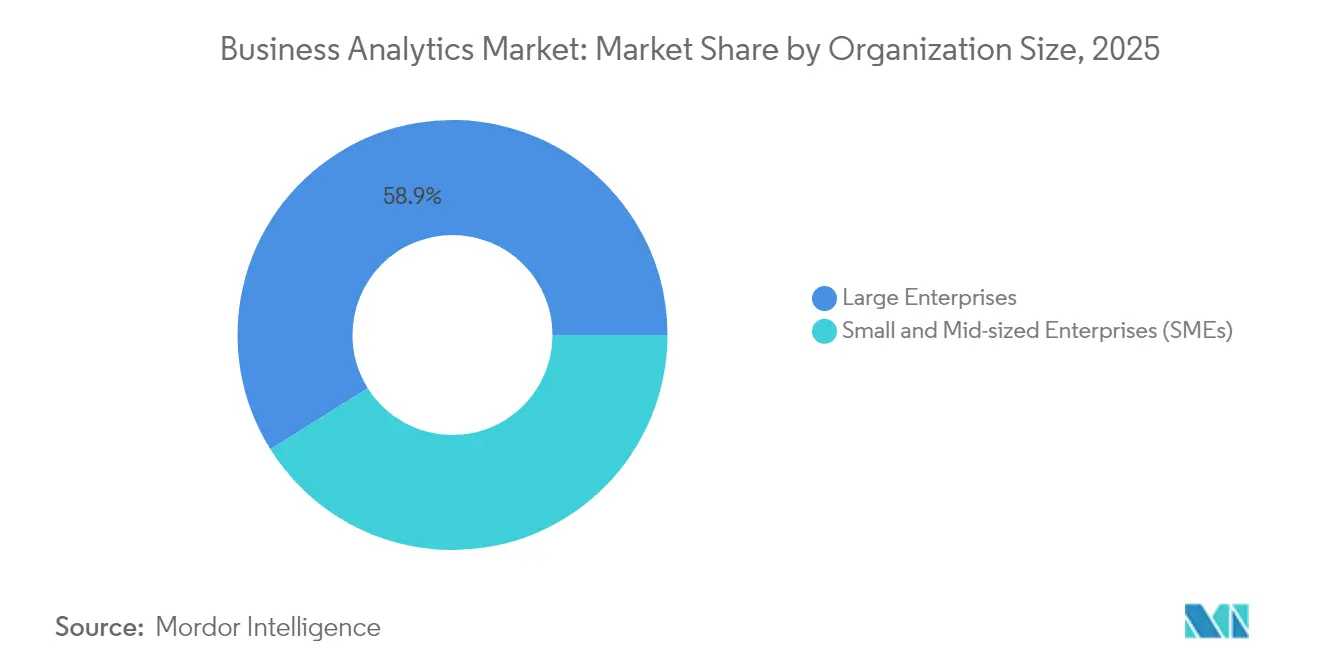
- By organization size, large enterprises commanded 58.92% share of the business analytics market size in 2025; small and mid-sized enterprises post the fastest growth at 8.98% CAGR.
- By end-user industry, BFSI led with 27.95% revenue share in 2025; healthcare and life sciences is projected to advance at a 9.31% CAGR.
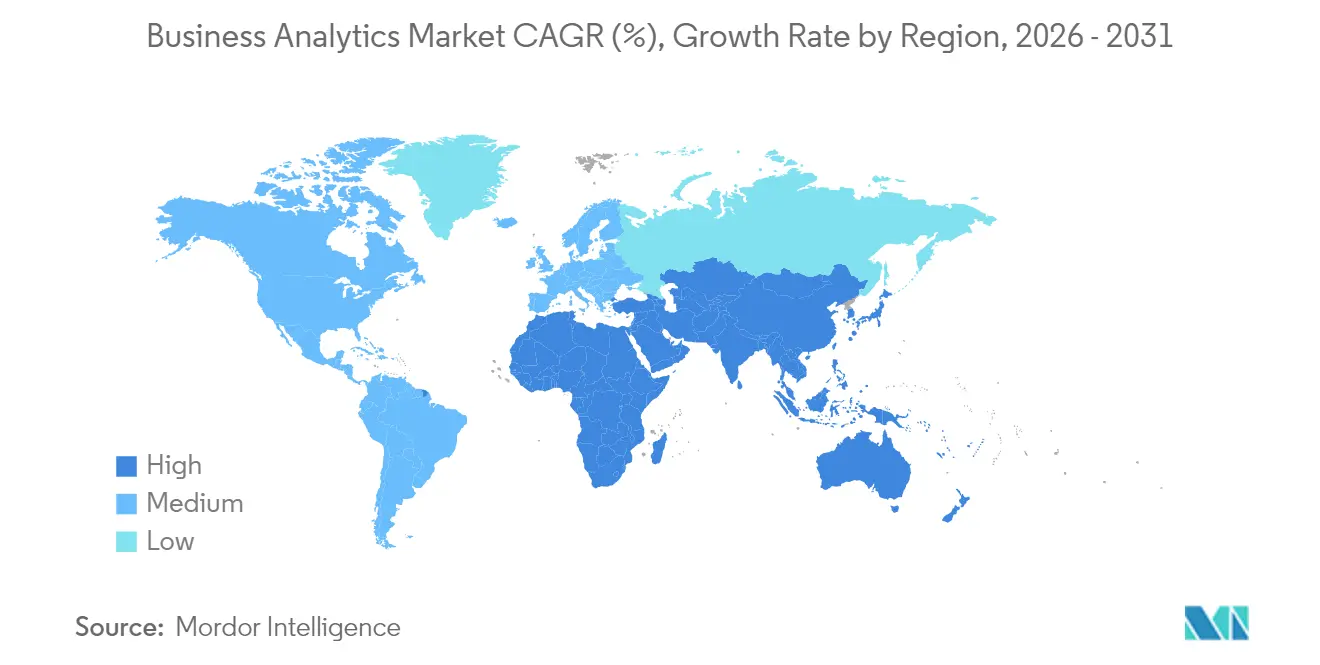
- By geography, North America retained 26.98% of global revenue in 2025, whereas Asia Pacific is on track for a 10.12% CAGR.
Note: Market size and forecast figures in this report are generated using Mordor Intelligence’s proprietary estimation framework, updated with the latest available data and insights as of 2026.
Market Trends and Insights
Drivers Impact Analysis of Business Analytics Market*
| Driver | (~) % Impact on CAGR Forecast | Geographic Relevance | Impact Timeline |
|---|---|---|---|
| Proliferation of big data and cloud adoption | +2.1% | Global, with North America and Asia-Pacific leading | Medium term (2-4 years) |
| Need for real-time decision-making | +1.8% | Global, particularly manufacturing and finance sectors | Short term (≤ 2 years) |
| AI/ML infusion into analytics platforms | +2.3% | North America, Europe, and Asia-Pacific core markets | Medium term (2-4 years) |
| Regulatory push for data-driven compliance | +1.2% | Europe and North America primarily | Long term (≥ 4 years) |
| Edge analytics for IoT-heavy industries | +1.4% | Asia-Pacific manufacturing hubs, North America industrial | Medium term (2-4 years) |
| Privacy-preserving data clean rooms | +0.9% | Global, with early adoption in advertising and healthcare | Long term (≥ 4 years) |
| Source: Mordor Intelligence | |||
AI and ML infusion into analytics platforms
Artificial intelligence has shifted from a bolt-on feature to a core capability within business analytics platforms. New releases such as Snowflake Cortex and Microsoft 365 Copilot’s Analyst agent interpret natural language, auto-generate SQL, and surface predictive insights that once required a data scientist. [1]Microsoft, “Microsoft 365 Copilot: Analyst Agent,” microsoft.com Companies adopting these capabilities report 30–50% productivity lifts in marketing, supply-chain, and finance teams. As model training costs fall, platform vendors embed generative AI to widen access and automate data preparation, ushering in an era of “agentic analytics” where autonomous agents orchestrate complex analysis pipelines without human coding.
Proliferation of big data and cloud adoption
Volume, velocity, and variety of data keep rising. More than 6,000 organizations exchange upward of 275 petabytes each week on BigQuery, highlighting how elastic cloud storage and compute have become the default substrate for analytics. [2]Google Cloud, “BigQuery Data Sharing Statistics,” cloud.google.com Joint innovation programs, such as the five-year agreement between ClickHouse and AWS, accelerate purpose-built solutions for finance and e-commerce workloads. Cloud frameworks also let firms pair localized IoT data processing with centralized dashboards, delivering 10% gains in equipment efficiency and 30% reductions in unplanned downtime in industrial settings.
Need for real-time decision-making
Competitive pressure forces businesses to treat insights as perishables. Insurers use real-time pricing to lift revenue double digits, and transport operators feed live sensor streams into traffic models that predict congestion with near-perfect precision. Edge-enabled plants trim time-to-market by one-quarter and shave hundreds of thousands of dollars off energy bills every month. Retailers similarly lean on streaming pipelines to cut inventory days while raising product availability and customer satisfaction.
Edge analytics for IoT-heavy industries
Manufacturers, utilities, and smart-city operators deploy analytics at the network edge to eliminate latency, preserve bandwidth, and respect data-protection rules. Local models inspect sensor output, flag anomalies, and act automatically. Worldwide edge spending reached USD 232 billion in 2024, and half of enterprises expect to standardize edge workflows by 2025. Secure partnerships among device makers, telcos, and platform providers anchor these projects to ensure encrypted data transfer and automated policy enforcement.
Restraints Impact Analysis of Business Analytics Market*
| Restraint | (~) % Impact on CAGR Forecast | Geographic Relevance | Impact Timeline |
|---|---|---|---|
| High upfront cost and ROI uncertainty | -1.5% | Global, particularly SMEs in emerging markets | Short term (≤ 2 years) |
| Talent shortage in advanced analytics | -1.8% | North America and Europe primarily | Medium term (2-4 years) |
| Data-sovereignty restrictions | -1.1% | Europe, Asia Pacific with cross-border operations | Long term (≥ 4 years) |
| ESG-data quality gaps | -0.7% | Global, with emphasis on regulated industries | Long term (≥ 4 years) |
| Source: Mordor Intelligence | |||
Data-sovereignty restrictions
Conflicting rules among GDPR, the CLOUD Act, and emerging national laws force multinationals to architect region-specific data stacks. Deployments must ensure local processing, encrypted transfers, and auditable consent, adding cost and complexity.[3]ISACA, “Data-Sovereignty Challenges in Public Cloud,” isaca.orgSovereign-cloud offerings from hyperscalers and regional providers address the issue, yet organizations still juggle multiple vendors and controls to satisfy regulators without fracturing analytical coherence.
Talent shortage in advanced analytics
Demand for data scientists, ML engineers, and analytics translators exceeds supply. Surveys show three-quarters of professionals expect the shortage to persist, eroding competitiveness. Organizations invest in reskilling, hackathons, and partnerships with universities, yet complex AI initiatives still stall when critical roles remain vacant. Low-code interfaces and automated feature engineering close part of the gap, but specialist talent remains crucial for governance and model-risk oversight.
*Our forecasts treat driver/restraint impacts as directional, not additive. The impact forecasts reflect baseline growth, mix effects, and variable interactions.
Business Analytics Market Segment Analysis
By Deployment Model:
Cloud Infrastructure Drives Market EvolutionThe cloud segment accounts for 64.72% of 2025 revenue, and its 10.18% CAGR means it will command an even larger slice of the business analytics market size by 2031. Lower capital expenditure, elastic scaling, and rapid integration with data lakes and AI services cement its appeal. Security certifications and automated compliance features now cover finance, healthcare, and government workloads, eroding the last strongholds of on-premise advocates.
On-premise deployments persist where strict latency, legacy integration, or regulatory mandates prevail, but their share recedes every year. Hybrid blueprints, in which sensitive workloads stay behind the firewall while burst processing moves to the cloud, offer a transitional path. Providers bundle migration toolkits, managed services, and consumption-based pricing to nudge hesitant customers toward the cloud, reinforcing its position as both market leader and growth engine. By 2031, over 40% of buyers are expected to prefer outcome-based contracts where service fees align with business-value metrics rather than hours consumed, reinforcing the strategic importance of trusted partners to the cloud-based business analytics market.



By Analytics Type:
Predictive Intelligence Reshapes Decision-MakingDescriptive analytics retained 32.05% of 2025 revenue, the largest slice of the business analytics market, yet predictive techniques outpace all categories with an 8.74% CAGR. Organizations evolve from “what happened” dashboards to forward-looking models that flag churn risk, optimize inventory, and route maintenance crews before breakdowns occur. Generative AI enhances predictive workflows by auto-coding complex time-series models and surfacing scenario simulations for non-technical users.
Diagnostic analytics serves as a bridge, explaining root causes and feeding features into forecasting algorithms. Prescriptive tools close the loop by recommending the best action under constraints such as budget or staffing. Early success stories like a consumer-products maker saving up to USD 200,000 weekly through optimized production schedules fuel wider adoption. As toolkits mature, predictive and prescriptive layers will jointly convert historical data into automated, context-aware decisions across functions.
By Organization Size:
SME Growth Democratizes Analytics AccessLarge enterprises continue to drive volume, holding 58.92% of 2025 revenue. They invest heavily in multi-cloud data fabrics, explainable AI, and governance frameworks that scale across business units. Yet the small and mid-sized segment grows fastest at 8.98% CAGR, propelled by low-code platforms, bundled data models, and tiered subscriptions that align with tight budgets. Customer programs granting service credits and guided onboarding compress deployment cycles to weeks rather than months.
This democratization reshapes vendor go-to-market approaches. Tools now default to natural-language queries, automated insights, and embedded training to accommodate lean IT teams. At the same time, large enterprises demand advanced features such as multi-modal data integration, lineage tracking, and policy-driven access control, sustaining a two-speed market in which ease of use and enterprise-grade governance coexist.
By End-User Industry:
Healthcare Transformation Accelerates GrowthBFSI institutions captured 27.95% of 2025 spending as risk analytics, fraud detection, and regulatory reporting remain core mandates. They pursue omnichannel customer views and real-time credit scoring to differentiate services. Healthcare and life sciences, however, post the strongest outlook at 9.31% CAGR. Hospitals use predictive models to balance bed capacity and automate inventory allocation, while pharmaceutical firms deploy AI to streamline clinical-trial recruitment and optimize supply chains.
Manufacturing uses edge analytics to raise overall equipment effectiveness by double digits, and retailers employ demand forecasting to cut stockouts and markdowns. Telecom operators analyze network telemetry to predict outages and upsell value-added services, whereas utilities apply predictive maintenance to grids and pipelines. Public-sector agencies embrace data platforms for tax compliance and citizen services, while energy producers monitor emissions to meet net-zero targets.
Geography Analysis
North America Business Analytics Market
North America holds 26.98% of 2025 revenue thanks to a mature technology ecosystem, abundant talent, and early cloud adoption. Enterprises refine existing platforms with AI accelerators, streaming pipelines, and automated governance, squeezing incremental efficiency from established data assets. The United States leads spending, and Canada leverages analytics in natural-resources and financial-services verticals. Mexico adopts cloud platforms to support export-oriented manufacturing and cross-border logistics.
APAC Business Analytics Market
Asia Pacific is the fastest-growing region at a 10.12% CAGR, fueled by government AI strategies, widespread mobile adoption, and greenfield cloud deployments. China commands 37.5% of the regional business analytics market, backed by large-scale digital payment ecosystems and industrial upgrade programs. High-growth economies such as Vietnam and the Philippines exceed 19% annual expansion as SMEs embrace SaaS analytics to leapfrog legacy systems. India, Japan, South Korea, and Thailand channel public-sector grants into workforce upskilling and data-ecosystem development, creating fertile ground for platform vendors.
EMEA and South America Business Analytics Market
Europe advances steadily underpinned by strong privacy regulations and industry digitization funding. Germany, France, and the United Kingdom deploy analytics for manufacturing efficiency and financial compliance, while southern nations expand tourism and retail analytics use cases. Sovereign-cloud frameworks and privacy-enhancing technologies address GDPR-driven demands. The Middle East and Africa benefit from smart-city agendas, especially in the Gulf states, whereas South America gains traction through cloud uptake in Brazil and Argentina, although infrastructure gaps and currency volatility temper the slope of adoption

Regulatory Landscape
Business analytics deployments increasingly operate under cross-sector AI and data-governance regimes that shape model risk controls, transparency, and localization of data processing. In the European Union, the EU AI Act (Regulation (EU) 2024/1689) entered into force on August 1, 2024, establishing a horizontal, risk-tiered framework for AI systems that affects analytics features such as automated decisioning, profiling, and generative AI assistants embedded in BI and planning tools. In the United States, NIST updated its Generative Artificial Intelligence Profile (AI RMF 600-1) on April 8, 2026, providing a current reference point for voluntary AI risk management practices used by enterprises to operationalize governance across the AI and analytics lifecycle.
Adjacent infrastructure and connectivity policy also influences analytics architecture choices, especially for real-time and edge workloads. In the United Kingdom, the Department for Science, Innovation and Technology designated a new Statement of Strategic Priorities for telecommunications on April 27, 2026, directing Ofcom to align regulatory decisions with national economic growth objectives and reinforcing momentum behind upgraded networks that feed streaming analytics. In the US, the FCC opened a Notice of Proposed Rulemaking on March 24, 2026 to reform intercarrier compensation and end-user pricing rules as part of the transition to all-IP networks, indirectly supporting modernization of data transport and observability requirements tied to low-latency analytics operations.
Competitive Landscape
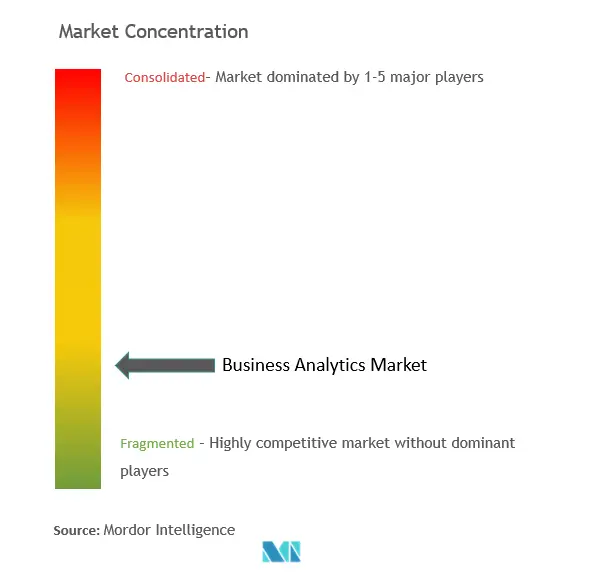
The business analytics market features moderate fragmentation. Top five providers account for roughly 55% of revenue, leaving a sizeable long-tail of niche specialists. Cloud hyperscalers such as AWS, Google Cloud, and Microsoft accelerate feature velocity through integrated AI services and managed data fabrics. Independent data-platform leaders Snowflake and Databricks expand ecosystems via venture arms, strategic investments, and industry solution bundles. Legacy enterprise vendors SAP, Oracle, and IBM embed AI and natural-language querying into established suites to defend installed bases.
Competition intensifies around three axes. First, time-to-value: self-service tools and automated ingestion shrink deployment from quarters to weeks. Second, unified governance: buyers insist that lineage, quality, and policy controls travel with data across clouds. Third, vertical depth: vendors pre-package financial-crime models, patient-risk scores, or production-line templates to reduce customization. Start-ups differentiate through specialist AI agents, causal inference engines, or privacy-preserving analytics, often partnering with larger platforms for distribution.
Mergers, investments, and product launches underscore the race to build end-to-end stacks. Cisco moved to acquire Splunk for unified observability and security analytics. Fivetran purchased Census to blend ETL and reverse-ETL workflows into one pipeline. Databricks took a stake in Omni to streamline BI on its Lakehouse platform. Providers also form multi-year alliances ClickHouse with AWS, for instance to co-engineer high-performance solutions for regulated industries. These actions signal ongoing consolidation even as new entrants continue to surface.
Business Analytics Industry Leaders
Oracle Corporation
IBM Corporation
SAP SE
Microsoft Corporation
Tibco Software Inc.
- *Disclaimer: Major Players sorted in no particular order
Business Analytics Market Companies Covered in this Report
- Microsoft Corp.
- SAP SE
- Oracle Corp.
- IBM Corp.
- Salesforce Inc. (Tableau)
- SAS Institute Inc.
- TIBCO Software Inc.
- Qlik Tech Intl.
- MicroStrategy Inc.
- Infor Inc.
- Google LLC (Looker)
- Amazon Web Services (QuickSight)
- Domo Inc.
- Sisense Ltd.
- ThoughtSpot Inc.
- Alteryx Inc.
- Zoho Corp. (Zoho Analytics)
- Board International
- GoodData Corp.
- Yellowfin BI
- Pyramid Analytics
- Logi Analytics (InsightSoftware)
- Teradata Corp.
- Informatica Inc.
- Palantir Technologies
- Snowflake Inc.
- Databricks Inc.

Market Opportunities and Future Outlook
Cloud-first analytics remains the largest commercial whitespace as enterprises modernize data estates and embed AI assistants into planning, reporting, and operational workflows. The market already skews toward cloud deployment (64.72% share in 2025), and buyer emphasis is moving from one-off dashboards toward agent-enabled decision support that can translate natural language into queries, automate data preparation, and trigger actions in business applications. Vendor roadmaps and releases across enterprise software stacks, including agentic capabilities added around ERP and analytics environments, point to continued productization of these workflows. This creates opportunities for platforms that combine governed data access with low-code experiences for business users.
Data sovereignty and AI governance requirements also support demand for region- and industry-specific operating models rather than one-size-fits-all rollouts. Conflicting rules across GDPR and other national regimes push multinational buyers toward hybrid and sovereign-cloud patterns, along with auditable controls for consent, lineage, and model risk oversight. As a result, solutions that package privacy-enhancing analytics, policy-based access, and sector templates have stronger pull in regulated end users, including BFSI (27.95% revenue share in 2025), and in healthcare and life sciences where adoption is linked to compliance, patient risk modeling, and operational resilience.
Recent Industry Developments in Business Analytics Market
- July 2026: Oracle introduced an AI-native builder experience for Oracle AI Agent Studio within Oracle Fusion Cloud Applications. The release broadens how enterprises design and manage agentic workflows tied to operational and analytics use cases. It also reinforces the shift from dashboard-led BI toward embedded, action-oriented analytics inside core applications.
- June 2026: SAP, Nokia, and Microsoft announced a multi-year agreement for Nokia to migrate its ERP landscape using RISE with SAP methodology hosted on Microsoft Azure. The program shows continued consolidation of enterprise data and analytics footprints on hyperscale clouds to standardize governance. It also supports efforts to accelerate AI-enabled business transformation.
- June 2025: ClickHouse entered a five-year strategic collaboration agreement with AWS to integrate ClickHouse Cloud with AWS services for real-time analytics in finance and e-commerce. The alliance adds managed, high-performance analytics options on hyperscale infrastructure. It also increases competitive pressure on incumbent data platforms serving latency-sensitive workloads.


Business Analytics Market Report Scope and Research Methodology
Market Definition and Coverage
This market covers revenues tied to business analytics platforms and related services that help organizations collect, prepare, analyze, and visualize data for decision-making. It includes cloud, on-premise, and hybrid deployments, with demand measured across major end-use industries worldwide.
Scope exclusions: we exclude pure IT consulting that does not include analytics software or ongoing analytics services as a billed deliverable.
Segments Covered in This Report
- By Deployment Model
- On-Premise
- Cloud
- By Analytics Type
- Descriptive
- Diagnostic
- Predictive
- Prescriptive
- By Organisation Size
- Large Enterprises
- Small and Mid-sized Enterprises (SMEs)
- By End-user Industry
- Banking, Financial Services and Insurance (BFSI)
- Healthcare and Life Sciences
- Manufacturing
- Retail and E-commerce
- Telecom and IT
- Government and Public Sector
- Energy and Utilities
- Others
- By Geography
- North America
- United States
- Canada
- Mexico
- South America
- Brazil
- Argentina
- Rest of South America
- Europe
- Germany
- United Kingdom
- France
- Italy
- Spain
- Rest of Europe
- Asia-Pacific
- China
- Japan
- India
- South Korea
- Southeast Asia
- Rest of Asia-Pacific
- Middle East and Africa
- Middle East
- Saudi Arabia
- United Arab Emirates
- Turkey
- Rest of Middle East
- Africa
- South Africa
- Nigeria
- Egypt
- Rest of Africa
- Middle East
- North America
Data Sources, Market Sizing, and Validation
Desk Research
Desk research was used to build the starting structure for the market and to align definitions across regions and buyer groups. We relied on public and official sources such as the US Bureau of Economic Analysis (BEA), US Census Bureau datasets for services and business spending indicators, Eurostat structural business statistics, and OECD digital economy publications to interpret macro-level demand signals.
We then complemented this with company filings and investor presentations, reputable press coverage of enterprise software trends, and association publications such as data and analytics working groups where available. Paid subscriptions for company financials and intelligence, news and financials, patent databases, and contract and tender tracking were also used to sanity-check vendor activity, product focus shifts, and the timing of large enterprise rollouts. The desk research sources listed here are illustrative only, and many additional public references were used to collect, validate, and clarify data points.
Primary Interviews and Surveys
Primary work focused on validating what is actually being bought and renewed under business analytics budgets, and how pricing and packaging are moving across regions. We spoke with a mix of analytics buyers, systems implementers, data leaders, and product and channel stakeholders across the Americas, EMEA, and APAC, so assumptions on adoption, usage intensity, and vendor mix could be checked before finalizing the model.
Distribution of primary research fieldwork respondents
| Company type | Respondent position | Region |
|---|---|---|
| Top tier: 32% | CXOs: 17% | APAC: 49% |
| Mid tier: 49% | Functional/Unit leaders: 40% | EMEA: 31% |
| Smaller Players: 19% | Managers: 43% | Americas: 20% |
Market-Sizing & Forecasting
Sizing started with a top-down build where enterprise software and IT spend indicators, cloud adoption signals, and analytics penetration by industry were used to reconstruct the addressable demand pool by region, then mapped to business analytics revenue capture. To keep this grounded, we corroborated totals using selective bottom-up approximations, including sampled vendor revenue disclosures, channel checks on subscription pricing ranges, and volume proxies such as active users and project counts in larger enterprises.
Key model inputs included the cloud versus on-premise mix shift, average subscription and maintenance price progression, services attach rates for implementation and managed analytics, industry-level digitization and data platform modernization pace, and regional currency movements used for consistent USD conversion. Where bottom-up visibility was incomplete, we used conservative penetration ranges that were validated with interview feedback and then rechecked against independent spend benchmarks.
Forecasting used scenario analysis supported by a simple multivariate regression layer. Drivers such as IT budget growth, cloud migration pace, AI-enabled analytics uptake, and compliance-led reporting needs were tested for sensitivity. The final outlook reflects the range that most respondents described as realistic for renewal cycles and new-seat expansion over the forecast period.
Data Validation & Update Cycle
Outputs were checked through multiple steps so results did not rely on a single signal. We compared modeled revenues against independent indicators such as enterprise software spend direction, cloud services growth cues, and reported analytics product momentum, then investigated variances before sign-off.
If an outlier appeared, assumptions were revisited, and targeted re-contacts were used to confirm whether the change was real or tied to a definition mismatch. Reports are refreshed annually, with interim updates when material events occur, including major pricing shifts, platform bundling changes, or large regulatory impacts. Before delivery, a final analyst pass is completed so clients receive the latest updated view.
Mordor Intelligence's Global Business Analytics Market Market Size Compared With Other Published Estimates
Published market sizes for business analytics can vary, even when publishers focus on the same industry trend, because they differ on what revenue counts and which years are treated as the base.
Standalone data science staffing and generic IT outsourcing are often blended into analytics totals, and those items sit outside Mordor Intelligence's scope. This keeps the number closer to software and directly attached analytics services that are actively purchased and renewed.
Benchmark comparison
| Source | Market Size | Gaps in Research Methodology |
|---|---|---|
| Mordor Intelligence | USD 98.84 B (2026) | |
| Industry Publisher A | USD 104.10 B (2025) | Uses a different base year and often mixes adjacent categories (for example, broader data platform components) with business analytics, which can lift the starting value and change the growth path. |
| Industry Publisher B | USD 95.30 B (2025) | Relies on a longer forecast horizon with a 2025 anchor and less visible cross-checking of cloud versus on-premise revenue recognition timing, which can compress the near-term total. |
The spread in the table mostly comes from what is counted as analytics revenue and how base-year currency timing is handled. By tying the model to observable buyer spending signals like deployment mix, attach rates, and pricing ranges, the final value stays traceable to inputs that can be rechecked and updated year to year.


Key Questions Answered in the Report
What is the current value of the business analytics market and its growth outlook?
The business analytics market stands at USD 98.84 billion in 2026 and is expected to reach USD 149.47 billion by 2031, equating to an 8.62% CAGR.
Which deployment model holds the largest business analytics market share?
Cloud deployment leads with 64.72% share in 2025 and is also the fastest-growing segment at a 10.18% CAGR.
Which analytics type is projected to grow fastest through 2031?
Predictive analytics shows the strongest momentum, expanding at an 8.74% CAGR as firms shift from descriptive reporting to forward-looking insights.
Why is Asia Pacific viewed as the growth engine for business analytics?
Government AI initiatives, rapid cloud adoption, and strong digital-economy expansion drive a regional CAGR of 10.12%, the highest worldwide.
What is the primary restraint hindering wider analytics adoption?
A persistent talent shortage in advanced analytics roles subtracts an estimated 1.8 percentage points from potential CAGR, delaying projects and raising costs.
Page last updated on:


 Your data is secure and never sold or shared.


