Enterprise Mobility Management Market Size and Share
Market Overview
| Study Period | 2020 - 2031 |
|---|---|
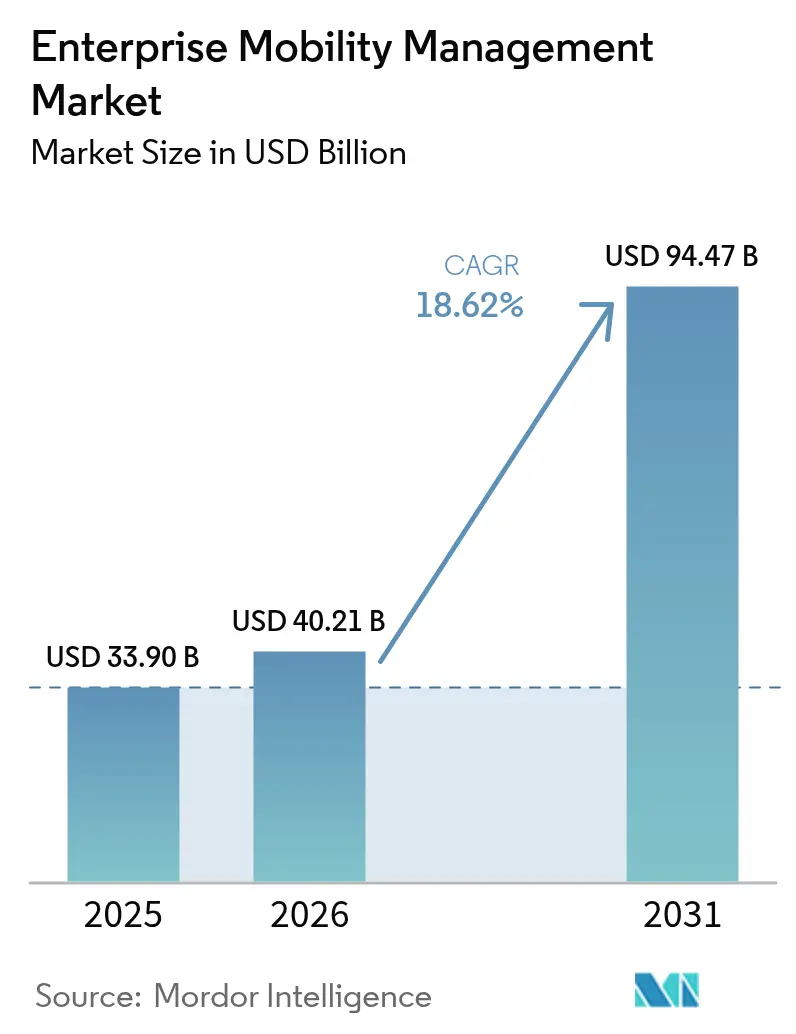
| Market Size (2026) | USD 40.21 Billion |
| Market Size (2031) | USD 94.47 Billion |
| Growth Rate (2026 - 2031) | 18.62% CAGR |
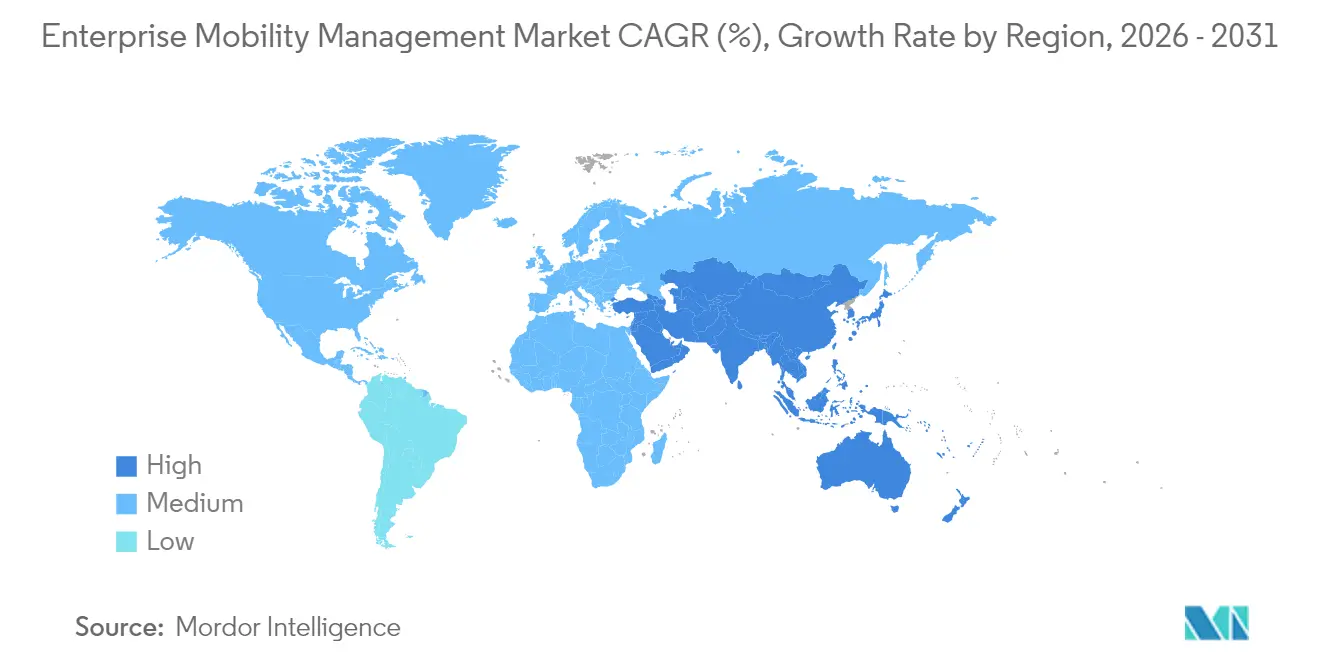
| Fastest Growing Market | Asia Pacific |
| Largest Market | North America |
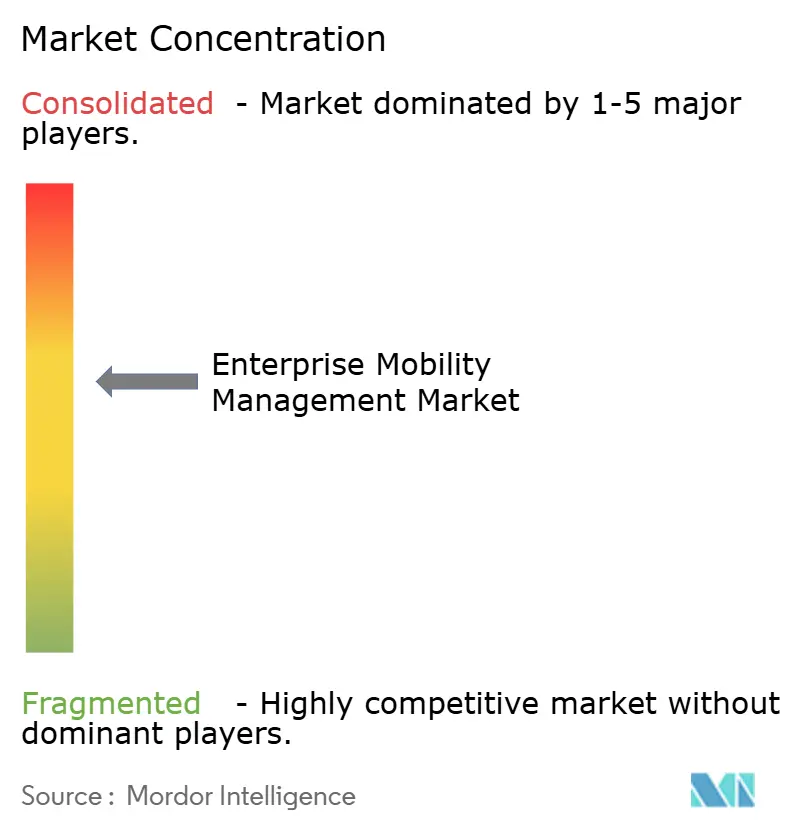
| Market Concentration | Medium |
Major Players *Disclaimer: Major Players sorted in no particular order Image © Mordor Intelligence. Reuse requires attribution under CC BY 4.0. | |
Enterprise Mobility Management Market Analysis by Mordor Intelligence
The Enterprise mobility management market size was valued at USD 33.90 billion in 2025 and estimated to grow from USD 40.21 billion in 2026 to reach USD 94.47 billion by 2031, at a CAGR of 18.62% during the forecast period (2026-2031). Heightened adoption of Zero Trust security, rapid cloud migration, and the embedding of artificial intelligence in policy orchestration are accelerating demand for unified mobility platforms. Organizations now view endpoint control as a business-continuity priority rather than an IT add-on, catalyzing record investments in device, application, and content governance. North American enterprises drive premium spending as regulators tighten breach-reporting rules, while Asia Pacific firms scale deployments fastest on the back of mobile-first digital-transformation programs. Vendors are differentiating through low-latency edge architectures that keep verification processes local, reducing user friction and lowering incident-response times.
Key Report Takeaways
- By type, solutions commanded 62.35% of the Enterprise mobility management market share in 2025; the security management subsegment is advancing at a 20.41% CAGR through 2031.
- By deployment mode, cloud platforms held 58.10% of the Enterprise mobility management market size in 2025 and are expanding at a 18.93% CAGR to 2031.
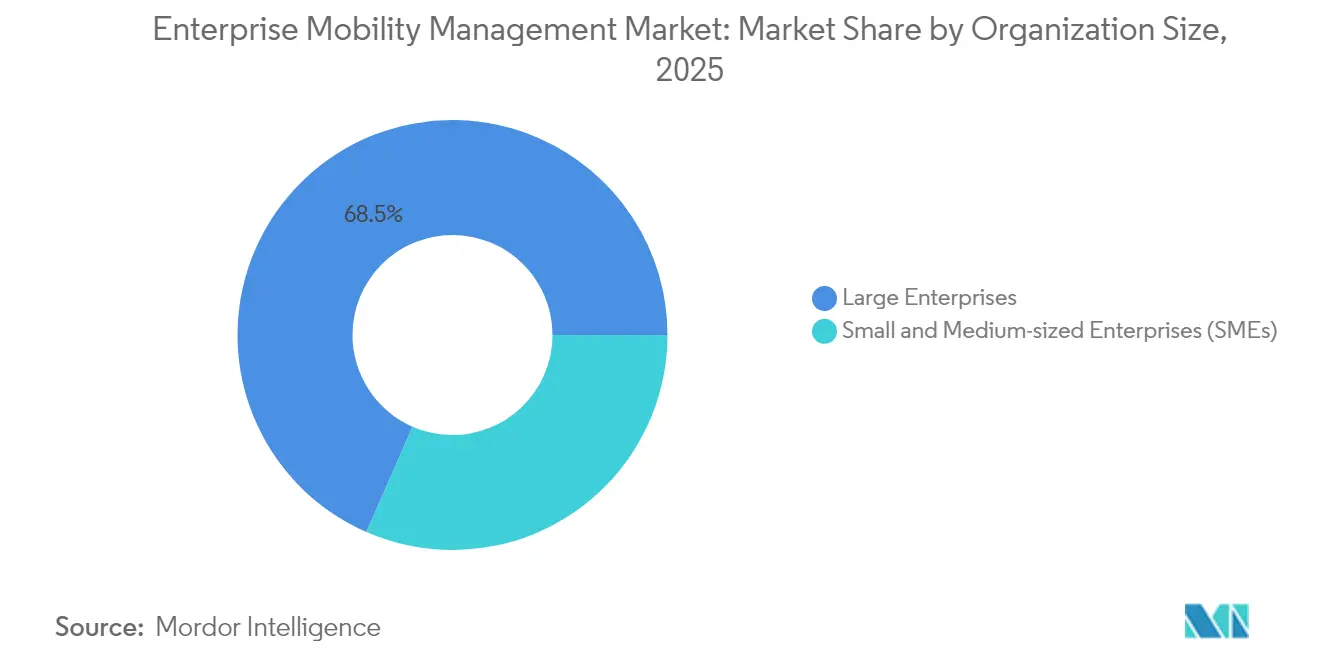
- By organization size, large enterprises contributed 68.45% revenue share in 2025, while SMEs are growing at 20.97% CAGR owing to lower up-front costs.
- By end-user industry, IT and Telecom led with 27.20% revenue share in 2025, while Healthcare is poised for the fastest 19.78% CAGR through 2031 as HIPAA mandates MFA and encryption.
- By geography, North America accounted for 32.30% of 2025 revenue, but Asia Pacific is set to record the highest 21.74% CAGR on robust mobile-device proliferation.
Note: Market size and forecast figures in this report are generated using Mordor Intelligence’s proprietary estimation framework, updated with the latest available data and insights as of 2026.
Global Enterprise Mobility Management Market Trends and Insights
Drivers Impact Analysis*
| Driver | (~) % Impact on CAGR Forecast | Geographic Relevance | Impact Timeline |
|---|---|---|---|
| Proliferation of enterprise mobile devices and apps | +3.2% | North America and Asia Pacific | Medium term (2-4 years) |
| Rising BYOD and remote-work culture | +2.8% | North America and Europe | Short term (≤ 2 years) |
| Escalating mobile cybersecurity threats | +4.1% | Global BFSI and Healthcare hot spots | Short term (≤ 2 years) |
| Emergence of Zero-Trust EMM frameworks | +2.3% | North America and Europe | Long term (≥ 4 years) |
| Integration of AI-driven analytics in EMM solutions | +3.5% | Global Tech and Retail sectors | Medium term (2-4 years) |
| Growing regulatory compliance requirements (GDPR, HIPAA) | +2.9% | Europe and North America | Short term (≤ 2 years) |
| Source: Mordor Intelligence | |||
Proliferation of Enterprise Mobile Devices and Apps
Retailers, utilities, and public-sector agencies now oversee device fleets that rival telecom operators in scale. Seven-Eleven Japan centrally manages 300,000 tablets across 21,000 stores, demonstrating how cloud orchestration delivers uniform policy enforcement at national reach. Microsoft Intune’s new policy set for Apple Vision Pro indicates a widening endpoint mix that EMM consoles must secure without sacrificing user experience.[1]“What’s new in Microsoft Intune: May 2025,” techcommunity.microsoft.com Predictive analytics embedded in device agents surface battery-health and update-compliance anomalies before they become downtime events. Corporate-owned-personally-enabled (COPE) models are replacing restrictive lockdowns, boosting employee satisfaction while preserving data custody.
Rising BYOD and Remote-Work Culture
Ninety-two percent of global firms now allow some form of remote access, up from 76% in 2023, forcing security teams to isolate corporate data from personal content through encrypted containers. Healthcare systems face twin pressures of HIPAA compliance and clinician convenience, pushing uptake of virtual workspace tools that stream applications without persisting ePHI on unmanaged phones. The U.S. Federal Mobility Group, comprising 45 agencies, is codifying shared BYOD assessment checklists to streamline procurement and speed FedRAMP approvals. Shift-based access control and rapid enterprise-wipe functions are now baseline requirements.
Escalating Mobile Cybersecurity Threats
BlackBerry logged 600,000 attacks against critical-infrastructure endpoints in Q3 2024, with 45% aimed at financial institutions. Supply-chain exploits surged as attackers piggybacked on third-party SDKs; 75% of surveyed software pipelines suffered at least one breach last year. IoT expansions aggravate risk: 96% of power-grid operators deploy sensors that lack central patch enforcement. In response, the Cybersecurity and Infrastructure Security Agency published an Enterprise Mobility checklist that prioritizes phishing-resistant authentication and removes SMS-based MFA from recommended practices.[2]“Mobile Device Cybersecurity Checklist,” cisa.gov
Emergence of Zero-Trust EMM Frameworks
NIST guidelines now position continuous verification of both identity and device posture as foundational to modern mobility stacks.[3]“Project Overview - Implementing a Zero Trust Architecture,” National Institute of Standards and Technology, pages.nist.gov Germany certified BlackBerry UEM for Apple iNDIGO, illustrating how federal agencies operationalize Zero Trust down to classified mobile workflows. AI-assisted policy engines correlate risk signals location drift, unusual app launches, or edge-latency spikes and auto-elevate authentication tiers. Secure edge compute keeps validation local, minimizing round-trip delays for field engineers using AR overlays in low-latency contexts.
Restraints Impact Analysis*
| Restraint | (~) % Impact on CAGR Forecast | Geographic Relevance | Impact Timeline |
|---|---|---|---|
| High implementation and upgrade costs | -2.1% | Emerging-market SMEs | Medium term (2-4 years) |
| Legacy system integration complexity | -1.8% | North America and Europe | Long term (≥ 4 years) |
| Limited skilled workforce for advanced EMM deployment | -1.9% | Asia Pacific and Latin America | Medium term (2-4 years) |
| Data privacy concerns and regulatory hurdles | -2.4% | Europe and North America | Short term (≤ 2 years) |
| Source: Mordor Intelligence | |||
High Implementation and Upgrade Costs
Total-cost-of-ownership remains opaque for firms new to enterprise mobility. Surveys of 150 corporate phone managers show 31.3% cite “cost clarity” as the top barrier to platform selection. Hidden spend on compliance audits, certificate renewals, and end-of-life device disposal often exceeds the first-year subscription fee. Vendors respond with feature unbundling; Microsoft now prices Enterprise Application Management at USD 2 per user per month so smaller firms can add advanced patching without a full SKU uplift. Cloud delivery lowers capex but converts budgets into recurring opex, challenging organizations with fluctuating headcount.
Legacy System Integration Complexity
Decades-old HR, ERP, and SCADA stacks frequently lack REST APIs, hampering single-console governance. Forty-six percent of firms report limited endpoint visibility when traditional asset databases do not synchronize with EMM records. The EU Cyber Resilience Act gives companies until 2027 to harden connected devices, accelerating modernization roadmaps or forcing risk-acceptance decisions. Specialized integrators and API brokers lengthen deployment schedules, creating budget overruns that deter late-stage adopters.
*Our forecasts treat driver/restraint impacts as directional, not additive. The impact forecasts reflect baseline growth, mix effects, and variable interactions.
Segment Analysis
By Type: Solutions Dominate Through Security Innovation
Solutions accounted for 62.35% of 2025 revenue, confirming their role as the control nexus across device, application, and content layers. Security Management stood out with a 20.41% CAGR, reflecting relentless threat evolution. Device Management continues as the entry point for new customers yet increasingly bundles AI-guided remediation. Application containers now isolate corporate data on personal phones, meeting privacy statutes in Europe and California. Content and Email Management shifts from basic encryption to policy-driven watermarking that deters unauthorized sharing. Telecom Expense Management remains niche but gains traction among logistics firms seeking SIM-level cost control.
Service lines complement product portfolios. Professional Services teams de-risk rollouts through readiness assessments and phased cut-over plans. Managed Services supply round-the-clock telemetry review, crucial for understaffed IT groups in healthcare and retail. Microsoft’s Advanced Analytics module packages anomaly detection APIs that partners monetize via consulting engagements. As AI matures, domain specialists that can fine-tune models on vertical data will capture margin uplift, giving incumbents an edge over generic MSPs.


By Deployment Mode: Cloud Transformation Accelerates
Cloud options captured 58.10% of 2025 spend and posted the fastest 18.93% CAGR. The Enterprise mobility management market is therefore gravitating toward scalable SaaS consoles that auto-update compliance libraries. One national retail chain ran a proof of concept across 5,000 endpoints and achieved full production in four weeks, a timeline unthinkable on legacy on-premise stacks. Hybrid-cloud remains the bridge for banks requiring data-residency assurance; sensitive tokens stay on-site while policy logic executes in the provider’s regionally fenced cloud. On-premise persists in defense deployments where air-gapped servers satisfy classified-data mandates.
Cost elasticity explains cloud traction. Consumption-based models let SMEs mirror device adoption curves without large license blocks. Government blanket-purchase agreements such as the U.S. GSA’s Best-in-Class Mobility contract tilt procurement toward cloud and 5G-ready services. The EU Digital Identity Wallet regulation compels member states to spin up cloud-native credential vaults within 24 months. Vendors that pre-certify for local pseudonymization standards will outpace rivals still reliant on single-tenant offerings.
By Organization Size: SME Growth Disrupts Traditional Patterns
Large enterprises held 68.45% revenue share in 2025, but the fastest 20.97% CAGR is now logged by SMEs. Cloud onboarding, simplified per-user pricing, and pre-configured compliance templates eliminate the multi-quarter consulting engagements that once deterred smaller buyers. Unified endpoint platforms consolidate mobility, PC, and IoT governance, sparing SMEs the cost of parallel toolchains. The Enterprise mobility management market share of SMEs is forecast to climb to 34.20% by 2031 as regional distributors bundle EMM with cellular data plans.
Enterprises still shape roadmap priorities; Bechtle’s framework to deliver 300,000 Apple devices worth EUR 770 million (USD 869 million) to German agencies illustrates how volume deals influence vendor certification pipelines. Yet smaller schools under Japan’s GIGA program chose mobiconnect because its UI masks policy complexity, proving that ease-of-use can outweigh feature depth in the mid-market. Vendors are subdividing portals—advanced analytics for Fortune 100, low-touch wizards for 100-seat customers—to maximize share of wallet across company scales.
By End-user Industry: Healthcare Leads Digital Transformation
IT and Telecom contributed 27.20% of 2025 turnover thanks to early 5G rollouts and large remote workforces. Healthcare, however, is accelerating at 19.78% CAGR as new HIPAA rules make MFA and encryption compulsory for clinical apps. Banking and insurance firms continue to invest heavily to meet zero-downtime expectations and to satisfy Basel III operational-resilience tests.
Manufacturers deploy rugged tablets tethered to IoT sensors, using edge compute to run anomaly-detection models on plant floors. Government agencies consolidate legacy radios, smartphones, and wearables under one console for disaster-response readiness, with the U.S. Defense Information Systems Agency publishing Android 13 STIGs that drive procurement alignment. Retailers optimizing curb-side pickup integrate EMM APIs with workforce-scheduling engines, cutting order-handoff times during peak seasons. Logistics operators tag pallets with eSIM-enabled trackers managed via the same portal as driver handhelds, delivering end-to-end chain-of-custody visibility.
Geography Analysis
North America generated 32.30% of 2025 revenue as public-sector breach mandates accelerated spending on device posture checks and continuous authentication. The Cybersecurity and Infrastructure Security Agency’s mobile checklist now underpins procurement templates across 15 federal departments. Canadian privacy law amendments mandate that service providers store identifiable data domestically, raising demand for in-country SaaS regions. Mexico’s automotive corridor deploys edge-enabled tablets on factory floors, pushing industrial integrators to certify bilingual UIs and local-telco eSIM profiles.
Asia Pacific posts the highest 21.74% CAGR, propelled by smartphone ubiquity and national digital agendas. Japan’s convenience-store and education pilots showcase hyperscale deployments, underscoring operational efficiency gains from centralized patching. India’s Digital Personal Data Protection Act adds breach-reporting windows as short as 72 hours, compelling SMBs to adopt policy engines with audit-ready logs. China dominates device volume but restricts foreign cloud ingress, so multinationals operate hybrid architectures to meet cybersecurity reviews. Australia’s Protective Security Direction 001-2025 explicitly lists mandatory encryption algorithms for enterprise mobility endpoints, creating standardized tender language.
Europe tightens product-security oversight via the Cyber Resilience Act, requiring CE-mark conformity and incident-response processes by 2027. Germany’s BSI clearance for BlackBerry UEM paves the way for classified Apple deployments, evidencing national preference for certified solutions. The U.K. refines its post-Brexit data-transfer rules yet remains interoperable with EU adequacy arrangements, sustaining cross-border SaaS adoption. Southern European states prioritize digital-ID wallets that ride on EMM cryptographic modules, shortening citizen-service queues and expanding inclusive governance.
Mordor Intelligence provides coverage of the enterprise mobility management market across other key regional markets. Detailed country-level analysis extends to Indonesia incorporating local coverage and market participation, as required.

Competitive Landscape
The Enterprise mobility management market hosts a moderately fragmented set of incumbents and specialists. Microsoft leverages Azure scale and AI analytics to embed preventive controls that auto-quarantine risky applications before execution. VMware refocuses after divesting its end-user computing assets, reallocating R&D toward spatial-computing workspace orchestration. BlackBerry differentiates through government-grade certifications, enabling premium pricing in defense and critical-infrastructure tenders. Jamf’s planned Android support shows platform convergence as customers demand single-pane oversight across mixed estates.
Edge computing integration becomes a new battleground; Qualcomm’s on-prem AI appliance offers inference at site level, lowering cloud egress fees for vision models examining worker safety. MSP ecosystem partnerships intensify as vendors chase mid-market expansion; TeamViewer’s acquisition of 1E strengthens its digital employee-experience module, moving the company beyond remote assistance into proactive endpoint health. Government certifications act as high entry barriers, and vendors securing early approvals lock in multi-year framework agreements, as evidenced by Bechtle’s Apple contract with Germany’s interior ministry.
Pricing competition remains disciplined as buyers prioritize risk reduction over lowest cost. Nonetheless, freemium tiers emerge for sub-50-device companies to seed market share. Strategic alliances between telecom operators and EMM providers bundle connectivity with security, creating stickier contracts and lowering customer-acquisition cost. Open-standard APIs are increasingly table stakes, allowing integration with SIEM, ITSM, and business-workflow tools to support continuous compliance narratives during board audits.
Enterprise Mobility Management Industry Leaders
Citrix Systems, Inc.
Microsoft Corporation
BlackBerry Limited
IBM (MaaS360)
VMware (AirWatch)
- *Disclaimer: Major Players sorted in no particular order

Recent Industry Developments
- May 2025: Jamf announced expansion into Android device management starting July 2025, giving Apple-centric enterprises single-console control of mixed fleets.
- May 2025: Microsoft Intune introduced multi-admin approval for remote actions and enhanced unattended-session protection, tightening governance of help-desk interventions.
- April 2025: Bechtle secured a framework worth up to EUR 770 million (USD 869 million) to supply 300,000 Apple devices to German federal agencies, reinforcing public-sector standardization on certified endpoints.
- February 2025: TeamViewer agreed to acquire 1E to integrate digital employee-experience analytics into its mobility platform.


Research Methodology Framework and Report Scope
Market Definitions and Key Coverage
Our study treats the enterprise mobility management (EMM) market as the full suite of software and managed-service offerings that secure, monitor, and optimize smartphones, tablets, rugged handhelds, and laptops that access corporate data over public or private networks. These tools include device, application, content, identity, and telecom-expense management functions deployed on-premise, in the cloud, or as hybrids.
Scope exclusion: One-time mobile device procurement services and stand-alone mobile threat defense platforms lie outside this analysis.
Segmentation Overview
- By Type
- Solutions
- Device Management
- Application Management
- Security Management
- Content and Email Management
- Telecom Expense Management
- Services
- Professional Services
- Managed Services
- Solutions
- By Deployment Mode
- On-premise
- Cloud-based
- Hybrid
- By Organization Size
- Large Enterprises
- Small and Medium-sized Enterprises (SMEs)
- By End-user Industry
- BFSI
- Healthcare and Life Sciences
- IT and Telecom
- Manufacturing and Industrial
- Retail and E-commerce
- Government and Public Sector
- Transportation and Logistics
- Other End-user Industry
- By Geography
- North America
- United States
- Canada
- Mexico
- South America
- Brazil
- Argentina
- Rest of South America
- Europe
- Germany
- United Kingdom
- France
- Italy
- Spain
- Russia
- Rest of Europe
- Asia-Pacific
- China
- India
- Japan
- South Korea
- Australia and New Zealand
- ASEAN
- Rest of Asia-Pacific
- Middle East and Africa
- Middle East
- Saudi Arabia
- United Arab Emirates
- Turkey
- Rest of Middle East
- Africa
- South Africa
- Nigeria
- Kenya
- Rest of Africa
- Middle East
- North America
Detailed Research Methodology and Data Validation
Primary Research
Our team interviewed mobility architects at managed service providers, CISOs in highly regulated industries, regional telecom carriers, and certified EMM integrators across North America, Europe, Asia Pacific, and the Gulf. These dialogues validated device counts, average subscription prices, adoption triggers, and likely upgrade cycles, giving us practical guardrails for every assumption.
Desk Research
We began with structured searches across tier-1 public sources such as the US Bureau of Labor Statistics mobile workforce tables, GSMA Intelligence handset penetration dashboards, International Telecommunication Union broadband series, European Union NIS security directives, and industry white papers hosted by CTIA and NIST. Company filings, investor decks, and major technology press articles captured pricing corridors and recent launches. To cross-check financials, analysts tapped D&B Hoovers for enterprise customer counts and Dow Jones Factiva for deal flow and contract values. These examples illustrate the reference pool; many additional sources informed the evidence base.
A second desk pass aligned the taxonomy with IEEE peer-reviewed papers on unified endpoint management, ensuring the segmentation mirrored real-world feature bundles adopted by IT departments. This is where Mordor Intelligence ties the market boundary tightly to use-case reality, limiting error from scope creep.
Market-Sizing & Forecasting
A top-down construct converts national mobile workforce numbers into an addressable device pool, applies BYOD penetration ratios, and multiplies by region-specific active licences per device. Selective supplier roll-ups and channel ASP checks then refine totals before lock-in. Key inputs include smartphone replacement rates, share of cloud deployments, 5G service coverage, average EMM licence price erosion, security incident frequency, and hybrid-work policy prevalence. Multivariate regression projects each driver through 2030, while scenario analysis cushions for macroeconomic swings. Where bottom-up gaps appear, for example in emerging markets, primary research price-volume pairs bridge differences.
Data Validation & Update Cycle
Model outputs pass three layers: automated outlier flags, peer review among domain analysts, and a final sign-off by the lead author. Mordor refreshes every twelve months, issuing interim pulses after material events (regulatory mandates, high-impact mergers). A brief reconfirmation occurs just before report delivery so clients receive the latest calibrated view.
Why Our Enterprise Mobility Management Baseline Commands Reliability
Published estimates vary because firms pick dissimilar functional buckets, weight cloud shifts differently, and refresh at unequal intervals.
Key gap drivers include: some studies fold mobile threat defense into EMM totals, others assume uniform licence prices worldwide, and a few employ aggressive BYOD growth curves without cross-checking against labor statistics. Mordor's disciplined scope, region-tuned pricing matrices, and annual refresh cadence reduce these variances.
Benchmark comparison
| Market Size | Anonymized source | Primary gap driver |
|---|---|---|
| USD 33.90 B (2025) | Mordor Intelligence | - |
| USD 40.73 B (2025) | Global Consultancy A | Includes standalone mobile threat defense and kiosk management platforms |
| USD 23.48 B (2025) | Industry Analytics Firm B | Uses uniform global ASP and omits managed-service revenues |
Taken together, the comparison shows that when scope alignment and price realism tighten, our figure offers a balanced, transparent baseline that decision-makers can trace back to clearly stated variables and repeatable steps.


Key Questions Answered in the Report
What is the projected value of the Enterprise mobility management market by 2031?
It is expected to reach USD 94.47 billion, reflecting an 18.62% CAGR during the forecast period (2026-2031).
Which deployment mode is growing fastest?
Cloud-based platforms exhibit the strongest 18.93% CAGR through 2031 as firms shift from capex to scalable SaaS.
Why is healthcare adoption accelerating?
New HIPAA rules mandating MFA and encryption push hospitals to deploy compliant mobility solutions quickly.
How will Zero Trust affect mobility strategies?
Continuous verification of user and device health will become default, reducing reliance on traditional VPN perimeters.
What regions offer the highest growth potential?
Asia Pacific leads with a 21.74% CAGR thanks to mobile-first policies and expanding 5G coverage.
Are SMEs significant buyers of EMM?
Yes; cloud subscription models and simplified consoles drive a 20.97% CAGR among small and medium enterprises.
Page last updated on:


