Telecom Analytics Market Size and Share
Market Overview
| Study Period | 2020 - 2031 |
|---|---|
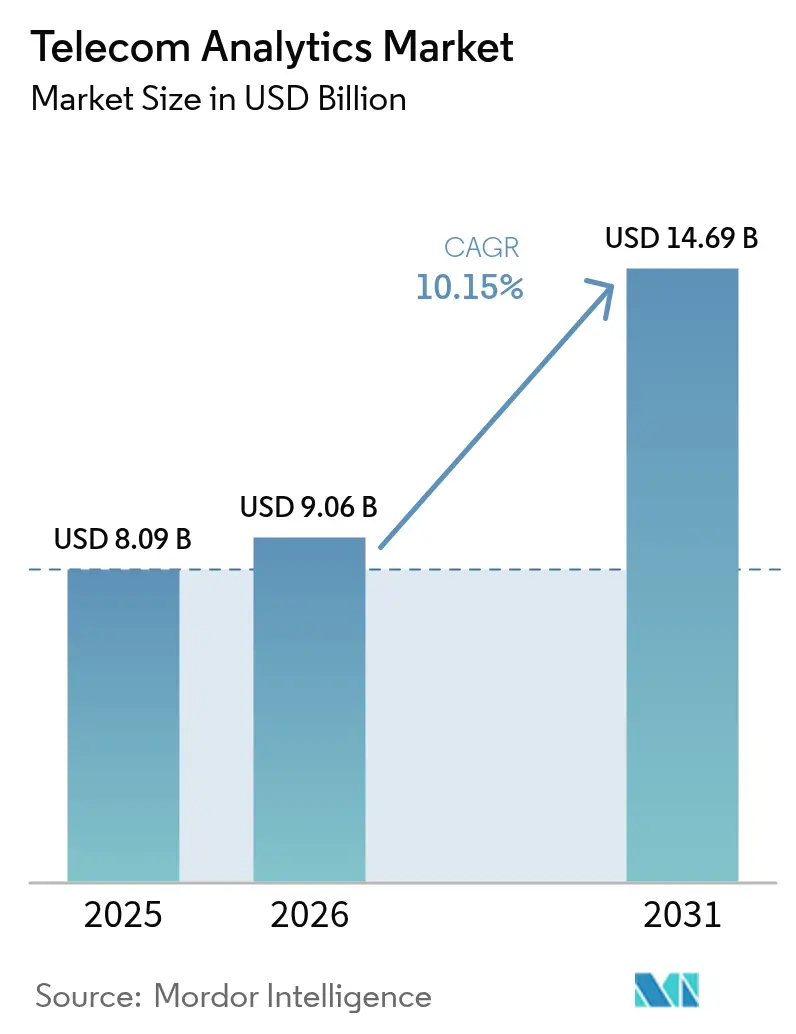
| Market Size (2026) | USD 9.06 Billion |
| Market Size (2031) | USD 14.69 Billion |
| Growth Rate (2026 - 2031) | 10.15% CAGR |
| Fastest Growing Market | Asia Pacific |
| Largest Market | North America |
| Market Concentration | Medium |
Major Players *Disclaimer: Major Players sorted in no particular order Image © Mordor Intelligence. Reuse requires attribution under CC BY 4.0. | |
Telecom Analytics Market Analysis by Mordor Intelligence
The telecom analytics market size was valued at USD 8.09 billion in 2025 and estimated to grow from USD 9.06 billion in 2026 to reach USD 14.69 billion by 2031, at a CAGR of 10.15% during the forecast period (2026-2031). Ongoing 5G-stand-alone rollouts have multiplied network-telemetry volumes, pushing operators to replace reactive dashboards with real-time, AI-driven decision engines. Predictive churn models are moving upstream from billing records to social-graph and device-usage streams, while network-slicing analytics now orchestrate spectrum and edge capacity in sub-10-millisecond windows. Data-residency rules in Europe and Asia are fracturing the cloud-first paradigm, prompting hybrid deployments that keep sensitive subscriber information local yet still tap hyperscaler machine-learning toolkits. At the same time, closed-loop, agentic AI is cutting mean-time-to-repair by up to 40%, further validating spending on the telecom analytics market.
Key Report Takeaways
- By application, Customer Analytics led with 28.16% of telecom analytics market share in 2025, while Network Analytics is advancing at a 12.23% CAGR to 2031.
- By deployment model, Cloud accounted for 66.42% of the telecom analytics market in 2025, whereas Edge and Hybrid configurations are expanding at an 11.27% CAGR through 2031.
- By component, Software held a 71.19% share of telecom analytics market size in 2025, while Services are projected to grow at a 10.67% CAGR between 2026-2031.
- By end-user enterprise size, Large Enterprises contributed 76.48% of 2025 revenue, but SMEs are poised for a 10.83% CAGR through 2031.
- By operator type, Mobile Network Operators commanded a 61.22% share in 2025, and Converged Operators are forecast to post an 11.04% CAGR during 2026-2031.
- Geographically, North America captured 34.76% of 2025 revenue, whereas Asia-Pacific is projected to rise at a 12.75% CAGR to 2031.
Note: Market size and forecast figures in this report are generated using Mordor Intelligence’s proprietary estimation framework, updated with the latest available data and insights as of 2026.
Global Telecom Analytics Market Trends and Insights
Drivers Impact Analysis*
| Driver | (~) % Impact on CAGR Forecast | Geographic Relevance | Impact Timeline |
|---|---|---|---|
| Surge in Need for Churn Reduction | +2.1% | Global, with acute pressure in saturated markets (North America, Western Europe) | Short term (≤ 2 years) |
| Increasing Vulnerability to Fraudulent Activities | +1.8% | Global, concentrated in regions with weak STIR/SHAKEN enforcement (Africa, South Asia) | Medium term (2-4 years) |
| Rapid 5G Deployment Spurring Network Analytics Adoption | +2.5% | Asia-Pacific core, spill-over to Middle East and South America | Medium term (2-4 years) |
| Accelerated Adoption of Cloud-Native Analytics by Telcos | +1.9% | North America and Europe leading, Asia-Pacific following | Short term (≤ 2 years) |
| Emergence of Network-Slicing Analytics for Private 5G Networks | +1.2% | Enterprise-heavy markets (Germany, United States, Japan, South Korea) | Long term (≥ 4 years) |
| AI-Driven Zero-Touch Operations Creating Closed-Loop Analytics Demand | +1.6% | Global, early adoption in Tier-1 operators (Verizon, Deutsche Telekom, China Mobile) | Medium term (2-4 years) |
| Source: Mordor Intelligence | |||
Surge in Need for Churn Reduction
Escalating subscriber-acquisition costs, which now top USD 300 per customer in mature markets, have made retention the primary lever for protecting average revenue per user.[1]Verizon, “AI-Driven Retention Platform,” verizon.com Advanced models blend device-upgrade cycles, social-network affinity scores, and competitive-offer exposure, enabling operators to intervene up to three months before contract expiry. Verizon’s early-2025 rollout lowered postpaid churn by 18 basis points inside six months, trimming payback periods on analytics deployments to under 18 months. European regulators, however, require explainability features under the AI Act, stretching implementation timelines by 10-15% but bolstering stakeholder trust.
Increasing Vulnerability to Fraudulent Activities
Global fraud losses hit USD 39.89 billion in 2024, with SIM-swap, revenue-share, and spoofed robocalls comprising 68%.[2]Communications Fraud Control Association, “Global Fraud Losses 2024,” cfca.org eSIM and over-the-air provisioning broaden the attack surface, forcing carriers to correlate signaling, device fingerprints, and behavioral biometrics in real time.[3]Subex, “Real-Time Fraud Analytics,” subex.com The U.S. STIR/SHAKEN mandate effective June 2024 accelerated uptake among small carriers as compliance hinged on continuous analytics of call-origin patterns. Managed-service models addressing fraud now form a USD 1.2 billion opportunity for vendors targeting operators without dedicated security teams.
Rapid 5G Deployment Spurring Network Analytics Adoption
Standalone 5G subscriptions crossed 1.9 billion in 2025, generating 10-15 times the telemetry of 4G and demanding analytics that span core, edge, and transport layers to uphold enterprise SLAs. Nokia’s Network Data Analytics Function processes 10 terabytes daily to predict congestion and trigger automated capacity shifts. More than 2,400 private 5G networks were active by end-2025, each requiring slice-specific monitoring to isolate faults without affecting adjacent tenants. Vendor-agnostic platforms that normalize multi-vendor data formats are therefore gaining favor among operators juggling Ericsson radios, Nokia cores, and third-party edge compute.
Accelerated Adoption of Cloud-Native Analytics by Telcos
Cloud-native migrations can significantly reduce total ownership costs, achieving savings of 40-60% when compared to traditional on-premises setups. These migrations not only lower costs but also enhance operational efficiency and scalability, making them a strategic choice for businesses aiming to modernize their IT infrastructure. Rakuten Symphony's fully virtualized network, which has been operational since 2024, exemplifies the benefits of such advancements. This network processes an impressive 500 million transactions daily while utilizing 30% less computing power than conventional monolithic systems, showcasing a substantial improvement in resource efficiency. Additionally, Snowflake's telco-centric data-sharing features, launched in mid-2025, provide operators with the ability to monetize anonymized insights while adhering to GDPR regulations. This innovation creates new revenue streams for telecom operators, enabling them to leverage data responsibly and effectively. To mitigate the risks associated with hyperscaler lock-in, carriers are increasingly adopting multi-cloud strategies and containerized microservices. These approaches not only enhance flexibility but also enable feature releases on a weekly basis, a significant improvement over the traditional quarterly release cycles. This shift underscores the industry's commitment to agility and responsiveness in a rapidly evolving technological landscape.
Restraints Impact Analysis*
| Restraint | (~) % Impact on CAGR Forecast | Geographic Relevance | Impact Timeline |
|---|---|---|---|
| Lack of Awareness Among Telecom Operators | -1.3% | Emerging markets (Sub-Saharan Africa, South Asia, parts of South America) | Short term (≤ 2 years) |
| Data Privacy and Cross-Border Transfer Restrictions | -1.7% | Europe (GDPR), China (PIPL), India (DPDPA), with ripple effects globally | Long term (≥ 4 years) |
| OPEX Strain from Spectrum Auctions Curbing On-Prem Investments | -0.9% | Middle East, Africa, South America following recent auctions | Medium term (2-4 years) |
| Scarcity of Telco-Specific Labeled Datasets for AI Models | -1.1% | Global, acute in operators without legacy analytics infrastructure | Medium term (2-4 years) |
| Source: Mordor Intelligence | |||
Lack of Awareness Among Telecom Operators
A 2024 survey covering 120 operators across 40 countries showed that 58% of Tier-2 carriers could not name a use case beyond static reporting, blunting investment appetite. Vendor pitches often dwell on algorithms and data lakes rather than operational pain points, reinforcing misconceptions. Proof-of-concept accelerators, such as Microsoft’s eight-week program, are emerging to bridge the gap by demonstrating ROI before capital spending. Industry groups like TM Forum are also publishing maturity benchmarks to guide step-wise adoption.
Data Privacy and Cross-Border Transfer Restrictions
The GDPR, PIPL, and India’s DPDPA together cover over 3 billion subscribers, compelling operators to maintain region-specific data lakes and inflating costs by 25-35%. The EU-U.S. Data Privacy Framework, finalized July 2024, offers a route for transatlantic flows but faces legal challenges, curbing long-term cloud commitments. Deutsche Telekom, Orange, Telefónica, TIM, and Vodafone responded with a pan-European federated edge continuum in February 2026, training models locally and exchanging only weights to stay compliant. Compliance overheads now consume 8-12% of analytics budgets at mid-size operators.
*Our forecasts treat driver/restraint impacts as directional, not additive. The impact forecasts reflect baseline growth, mix effects, and variable interactions.
Segment Analysis
By Application: Customer Analytics Dominates, Network Analytics Accelerates
Customer Analytics accounted for 28.16% of telecom analytics market share in 2025 as operators prioritized churn mitigation and lifetime-value expansion in flat-growth regions. Network Analytics is forecast to post a 12.23% CAGR, reflecting the telemetry surge from 5G slices and dynamic spectrum systems.
The rest of the application landscape is equally dynamic. Marketing-and-sales analytics leverages location and usage data to trigger micro-segmented offers within 24 hours of a competitor’s churn event. Pricing and revenue-management models enable real-time tariff shifts that have lifted ARPU by up to 9% at early adopters. Fraud management analytics, energized by SIM-swap spikes, now correlates signaling and biometrics in milliseconds, while emerging service-quality tools monitor QoE commitments for enterprise 5G contracts.


By Deployment: Cloud Leads, Edge and Hybrid Surge
Cloud implementations captured 66.42% of telecom analytics market size in 2025 thanks to elastic scalability and rapid access to hyperscaler ML services. Yet Edge and Hybrid configurations are expanding at an 11.27% CAGR as autonomous-vehicle, AR, and industrial-IoT use cases demand local inference under 10 milliseconds.
Hybrid designs now place batch analytics in public clouds while keeping slice orchestration and fraud detection at regional data centers, balancing cost, latency, and compliance. A joint Nokia-Telefónica program across 12 European markets, launched February 2026, shaved backhaul traffic by 60% through edge video analytics. Although total ownership costs run 15-20% higher than pure-cloud, operators accept the premium to avoid vendor lock-in and meet data-sovereignty mandates.
By Component: Software Dominates, Services Gain Momentum
Software generated 71.19% of 2025 revenue, underscoring the license-heavy nature of ingestion engines, ML frameworks, and visualization layers. Services, however, are tracking a 10.67% CAGR as operators weave legacy OSS/BSS with containerized microservices, a labor-intensive task needing domain expertise.
Managed-service contracts now bundle monitoring, quarterly model retraining, and proactive tuning, reducing failed pilot rates by half. Low-code studios are democratizing model building for business analysts, though governance teams warn of bias and validation shortfalls. Open-source components like Apache Kafka and TensorFlow trim software costs, but most operators still pay for commercial distributions that guarantee security patches.
By End-User Enterprise Size: Large Enterprises Lead, SMEs Accelerate
In 2025, telecom analytics market revenue saw a significant contribution of 76.48% from large enterprises, primarily due to their expansive multi-country presence and robust annual digital-transformation budgets exceeding USD 50 million. These enterprises continue to dominate the market by leveraging their scale and resources to adopt advanced analytics solutions, ensuring sustained growth and competitive advantage. On the other hand, SMEs are on track to achieve a notable 10.83% CAGR, driven by the increasing adoption of SaaS-based analytics solutions. SaaS vendors are offering analytics modules priced between USD 5,000 and 15,000 monthly, making these solutions more accessible and cost-effective for smaller businesses.
Templates tailored for specific sectors, such as hospitality, retail, and logistics, have significantly expedited deployment times, reducing them to less than ten weeks. These verticalized templates enable businesses to quickly integrate analytics into their operations, enhancing efficiency and decision-making processes. Freemium models are proving to be an effective strategy for customer acquisition, with an impressive 18-22% conversion rate within a year. This approach allows businesses to test analytics solutions before committing to full-scale adoption. In contrast, large enterprises are strategically reducing their capital expenditures by 12-15% each year. They are achieving this through the implementation of predictive site-upgrade modeling, which optimizes resource allocation and minimizes unnecessary spending, further solidifying their market position.

By Telecom Operator Type: MNOs Dominate, Converged Operators Surge
In 2025, Mobile Network Operators held a commanding 61.22% market share, capitalizing on high-volume data and their established analytics frameworks. These operators have successfully leveraged their extensive infrastructure and advanced data analytics capabilities to maintain a dominant position in the market. Meanwhile, Converged Operators, benefiting from insights gained through bundled offerings of mobile, broadband, and IPTV products, are witnessing a robust growth rate of 11.04% CAGR. These bundled services not only enhance customer satisfaction but also provide valuable cross-sell opportunities, with these insights boosting their Average Revenue Per User (ARPU) by as much as 20%.
Fixed-line incumbents primarily harness analytics for maintenance optimization, focusing on improving operational efficiency and reducing downtime. In contrast, Mobile Virtual Network Operators (MVNOs) utilize micro-segmentation strategies to compensate for their lack of network assets. By targeting specific customer segments, MVNOs can offer tailored services that meet unique consumer needs. Notably, MVNO-in-a-Box platforms have streamlined their launch process to just 12 weeks, significantly reducing time-to-market. These platforms come equipped with integrated dashboards for churn, Lifetime Value (LTV), and upselling, enabling MVNOs to make data-driven decisions and enhance their competitive edge in the market.
Geography Analysis
North America led the telecom analytics market with 34.76% revenue share in 2025. AT&T’s March 2025 rollout of a unified analytics fabric predicts service degradation 48 hours ahead, automating remediation and containing churn. Verizon’s AI-powered network operations, live February 2025, have cut mean-time-to-repair by 35%. Canada’s Rogers and Mexico’s Telcel are mirroring these initiatives to monetize 5G enterprise services and IoT bundles.
Asia-Pacific is on course for a 12.75% CAGR through 2031, fueled by India’s rapid 5G expansion, China’s AI-RAN optimization, and ASEAN digital-economy programs. Bharti Airtel deployed Nokia’s analytics engine in January 2025 to sustain sub-20-millisecond latency for industrial clients. Reliance Jio’s November 2024 alliance with Google Cloud processes 50 petabytes of data each month to personalize offers and flag fraud instantly. China Mobile’s December 2024 AI-RAN rollout covers 300,000 sites, improving capacity by 12% while cutting energy 18%.
Europe faces slower growth amid tight privacy regimes, yet innovation persists. The February 2026 federated edge continuum unites five major operators, pooling model training while honoring GDPR. NIS2 cybersecurity rules, effective October 2024, have spurred real-time threat analytics investments. Middle East and Africa, energized by spectrum auctions in Saudi Arabia and Nigeria, are channeling consumption-based cloud pricing to offset capital strain. UAE’s Etisalat saved 22% in OPEX after a December 2024 AI-driven optimization. South America, pressured by OPEX constraints, is piloting cloud-native analytics in Brazil and Argentina to shrink infrastructure costs and quicken service launches.


Competitive Landscape
The telecom analytics market remains moderately fragmented. Infrastructure vendors Ericsson, Nokia, and Huawei embed analytics inside base stations and cores, creating multi-year lock-ins that bundle professional services for data-lake integration. Hyperscalers AWS, Microsoft Azure, and Google Cloud monetize data gravity through telco-specific ML modules that tie analytics consumption to compute spend.
Software specialists Amdocs, Oracle, and SAP concentrate on OSS/BSS unification, offering billing and CRM analytics many equipment makers lack. Edge orchestration is the new battleground: Nokia and Telefónica’s February 2026 deployment slashed backhaul by 60%. Disruptors Aira Technologies and Totogi ship cloud-native, API-first platforms deployable in weeks, courting operators wary of vendor lock-in.
Patent filings for 3GPP Release 18 Network Data Analytics Function upgrades show over 200 contributions from Nokia, Ericsson, and Huawei on predictive QoS and autonomous fault correction. As closed-loop automation converges with analytics, operator buying centers now favor vendors able to span infrastructure, software, and managed services, elevating end-to-end orchestration above point tools.
Telecom Analytics Industry Leaders
Oracle Corporation
IBM Corporation
SAP SE
Microsoft Corporation
Huawei Technologies Co. Ltd
- *Disclaimer: Major Players sorted in no particular order


Recent Industry Developments
- February 2026: Nokia and Telefónica rolled out edge AI across 12 European markets, enabling real-time smart-city video analytics and cutting backhaul traffic 60%.
- February 2026: Deutsche Telekom, Orange, Telefónica, TIM, and Vodafone launched a federated edge continuum, enabling cross-border model training without violating GDPR.
- February 2026: IBM and GSMA projected a USD 12 billion SME analytics opportunity by 2030 as SaaS unbundling accelerates.
- January 2026: Nokia unveiled 5G edge inference hardware processing telemetry in under 5 milliseconds to enable autonomous adjustments.


Global Telecom Analytics Market Report Scope
Telecom analytics is a type of business intelligence specifically applied and packaged to satisfy the complex needs of telecommunication organizations. Telecom analytics is aimed at decreasing operational costs and maximizing profits by increasing sales, reducing fraud, and improving risk management.
The Telecom Analytics Market Report is Segmented by Application (Customer, Network, Marketing, Pricing, Service Quality, Fraud, and More), Deployment (Cloud, On-Premises, and Edge/Hybrid), Component (Software, and Services), End-User Size (SMEs, and Large Enterprises), Operator Type (MNOs, Fixed-Line, ISPs, MVNOs, and Converged), and Geography. The Market Forecasts are Provided in Terms of Value (USD).
| Customer Analytics |
| Network Analytics |
| Marketing and Sales Analytics |
| Pricing and Revenue-Management Analytics |
| Service Quality and Experience Analytics |
| Fraud Management Analytics |
| Rest of Application |
| Cloud |
| On-Premises |
| Edge / Hybrid |
| Software |
| Services |
| Small and Medium Enterprises (SMEs) |
| Large Enterprises |
| Mobile Network Operators (MNOs) |
| Fixed-Line Operators |
| Internet Service Providers (ISPs) |
| Mobile Virtual Network Operators (MVNOs) |
| Converged Operators |
| North America | United States |
| Canada | |
| Mexico | |
| South America | Brazil |
| Argentina | |
| Rest of South America | |
| Europe | Germany |
| United Kingdom | |
| France | |
| Italy | |
| Spain | |
| Rest of Europe | |
| Asia-Pacific | China |
| India | |
| Japan | |
| South Korea | |
| Australia and New Zealand | |
| Rest of Asia-Pacific | |
| Middle East | Saudi Arabia |
| United Arab Emirates | |
| Turkey | |
| Rest of Middle East | |
| Africa | South Africa |
| Nigeria | |
| Egypt | |
| Rest of Africa |
| By Application | Customer Analytics | |
| Network Analytics | ||
| Marketing and Sales Analytics | ||
| Pricing and Revenue-Management Analytics | ||
| Service Quality and Experience Analytics | ||
| Fraud Management Analytics | ||
| Rest of Application | ||
| By Deployment | Cloud | |
| On-Premises | ||
| Edge / Hybrid | ||
| By Component | Software | |
| Services | ||
| By End-User Enterprise Size | Small and Medium Enterprises (SMEs) | |
| Large Enterprises | ||
| By Telecom Operator Type | Mobile Network Operators (MNOs) | |
| Fixed-Line Operators | ||
| Internet Service Providers (ISPs) | ||
| Mobile Virtual Network Operators (MVNOs) | ||
| Converged Operators | ||
| By Geography | North America | United States |
| Canada | ||
| Mexico | ||
| South America | Brazil | |
| Argentina | ||
| Rest of South America | ||
| Europe | Germany | |
| United Kingdom | ||
| France | ||
| Italy | ||
| Spain | ||
| Rest of Europe | ||
| Asia-Pacific | China | |
| India | ||
| Japan | ||
| South Korea | ||
| Australia and New Zealand | ||
| Rest of Asia-Pacific | ||
| Middle East | Saudi Arabia | |
| United Arab Emirates | ||
| Turkey | ||
| Rest of Middle East | ||
| Africa | South Africa | |
| Nigeria | ||
| Egypt | ||
| Rest of Africa | ||


Key Questions Answered in the Report
How fast is spending on telecom analytics expected to grow between 2026-2031?
Revenue is projected to expand at a 10.15% CAGR, rising from USD 9.06 billion in 2026 to USD 14.69 billion by 2031.
Which application area commands the largest share today?
Customer Analytics leads with 28.16% of 2025 revenue by helping operators lower churn and boost lifetime value.
What deployment model is gaining momentum for latency-sensitive use cases?
Edge and Hybrid architectures are advancing at an 11.27% CAGR as autonomous-vehicle, AR, and industrial-IoT workloads require sub-10-millisecond response times.
Why are converged operators outpacing pure-play mobile carriers in growth?
Their ability to cross-sell fixed, mobile, and IPTV services fuels an 11.04% CAGR by unlocking richer customer-value analytics.
How are privacy laws shaping analytics architectures in Europe?
GDPR restrictions are driving federated-learning and edge-continuum models that train AI locally while sharing only model weights across borders.
What is the biggest hurdle for mid-tier operators in emerging markets?
A skills and awareness gap means many view analytics as an IT cost rather than a strategic asset, delaying investment decisions.
Page last updated on:


