Network Analytics Market Size and Share
Market Overview
| Study Period | 2020 - 2031 |
|---|---|
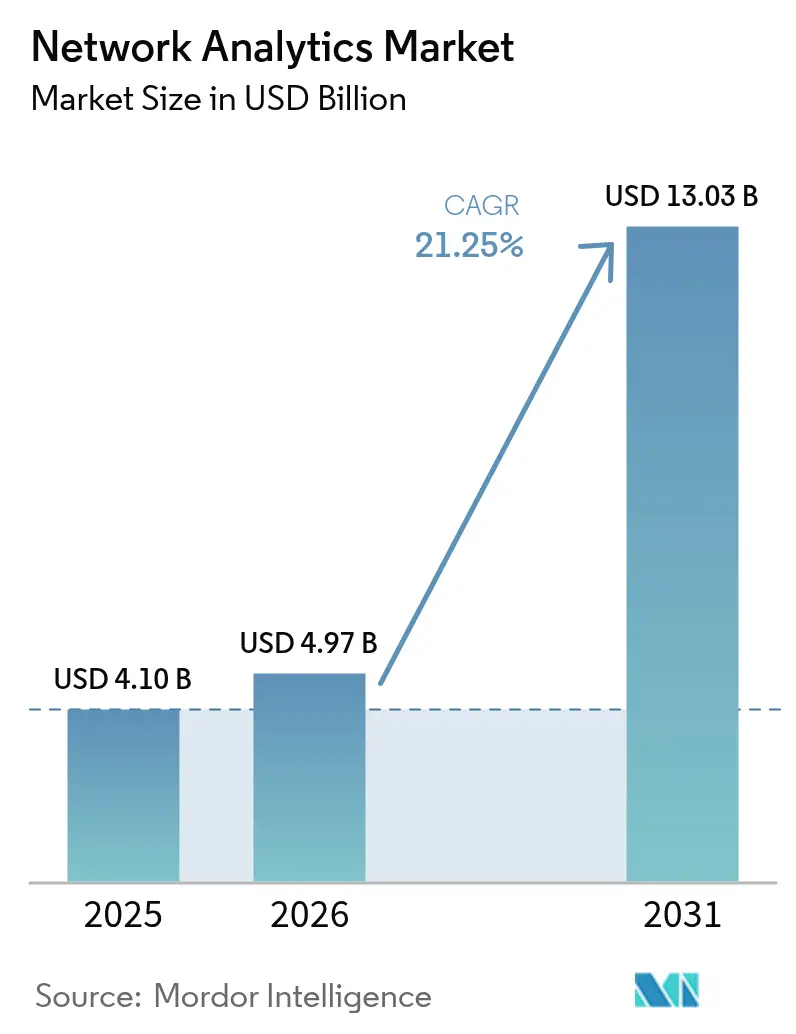
| Market Size (2026) | USD 4.97 Billion |
| Market Size (2031) | USD 13.03 Billion |
| Growth Rate (2026 - 2031) | 21.25% CAGR |
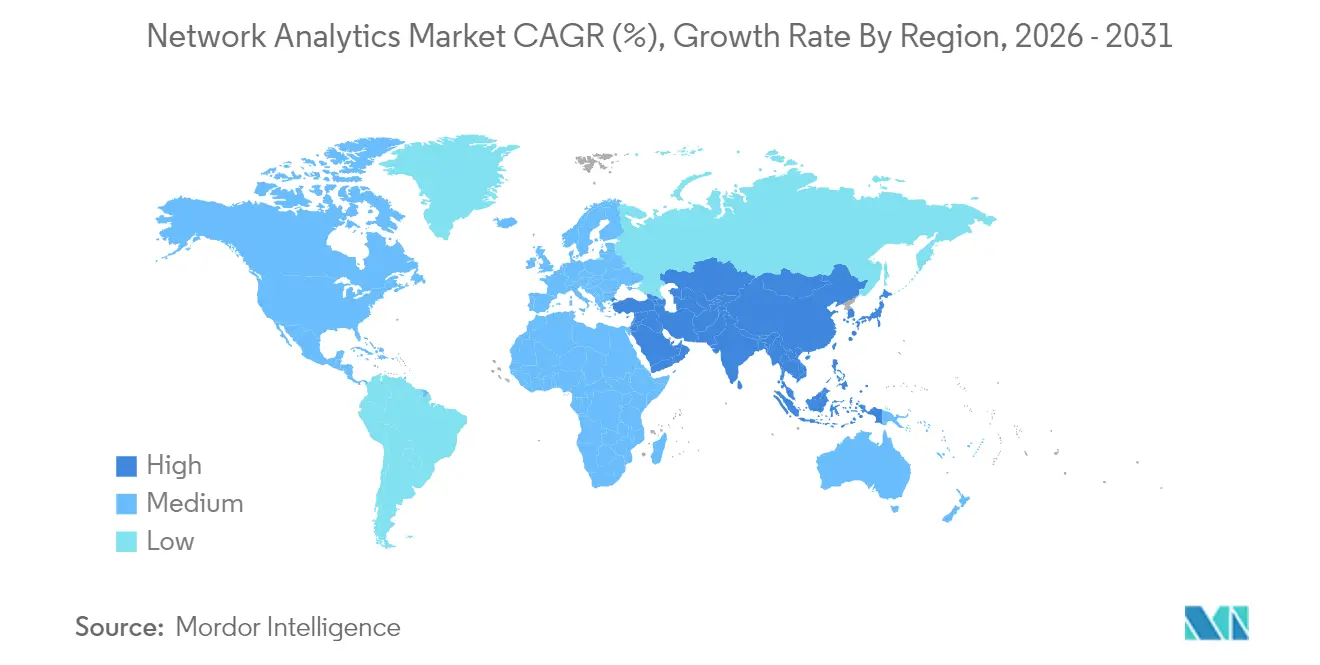
| Fastest Growing Market | Asia-Pacific |
| Largest Market | North America |
| Market Concentration | Medium |
Major Players *Disclaimer: Major Players sorted in no particular order Image © Mordor Intelligence. Reuse requires attribution under CC BY 4.0. | |
Network Analytics Market Analysis by Mordor Intelligence
The network analytics market size was valued at USD 4.10 billion in 2025 and estimated to grow from USD 4.97 billion in 2026 to reach USD 13.03 billion by 2031, at a CAGR of 21.25% during the forecast period (2026-2031). Rapid data-traffic growth, 5G roll-outs, and the surge in connected devices have pushed network analytics from simple monitoring to a core element of digital infrastructure strategy. Enterprises view analytics as essential for predictive maintenance, capacity planning, and security, while service providers use it to monetize programmable networks. Artificial intelligence now underpins most leading platforms, with 60% of technology executives planning AI-enabled automation to streamline operations[1]Chuck Robbins, “The Role of Predictive Automation in Modern Networks,” Cisco, cisco.com. Consolidation among vendors, illustrated by IBM’s USD 6.4 billion acquisition of HashiCorp, signals demand for end-to-end stacks that blend analytics with broader IT management. Although high initial costs and specialized skill shortages still hinder adoption, cloud delivery models and managed services are easing entry barriers.
Key Report Takeaways
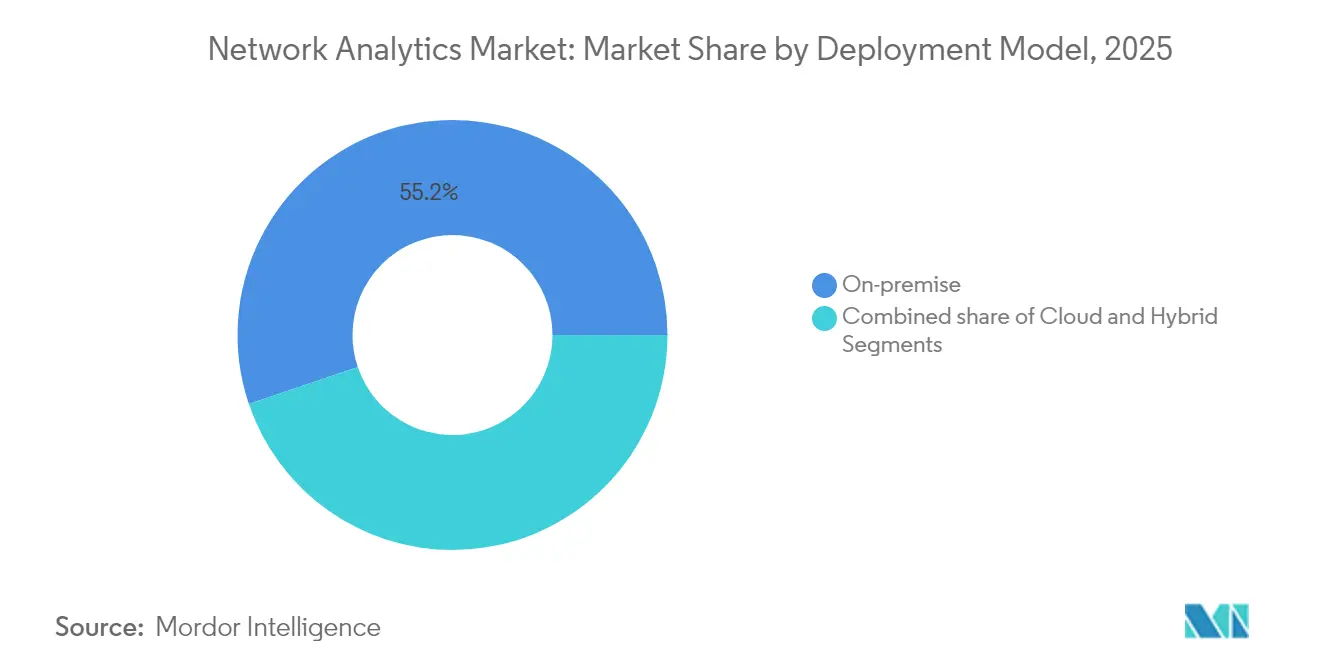
- By deployment model, on-premise installations led with 55.20% of the network analytics market share in 2025, while cloud deployments are set to advance at a 23.4% CAGR through 2031.
- By component, solutions captured 62.40% revenue share in 2025; services are forecast to grow the fastest at a 22.6% CAGR to 2031.
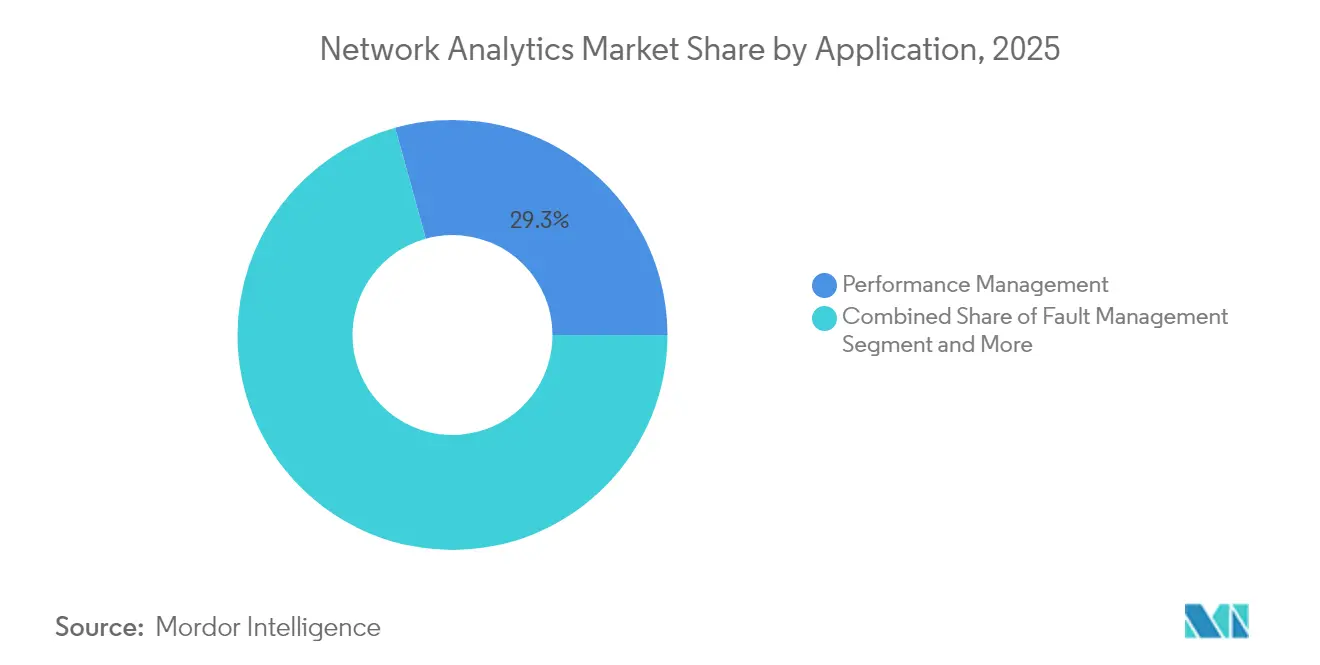
- By application, performance management held 29.30% of the network analytics market size in 2025, whereas security and anomaly detection are projected to expand at a 23.0% CAGR to 2031.
- By end user, communication service providers commanded 47.20% of the network analytics market size in 2025; cloud service providers exhibit the highest forecast CAGR of 22.3% through 2031.
- By geography, North America maintained a 37.60% revenue share in 2025; Asia-Pacific is poised for a 22.7% CAGR over 2026-2031.
Note: Market size and forecast figures in this report are generated using Mordor Intelligence’s proprietary estimation framework, updated with the latest available data and insights as of 2026.
Global Network Analytics Market Trends and Insights
Drivers Impact Analysis*
| Driver | (~) % Impact on CAGR Forecast | Geographic Relevance | Impact Timeline |
|---|---|---|---|
| Autonomous and self-managing networks | +5.8% | North America, Europe | Medium term (2-4 years) |
| IoT and machine-to-machine expansion | +4.7% | Asia-Pacific, Global | Long term (≥ 4 years) |
| 5G roll-out and data-traffic surge | +4.3% | North America, Europe, Developed APAC | Medium term (2-4 years) |
| Closed-loop AI digital-twin optimisation | +3.2% | North America, Europe | Long term (≥ 4 years) |
| API-driven “network-as-code” monetisation | +2.1% | North America, Emerging Europe & APAC | Medium term (2-4 years) |
| Source: Mordor Intelligence | |||
Need for Autonomous and Self-Managing Networks
Escalating network complexity and the cost of downtime—USD 9,000 per minute for cloud-centric firms—have intensified demand for self-healing infrastructure. AI-infused analytics platforms now predict and remediate faults, enabling a shift from reactive troubleshooting to proactive optimisation. Industries running mission-critical workloads increasingly depend on AIOps, with 72% of IT leaders planning platform-based architectures that merge analytics, automation, and observability[2]Chuck Robbins, “The Role of Predictive Automation in Modern Networks,” Cisco, cisco.com. As a result, vendors are embedding real-time anomaly detection and policy-driven orchestration to cut mean-time-to-repair and protect service-level objectives.
Rise of IoT and Machine-to-Machine Communications
Network analytics platforms have added device-level visibility, protocol decoding, and behavioural baselining to manage heterogeneous traffic. In manufacturing, utilities, and smart-city roll-outs, real-time analytics supports predictive maintenance and energy optimisation, unlocking measurable cost savings and uptime improvements.
Exponential Data Traffic and 5G Roll-Out Pressure
5G promises speeds 100-times faster than 4G and latency under 1 millisecond, supporting up to 1 million devices per square kilometre. Such density amplifies traffic bursts and slicing complexity. Communication service providers rely on analytics to model network slices, forecast capacity, and maintain quality of experience during live events. Real-time correlation of radio, core, and transport metrics now underpins differentiated guarantees for enterprise customers.
Closed-Loop AI Digital-Twin Optimisation
Digital twins replicate live networks for scenario testing, capacity planning, and change-risk assessment. When fused with AI, they have delivered a 32% improvement in issue-resolution time for early adopters[3]Rob Thomas, “Hybrid Cloud Strategy After HashiCorp,” IBM, ibm.com. Large enterprises simulate upgrades in a sandbox, deploy configurations confidently, and feed post-deployment telemetry back into the model, creating a virtuous optimisation cycle across planning, implementation, and operations.
API-Based Network-as-Code Monetisation Needs Real-Time Analytics
Programmable interfaces allow service providers to expose bandwidth, latency, and security features as on-demand services. Real-time analytics validate service-level agreements, detect malicious use, and inform dynamic pricing. Telecom carriers moving beyond connectivity now embed usage telemetry in product catalogues, enabling rapid micro-service launches that expand average revenue per user.
Restraints Impact Analysis*
| Restraint | (~) % Impact on CAGR Forecast | Geographic Relevance | Impact Timeline |
|---|---|---|---|
| High initial costs and uncertain RoI | -2.1% | Emerging Markets, Global | Short term (≤ 2 years) |
| Data-privacy and regulatory constraints | -1.8% | Europe, North America, APAC | Medium term (2-4 years) |
| AI/ML Ops skills gap | -1.5% | Emerging Markets, Global | Medium term (2-4 years) |
| Vendor lock-in through proprietary protocols | -1.2% | Global | Long term (≥ 4 years) |
| Source: Mordor Intelligence | |||
High Initial Costs and Uncertain Return on Investment
Comprehensive deployments require software licences, telemetry-ready hardware, systems integration, and staff training. Quantifying financial returns linked to reduced outages or improved customer experience remains challenging, particularly for small and mid-sized organisations. Subscription-based cloud delivery eases capital burdens, yet budget pressures in emerging economies still slow adoption.
Data-Privacy and Regulatory Constraints
Frameworks such as GDPR impose strict rules on data usage, storage, and transfer. Networks carrying personal or sensitive information must anonymise or localise traffic records, which complicates global analytics architectures. Vendors are responding with fine-grained data-masking, role-based access, and in-region processing options, yet shifting regulatory requirements continue to add compliance overhead.
*Our forecasts treat driver/restraint impacts as directional, not additive. The impact forecasts reflect baseline growth, mix effects, and variable interactions.
Segment Analysis
By Deployment Model: Cloud Adoption Accelerates Transformation
Cloud deployments are set to expand at a 23.4% CAGR, outpacing the overall network analytics market. The move is driven by elastic scalability, pay-as-you-go economics, and easier access for distributed teams. Despite that momentum, on-premise installations retained 55.20% revenue in 2025 due to heightened security and sovereignty needs. Hybrid architectures have gained favour as organisations bridge legacy investments with future agility, a trend reinforced by financial institutions, where 91% have already begun their cloud modernisation journeys.
Hybrid operating patterns illustrate a pragmatic view: workloads with stringent data-control requirements remain on-premise, while bursty analytic tasks shift to public clouds. This duality supports cost optimisation without sacrificing governance. Analysts note that 30% of enterprise workloads now sit in public clouds, with analytics and DevOps leading migrations. Vendors have responded by delivering containerised collectors, SaaS dashboards, and unified policy engines that span private and public domains. Continuous integration pipelines further embed analytics into daily operations, compressing development cycles.


By Component: Services Drive Long-Term Value Creation
Solutions dominated 2025 revenue with 62.40%, yet services are forecast to grow 22.6% annually as organisations seek specialised expertise. Consulting and integration engagements align analytics architectures with business objectives, while managed services offload daily tuning and rule-maintenance. The services wave mirrors broader IT outsourcing patterns; the managed service provider segment is projected to reach USD 350 billion in 2024 and top USD 1 trillion by 2033.
Service partners increasingly deliver AI-driven advisory offerings that contextualise performance insights into business outcomes. Enterprises adopting such models have reported 20-30% cost savings and up to 25% productivity gains. To meet demand, vendors package runbooks, pre-trained models, and remote SOC capabilities, shortening time to value and mitigating the AI skills gap. This evolution cements services as a cornerstone of the network analytics market, unlocking recurring revenue and deeper client relationships.
By Application: Security Concerns Drive Analytics Adoption
Security and anomaly-detection platforms are projected to grow at a 23.0% CAGR, eclipsing performance management and fault management ambitions. The data-breach cost for professional-services firms is prompting boards to scrutinise protective controls. AI-powered analytics correlates trillions of packets, logs, and flow records to surface subtle attack patterns in near real time. Consequently, many organisations now deploy a unified analytics fabric that stitches together security, performance, and customer-experience insights.
Although performance management held 29.30% share in 2025, its role is evolving toward root-cause analysis that spans hybrid and multi-cloud estates. Smart-routing engines and traffic-optimisation algorithms use live telemetry to reroute flows away from congestion or malicious activity, preserving user experience while lowering bandwidth costs. Customer-experience analytics further ties technical metrics to sentiment, enabling proactive service credits and retention campaigns.
By End User: Cloud Providers Reshape Analytics Landscape
Communication service providers led with 47.20% of 2025 revenue, yet cloud providers form the fastest-growing cohort at a 22.3% CAGR. Hyperscalers apply analytics to balance compute loads, detect east-west threat vectors, and assure inter-region connectivity. Their innovation cadence is pressuring traditional telcos to adopt similar real-time intelligence or risk commoditisation. Enterprises in banking, healthcare, and retail also accelerate uptake, aligning network visibility with regulatory compliance and omnichannel experiences.
The Cloud Performance Report comparing AWS, Microsoft Azure, and Google Cloud underscores rising demand for vendor-neutral telemetry that benchmarks availability and latency across regions. Organisations integrate such comparative data with internal flows to determine workload placement and negotiate service-level objectives. As cloud providers mainstream network analytics, they also embed open APIs that foster an ecosystem of value-added partners.
Geography Analysis
North America retained 37.60% revenue share in 2025, supported by early adoption, sizeable IT budgets, and an advanced supplier ecosystem. United States financial-services and healthcare organisations deploy AI-infused analytics to satisfy stringent uptime and privacy mandates. Canadian carriers use analytics to optimise nationwide 5G roll-outs and manage rural-coverage obligations. Regulatory clarity and abundant talent expedite experimentation with predictive automation, keeping the region at the forefront of innovation.
Asia-Pacific is the fastest-growing region with a 22.7% CAGR to 2031. China and India fund large-scale 5G, smart-city, and industrial-IoT projects that demand granular visibility into multi-vendor environments. Japan and South Korea integrate AI with network monitoring to support autonomous-vehicle trials and factory automation, while Australia leverages analytics to protect critical infrastructure from cyber threats.
Europe advances amid stringent regulations and heightened security awareness. United Kingdom and Germany lead adoption in financial services and manufacturing, seeking GDPR-compliant insights across hybrid architectures. France and Italy augment telecom deployments to maintain customer satisfaction in competitive mobile markets. Energy and utilities operators in Northern and Eastern Europe deploy analytics to detect anomalies in smart-grid telemetry. Vendors thriving in the region emphasise data-sovereignty controls, granular user-access policies, and automated compliance reporting.

Competitive Landscape
The network analytics market shows moderate concentration. Cisco, IBM, and Juniper Networks combine broad portfolios with global support, reinforcing incumbent positions. Each has embedded machine-learning engines and intent-based orchestration to differentiate from commoditised packet capture tools. Specialised firms such as SAS Institute and Sandvine compete through depth in high-speed flow analytics or subscriber-aware use cases, pushing larger rivals to accelerate innovation.
Strategic acquisitions illustrate the race toward integrated stacks. IBM’s purchase of HashiCorp widens its hybrid-cloud reach, while Cisco’s addition of ThousandEyes extends visibility to the public internet. Hewlett Packard Enterprise bolstered its Aruba networking line with high-capacity switches for AI workloads[4]David Hughes, “Delivering AI-Ready Switching Fabric,” Hewlett Packard Enterprise, hpe.com. Vendor roadmaps emphasise ease of use, guided remediation, and cross-domain correlation to serve non-specialist operators.
White-space growth lies in quantum-safe encryption analytics, zero-trust policy validation, and vertical-specific solutions that embed domain ontologies. Vendors forging partnerships with cloud hyperscalers and security-information platforms gain early-mover advantage. Competitive intensity is likely to increase as open-source collectors and telemetry standards erode proprietary moats, propelling vendors toward value-added data science and outcome-based pricing.
Network Analytics Industry Leaders
Accenture PLC
Cisco Systems Inc.
Hewlett Packard Enterprise Company
IBM Corporation
Juniper Networks
- *Disclaimer: Major Players sorted in no particular order


Recent Industry Developments
- June 2025: Zscaler unveiled advanced AI security capabilities and the ZDX Network Intelligence module to benchmark ISP performance.
- May 2025: Hewlett Packard Enterprise expanded the HPE Aruba Networking portfolio with high-capacity CX 10040 and CX 6300M switches for AI and IoT workloads.
- May 2025: TP ICAP acquired Neptune Networks to integrate real-time bond data with Liquidnet’s electronic-trading platform, forming a global D2C credit business.
- February 2025: Ericsson introduced new radios, RAN Connect products, and 5G Advanced showcases at MWC 2025, emphasizing network programmability and sustainability.
- January 2025: IBM completed the USD 6.4 billion acquisition of HashiCorp to enhance hybrid-cloud automation and analytics.
- January 2025: Cisco reorganised its strategy around AI-driven networking and security, unveiling AI Pods and the Hypershield fabric in collaboration with Nvidia.


Research Methodology Framework and Report Scope
Market Definitions and Key Coverage
In this study, we consider the network analytics market to comprise software and related managed-service revenues derived from tools that collect, enrich, and analyze packet, flow, and telemetry data so operators can predict performance, optimize routing, and detect security anomalies across fixed, mobile, and cloud fabrics. Our scope tracks only commercial off-the-shelf platforms and subscription services purchased by communication service providers, cloud service providers, and large enterprises.
Scope exclusion: custom in-house toolsets and pure hardware probes are not counted.
Segmentation Overview
- By Deployment Model
- On-premise
- Cloud
- Hybrid
- By Component
- Solutions
- Network intelligence platforms
- Performance management
- Security analytics
- Root-cause and anomaly detection
- Traffic optimisation
- Services
- Professional services
- Managed services
- Solutions
- By Application
- Performance management
- Fault management
- Customer experience management
- Security and anomaly detection
- Smart routing and traffic optimisation
- By End User
- Communication service providers
- Telecom providers
- Internet service providers
- Satellite communication providers
- Cable network providers
- Cloud service providers
- Enterprises
- Banking, Financial Services, and Insurance (BFSI)
- Healthcare
- Retail and e-commerce
- Manufacturing
- Government and public sector
- Communication service providers
- By Geography
- North America
- United States
- Canada
- South America
- Brazil
- Rest of South America
- Europe
- United Kingdom
- Germany
- France
- Italy
- Spain
- Russia
- Rest of Europe
- Asia-Pacific
- China
- Japan
- India
- South Korea
- Australia and New Zealand
- Rest of Asia-Pacific
- Middle East and Africa
- Middle East
- Saudi Arabia
- United Arab Emirates
- Turkey
- Rest of Middle East
- Africa
- South Africa
- Rest of Africa
- Middle East
- North America
Detailed Research Methodology and Data Validation
Primary Research
Mordor analysts interviewed network-planning heads at tier-1 telcos, cloud infrastructure architects, and analytics-platform product managers across North America, Europe, and Asia-Pacific. These conversations validated adoption triggers, unit pricing bands, and emerging KPI dashboards that secondary sources rarely disclose.
Desk Research
Our desk work pulled quantitative baselines from public sources such as the International Telecommunication Union, GSMA Intelligence, the US FCC spectrum dashboard, Eurostat ICT surveys, and OECD broadband series, which are then complemented with patent trends from Questel and company 10-K filings. Traffic statistics published by the Ericsson Mobility Report and regional regulator portals provided high-frequency indicators of data-volume growth. Proprietary reads from D&B Hoovers and Dow Jones Factiva helped map vendor revenue splits. This list is illustrative; many additional open datasets were consulted to corroborate figures.
Market-Sizing & Forecasting
A top-down demand pool was first established from 5G subscriber additions, average data traffic per user, and SDN-enabled port counts, before being further filtered through historical spending ratios on analytics. Select bottom-up checks, supplier revenue roll-ups and sampled average selling price multiplied by deployment volume, were used to tune totals. Forecasts rely on multivariate regression, linking spend to variables such as telco opex automation targets, cloud migration rate, and IoT device density. Gaps in granular vendor data were bridged with triangulated ranges agreed during expert calls.
Data Validation & Update Cycle
Model outputs pass anomaly checks against independent market proxies, after which senior reviewers sign off. Reports refresh each year, with interim revisions when material M&A or regulatory shifts occur; a final sense-check is performed immediately before release.
Why Mordor's Network Analytics Baseline Stays Reliable
Published estimates often differ because firms select dissimilar component mixes, exchange-rate cut-offs, and refresh cadences.
Key gap drivers in this space include whether cloud-native observability modules are counted, how aggressively 5G-linked license fees are annualized, and the frequency with which vendor guidance is re-benchmarked against currency shifts and inflation resets.
Benchmark comparison
| Market Size | Anonymized source | Primary gap driver |
|---|---|---|
| USD 4.10 B (2025) | Mordor Intelligence | - |
| USD 2.72 B (2024) | Global Consultancy A | Excludes cloud-delivered analytics and uses static 2022 FX rates |
| USD 4.70 B (2024) | Trade Journal B | Counts adjacent AIOps tools but refreshes only every three years |
These comparisons show that Mordor's disciplined scoping, annual currency rebasing, and dual-track validation produce an even-handed, decision-ready baseline clients can trust.


Key Questions Answered in the Report
What is the current value of the network analytics market?
The market stands at USD 4.97 billion in 2026 and is projected to grow to USD 13.03 billion by 2031.
Which region leads revenue in network analytics solutions?
North America leads with 37.60% revenue share in 2025, propelled by early adoption and large-scale 5G investments.
Why are cloud service providers the fastest-growing end-user segment?
Their 22.3% CAGR reflects the need to optimise complex, distributed infrastructures and ensure high-performance service delivery.
How does AI improve network analytics outcomes?
AI enables predictive maintenance, automated remediation, and security anomaly detection, cutting resolution time by up to 32% in some deployments.
What deployment model is growing the fastest?
Cloud deployments are expanding at a 23.4% CAGR due to scalability, lower upfront costs, and rapid service roll-out.
Page last updated on:


