Customer Journey Analytics Market Size and Share
Market Overview
| Study Period | 2020 - 2031 |
|---|---|
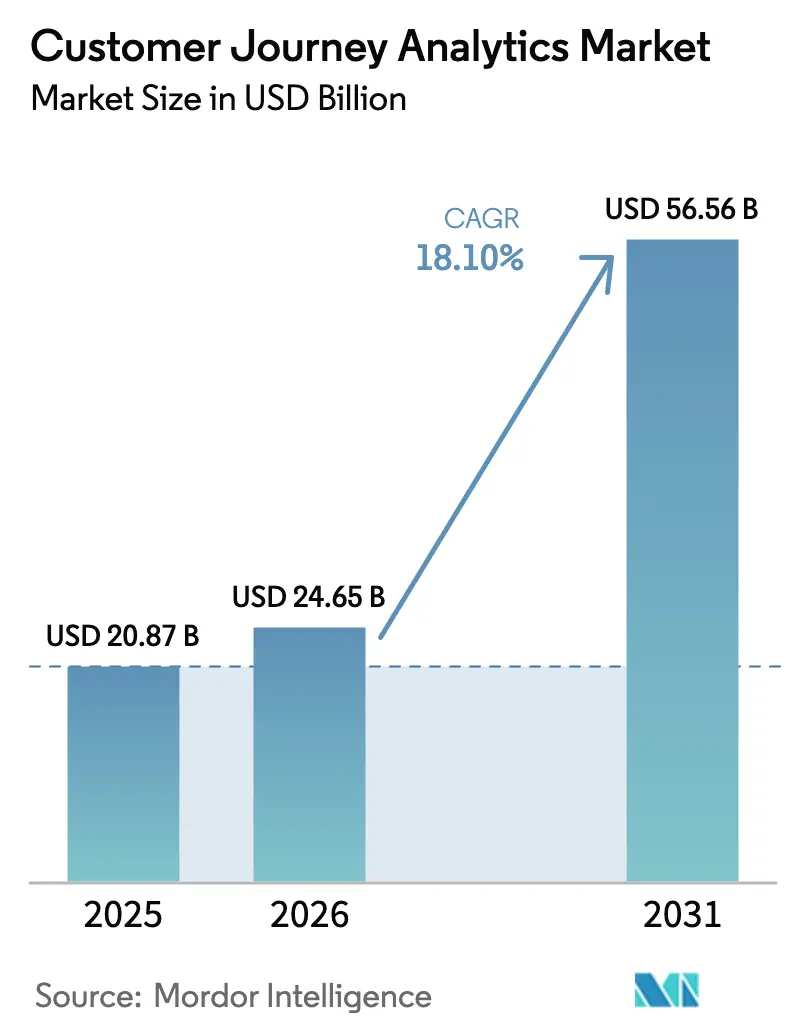
| Market Size (2026) | USD 24.65 Billion |
| Market Size (2031) | USD 56.56 Billion |
| Growth Rate (2026 - 2031) | 18.10% CAGR |
| Fastest Growing Market | Asia Pacific |
| Largest Market | North America |
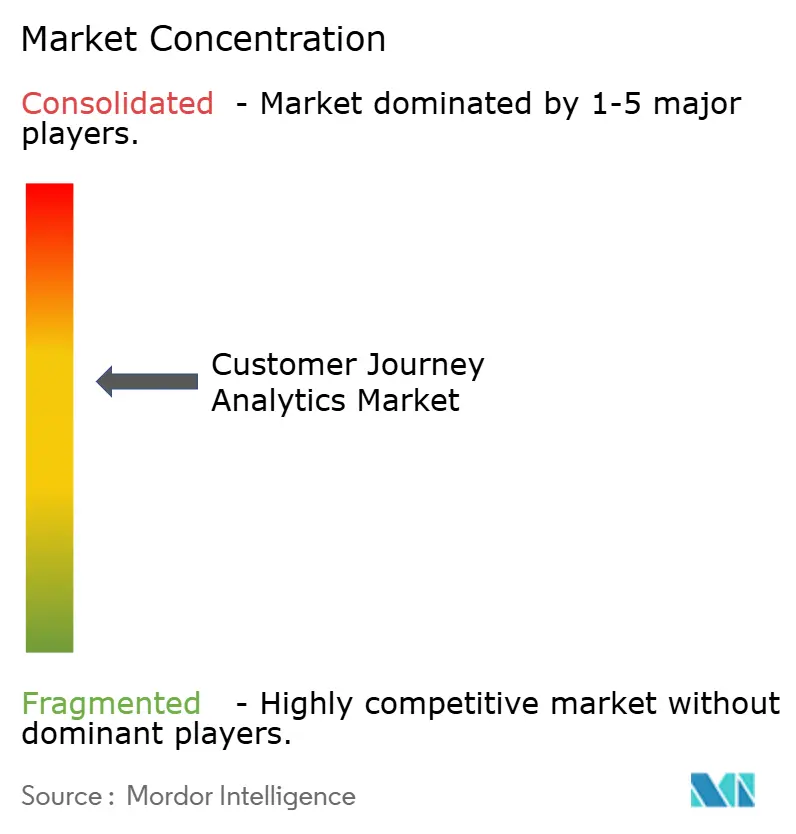
| Market Concentration | Medium |
Major Players *Disclaimer: Major Players sorted in no particular order Image © Mordor Intelligence. Reuse requires attribution under CC BY 4.0. | |
Customer Journey Analytics Market Analysis by Mordor Intelligence
Customer journey analytics market size in 2026 is estimated at USD 24.65 billion, growing from 2025 value of USD 20.87 billion with 2031 projections showing USD 56.56 billion, growing at 18.10% CAGR over 2026-2031. Growth is propelled by the rapid integration of generative AI, the move to privacy-compliant first-party data strategies, and enterprises’ urgency to orchestrate real-time, cross-channel experiences. Adobe noted a 50% revenue lift in its Experience Cloud as AI-powered decisioning became mainstream. Deprecation of third-party cookies forces brands to invest in data clean rooms, while stricter global privacy laws accelerate demand for consent-by-design analytics. Cloud deployment remains the preferred architecture because elastic compute is required for sub-second predictions, yet regulated industries still adopt hybrid models to satisfy data-sovereignty rules. Competitive differentiation hinges on the depth of ecosystem integrations, which create high switching costs and concentrate spending among a small set of platform leaders.
Key Report Takeaways
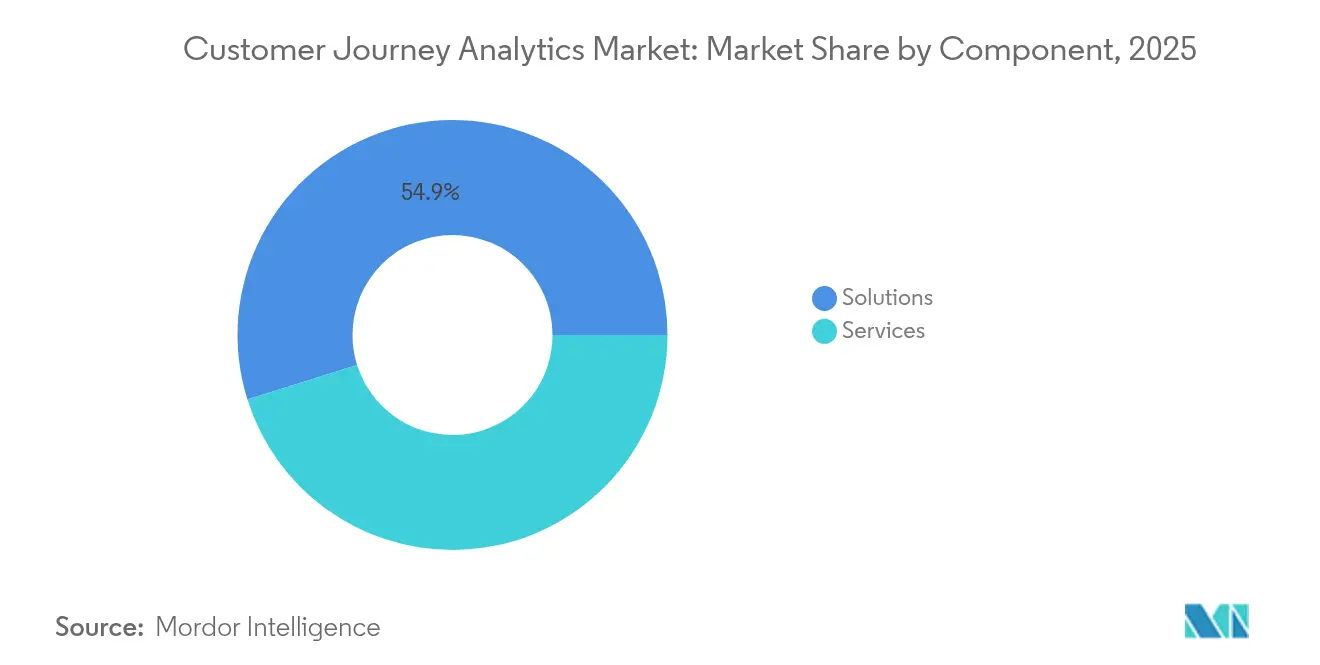
- By component, solutions held 54.85% of the customer journey analytics market share in 2025; Services are forecast to grow at 23.10% CAGR through 2031.
- By deployment mode, cloud captured 61.65% of the customer journey analytics market size in 2025 and is projected to expand at 25.10% CAGR to 2031.
- By application, journey mapping and visualisation led with 32.60% revenue share in 2025; Campaign and Journey Orchestration will advance at a 25.40% CAGR through 2031.
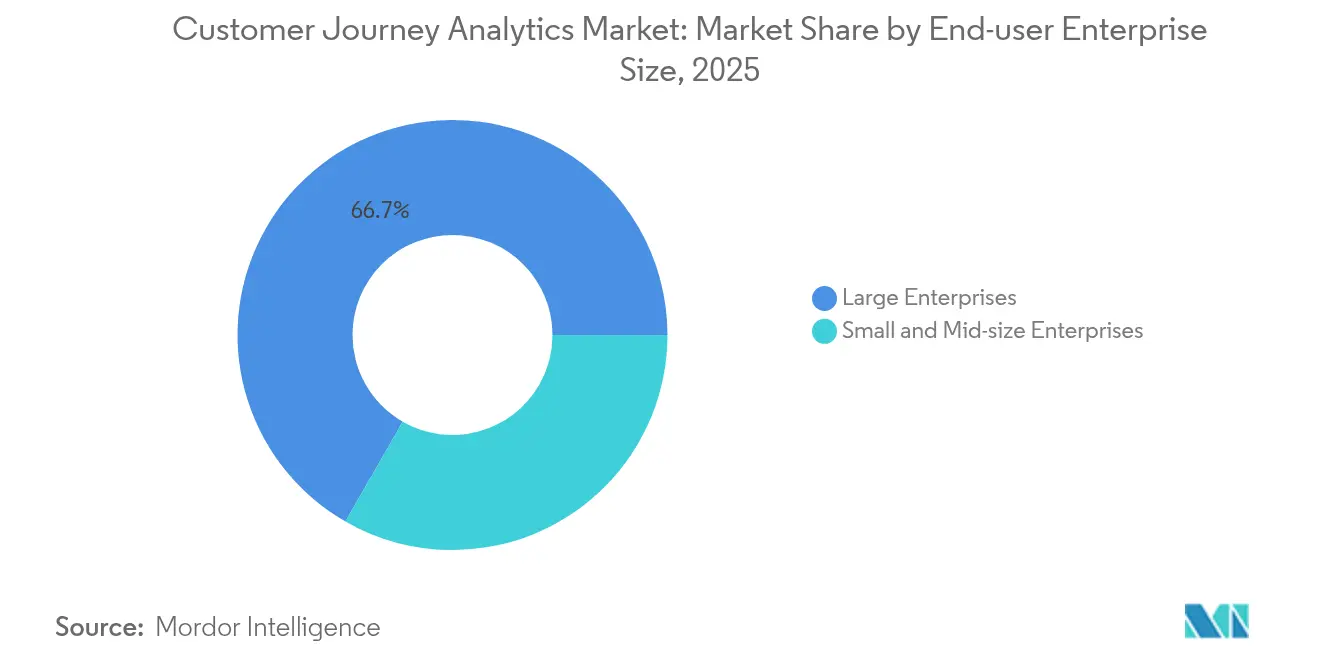
- By end-user enterprise size, large enterprises commanded 66.70% share of the customer journey analytics market size in 2025, whereas SMEs will post a 26.00% CAGR to 2031.
- By end-user industry, BFSI held 25.75% share in 2025; Retail and eCommerce is the fastest-growing segment at 28.00% CAGR to 2031.
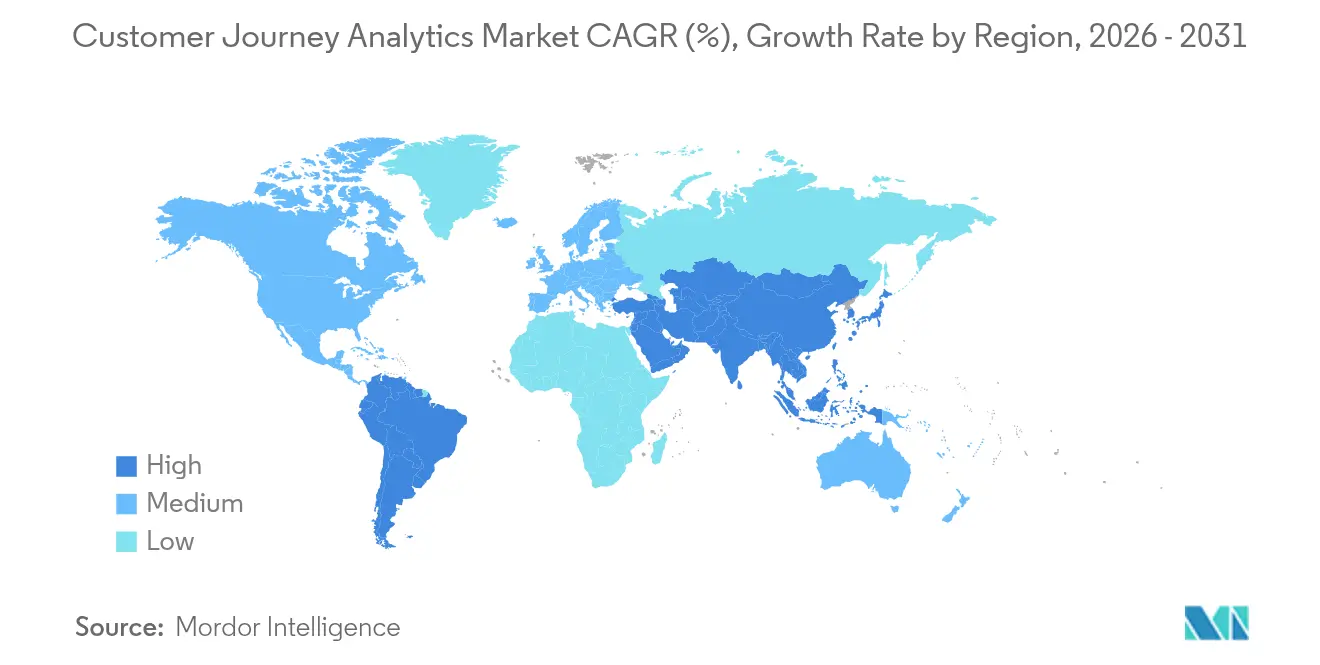
- By geography, North America led with 42.10% share in 2025, while Asia-Pacific is set to expand at a 25.00% CAGR through 2031.
Note: Market size and forecast figures in this report are generated using Mordor Intelligence’s proprietary estimation framework, updated with the latest available data and insights as of 2026.
Global Customer Journey Analytics Market Trends and Insights
Drivers Impact Analysis*
| Driver | (~) % Impact on CAGR Forecast | Geographic Relevance | Impact Timeline |
|---|---|---|---|
| AI-driven personalisation surge | +4.2% | Global, with early gains in North America and Europe | Medium term (2-4 years) |
| Growing volume of digital touchpoints | +3.8% | Global, accelerated in Asia-Pacific emerging markets | Short term (≤ 2 years) |
| Omnichannel CX as competitive battleground | +3.1% | North America and EU core, spill-over to Asia-Pacific | Medium term (2-4 years) |
| Real-time retention analytics adoption | +2.7% | Global, concentrated in Retail and BFSI sectors | Short term (≤ 2 years) |
| Generative-AI-based journey prediction | +2.4% | North America and EU early adopters | Long term (≥ 4 years) |
| First-party data clean rooms post-cookie | +1.9% | Global, regulatory-driven in EU and California | Medium term (2-4 years) |
| Source: Mordor Intelligence | |||
AI-driven personalisation surge
Generative AI converts descriptive journey data into predictive orchestration by interpreting unstructured signals and producing next-best-action recommendations. Adobe’s Experience Platform processes billions of events daily and delivers 62% more personalised campaigns than rule-based systems. Microsoft reports that Dynamics 365 Customer Insights users cut journey-design time by 75% after deploying AI agents. Real-time inference elevates conversion rates and raises the entry bar for late adopters because success depends on modern data pipelines and scarce AI talent.
Growing volume of digital touchpoints
Customers now interact across 8–12 channels per journey, producing terabytes of behavioural data that legacy systems cannot unify quickly. Sprinklr notes that voice assistants, IoT devices and AR interfaces are adding new event streams every quarter. Cloud-native architectures scale elastically to support sudden traffic spikes, while edge nodes perform low-latency preprocessing for sensor data. Companies that integrate these signals gain a holistic view, whereas firms with data silos report rising churn and lower lifetime value.
Omnichannel CX as competitive battleground
Qualtrics research shows firms with strong omnichannel experiences retain 89% of customers versus 33% for weak performers. Modern platforms link web, store, contact-centre and social interactions to surface friction points and trigger corrective actions. NICE indicates that 76% of consumers expect brands to understand needs across every touchpoint. Brands that operationalise these insights grow share, while channel-centric rivals lose loyalty.
Real-time retention analytics adoption
CMSWire highlights that sub-second churn-propensity scoring improves retention by 20% in subscription models. Advanced models blend behavioural trends with external context to uncover early churn indicators and prompt personalised rescue offers. Investment in streaming architectures is essential, yet cost of real-time compute challenges smaller budgets, reinforcing the gap between analytics leaders and laggards.
Restraints Impact Analysis*
| Restraint | (~) % Impact on CAGR Forecast | Geographic Relevance | Impact Timeline |
|---|---|---|---|
| Cross-channel data integration complexity | -2.8% | Global, acute in legacy enterprise environments | Short term (≤ 2 years) |
| Heightened data-privacy regulation | -2.1% | EU and California leading, global expansion | Medium term (2-4 years) |
| Scarcity of journey data-science talent | -1.7% | Global, concentrated in developed markets | Long term (≥ 4 years) |
| Rising real-time compute costs | -1.4% | Global, impacting high-volume applications | Short term (≤ 2 years) |
| Source: Mordor Intelligence | |||
Cross-channel data integration complexity
Enterprises often run 8–12 customer-facing systems, each with unique formats and batch cycles, creating blind spots that degrade journey analytics. CMSWire reports that integration hurdles delay project timelines and inflate total cost of ownership. Legacy APIs resist modern governance requirements, forcing costly refactoring or acceptance of incomplete views that impair decision-making.
Heightened data-privacy regulation
GDPR, CCPA and similar laws introduce consent management burdens and limit data granularity. Amplitude highlights that firms must redesign data flows for purpose limitation and deletion requests, stretching resources and slowing innovation [1]Amplitude, “Privacy-First Analytics Architecture Guide 2024,” amplitude.com. High-profile litigation, such as actions against companies sharing personal data without explicit consent, raises reputational risk and caps the pace of analytics rollout.
*Our forecasts treat driver/restraint impacts as directional, not additive. The impact forecasts reflect baseline growth, mix effects, and variable interactions.
Segment Analysis
By Component: Services accelerate AI implementation
Solutions retained a 54.85% customer journey analytics market share in 2025, yet the Services segment is expanding at 23.10% CAGR as organisations seek specialised expertise to connect platforms with desired outcomes. Services teams provide consulting, data-integration, model-training and managed-operations workstreams that many enterprises lack internally. The customer journey analytics market size for Services is projected to climb steeply as generative AI demands multidisciplinary skill sets and continuous optimisation. Vendors bundle advisory and managed services into multi-year contracts, creating predictable revenue and tighter account control.
Implementation challenges drive demand. Enterprises must reconcile siloed data, build identity graphs and set up reinforcement-learning models. Service partners shoulder this complexity, accelerate time-to-value and retrain models when behaviours shift. As journey analytics becomes mission-critical, boards sanction larger operating budgets for external specialists, supporting double-digit growth even as platform revenue moderates.


By Deployment Mode: Cloud dominance accelerates
Cloud accounted for 61.65% of the customer journey analytics market share in 2025 and will grow at 25.10% CAGR through 2031 because elastic compute and specialised AI hardware are required for real-time inference. Customer journey analytics market size for cloud deployments is expected to rise sharply as brands prefer usage-based pricing that aligns cost with digital-engagement peaks. Hybrid models address sovereignty rules by keeping sensitive data in-country while offloading model training to the public cloud. On-premises persists in defence and healthcare but continues to erode as regulators clarify cloud frameworks.
Latency, scale and cost advantages underpin cloud’s rise. Streaming engines ingest millions of events per second, auto-scaling clusters prevent throttling during flash sales, and serverless pipelines lower idle costs. Vendors now offer pre-certified blueprints that meet ISO 27001 and HIPAA requirements, reducing risk perceptions and accelerating migrations.
By Application: Campaign orchestration drives innovation
Journey Mapping and Visualisation retained a 32.60% share in 2025 because it is the entry point for discovering pain points, yet Campaign and Journey Orchestration will expand at 25.40% CAGR as firms prioritise actions over insights. Customer journey analytics market size for orchestration use cases is rising alongside real-time recommendation engines. AI agents now assemble micro-segments, generate creative, and trigger personalised offers across channels, tightening the loop between insight and outcome.
Privacy changes boost Behaviour and Attribution analytics. Cookieless measurement forces enterprises to stitch first-party signals into statistical attribution models that link media exposure to sales without device-level identifiers. Product teams increasingly tap journey data to inform roadmap decisions, extending analytics beyond marketing into RandD and operations.
By End-user Enterprise Size: SME adoption accelerates
Large Enterprises held 66.70% of spending in 2025, yet SMEs are scaling at 26.00% CAGR because low-code platforms and SaaS delivery remove infrastructure hurdles. Cloud subscriptions priced by monthly events level the field, allowing mid-market retailers or fintech firms to run advanced analytics without capital outlay. The customer journey analytics market supports freemium tiers that prove value quickly, then upsell to enterprise editions as data volumes grow.
Integrated business suites such as Dynamics 365 bundle customer data, marketing automation and analytics in one licence, making adoption frictionless for resource-constrained firms . Vendors also offer industry-specific templates that cut configuration time and provide benchmark dashboards, speeding ROI.
By End-user Industry: Retail transformation leads growth
BFSI represented 25.75% share in 2025 owing to its history of analytics for fraud and personal finance advice. Retail and eCommerce will outpace all verticals at 28.00% CAGR as shoppers expect personalised offers and instant fulfilment across digital and physical stores. Customer journey analytics market size gains in retail correlate directly with transaction lift, making budget approval straightforward.
Healthcare adoption rises as patient experience links to reimbursement metrics and operational efficiency. Telecom operators harness journey data to reduce call-centre load and pre-empt network churn. Media companies deploy real-time recommendation engines to increase session length and ad inventory value, demonstrating the horizontal applicability of journey analytics once data foundations are in place.
Geography Analysis
North America led with 42.10% customer journey analytics market share in 2025 due to a high concentration of technology vendors, venture funding and enterprises comfortable with cloud AI. Microsoft recorded 33% Azure growth and 19% Dynamics 365 revenue gains, signalling sustained investment in analytics platforms . Financial services and retail spearheaded adoption, with healthcare rapidly catching up as patient experience mandates intensified. Nevertheless, talent shortages inflate wages and could temper growth unless automation bridges the skills gap.
Asia-Pacific is the fastest-growing region at 25.00% CAGR through 2031. Mobile-first consumers generate large first-party data sets, and governments actively promote AI adoption to drive competitiveness. Challenges include patchy cloud infrastructure outside tier-one cities and ongoing semiconductor constraints that may curtail hardware procurement.
Europe posts steady gains on the back of GDPR-compliant frameworks that give clear guidance on lawful processing. Banks leverage journey analytics to meet know-your-customer rules and personalise offers, while retailers merge in-store and online data to compete with global marketplaces. The region champions ethical AI and algorithmic transparency, positioning European vendors for export as global rules converge on similar principles. Multilingual data adds complexity, yet advances in language models reduce localisation overhead.

Competitive Landscape
The customer journey analytics market shows moderate concentration. Adobe, Salesforce, Microsoft and IBM anchor enterprise suites and embed analytics natively, discouraging rip-and-replace. Adobe disclosed USD 125 million in AI annual recurring revenue and plans to double that figure by enriching personalisation modules. Salesforce deepens Einstein AI across Sales, Service and Marketing Clouds to cement platform stickiness. IBM integrates journey analytics into watsonx to differentiate on trusted AI governance.
Specialists such as Amplitude and Contentsquare win digital-native brands with product-led growth and intuitive interfaces. NICE and Medallia tailor vertical solutions for contact-centre and hospitality, respectively, capturing segments underserved by generalists. Competitive intensity increases as start-ups exploit gaps in privacy-preserving analytics, real-time compute and edge deployment.
Consolidation is accelerating. Braze paid USD 325 million for OfferFit to embed reinforcement-learning experimentation, while Uniphore bought ActionIQ to launch Zero Data AI journeys that minimise personal data movement. Strategic buyers prioritise AI talent and proprietary models, suggesting further Merger and Acqusition among mid-cap vendors. Sustainable differentiation now hinges on model quality, ecosystem partnerships and demonstrable ROI rather than feature breadth alone.
Customer Journey Analytics Industry Leaders
Salesforce Inc.
Adobe Inc.
IBM Corporation
Microsoft Corporation
SAP SE
- *Disclaimer: Major Players sorted in no particular order

Recent Industry Developments
- March 2025: Braze acquired OfferFit for USD 325 million, adding AI-driven experimentation that automates journey optimisation.
- March 2025: Adobe introduced the Experience Platform Agent Orchestrator to let businesses deploy cooperating AI agents for CX decisioning.
- January 2025: mParticle merged with Rokt to combine real-time data infrastructure with commerce-media monetisation, delivering 50% better engagement for shared clients.
- January 2025: Contentstack bought Lytics to fuse real-time customer data with its Digital Experience Platform and simplify personalised content delivery.


Research Methodology Framework and Report Scope
Market Definitions and Key Coverage
Our study defines the customer journey analytics market as every cloud or on-premise software solution, plus associated services, that unifies, tracks, and evaluates customer interactions across web, mobile app, email, social, store, and call-center touchpoints to create journey-level insights and actions. We value the industry on the basis of revenues generated from these solutions and services.
Scope Exclusions: Pure customer data platforms, generic web analytics tools, and bespoke consulting engagements lie outside this boundary.
Segmentation Overview
- By Component
- Solutions
- Services
- By Deployment Mode
- Cloud
- On-premises
- Hybrid
- By Application
- Journey Mapping and Visualisation
- Campaign and Journey Orchestration
- Brand and Product Management
- Customer Behaviour and Attribution
- By End-user Enterprise Size
- Large Enterprises
- Small and Mid-size Enterprises
- By End-user Industry
- BFSI
- Retail and eCommerce
- IT and Telecom
- Healthcare and Life-sciences
- Media and Entertainment
- Travel and Hospitality
- Automotive and Mobility
- Others
- By Geography
- North America
- United States
- Canada
- Mexico
- South America
- Brazil
- Argentina
- Rest of South America
- Europe
- Germany
- United Kingdom
- France
- Italy
- Spain
- Russia
- Rest of Europe
- Asia-Pacific
- China
- Japan
- India
- South Korea
- Australia and New Zealand
- Rest of Asia-Pacific
- Middle East and Africa
- Middle East
- Saudi Arabia
- United Arab Emirates
- Turkey
- Rest of Middle East
- Africa
- South Africa
- Nigeria
- Egypt
- Rest of Africa
- Middle East
- North America
Detailed Research Methodology and Data Validation
Primary Research
We speak with software vendors, system integrators, and enterprise CX leaders across North America, Europe, and Asia Pacific. These discussions validate deployment counts, typical average selling prices, emerging use cases, and any assumptions flagged during desk work.
Desk Research
Our analysts begin with open data from the United States Census Bureau, Eurostat, OECD Digital Economy papers, and associations such as the Direct Marketing Association and the Interactive Advertising Bureau to map digital adoption, online spending, and marketing outlays. Company 10-Ks, IPO prospectuses, and earnings transcripts ground vendor pricing, contract sizes, and renewal ratios. Paid repositories like D&B Hoovers and Dow Jones Factiva add detailed revenue splits and M&A disclosures. The sources cited here are illustrative; many additional outlets inform the database.
Market-Sizing & Forecasting
A single top-down pool starts with global digital advertising and e-commerce flows, which are then filtered through industry and size level journey analytics penetration rates. Select bottom-up checks, sampled vendor billings, partner channel feedback, and average subscription price times seats align or adjust totals. Key model inputs include omnichannel transaction growth, cloud migration rates, MarTech budgets, privacy regulation timelines, and AI feature uptake. Multivariate regression combined with scenario analysis yields the 2025 to 2030 outlook.
Data Validation & Update Cycle
Outputs pass three-step analyst review, anomaly tests against quarterly filings, and peer sense checks. Models refresh each year, with interim updates triggered by material events so clients always receive the latest view.
Why Our Customer Journey Analytics Baseline Commands Reliability
Published estimates often diverge because firms choose differing scopes, data cutoffs, and refresh rhythms. Mordor Intelligence anchors the base year on audited vendor revenue and verified adoption ratios, giving decision-makers a balanced midpoint.
Key gap drivers include whether services revenue is counted, if wider CX platforms are bundled, the currency conversion date, and assumptions on AI-driven price lifts.
Benchmark comparison
| Market Size | Anonymized source | Primary gap driver |
|---|---|---|
| USD 20.87 B (2025) | Mordor Intelligence | |
| USD 30.90 B (2025) | Global Consultancy A | Bundles adjacent CX platforms and books multi-year contract value upfront |
| USD 4.96 B (2025) | Trade Journal B | Focuses only on software license fees, excludes managed services |
| USD 12.42 B (2024) | Regional Consultancy C | Relies on limited vendor sample and older currency assumptions |
The comparison shows that, once scope creep is trimmed and all revenue streams are captured, Mordor's disciplined approach delivers a dependable, transparent baseline ready for repeatable updates.


Key Questions Answered in the Report
What is the current size of the customer journey analytics market?
The market is valued at USD 24.65 billion in 2026 with an 18.10% CAGR through 2031.
Which component is growing fastest within the market?
Services, encompassing consulting and managed analytics, are expanding at 23.10% CAGR as firms seek AI implementation expertise.
Why is cloud deployment dominant for journey analytics platforms?
Elastic compute and specialised AI hardware in public clouds support high-volume, real-time inference, giving cloud 61.65% market share in 2025.
Which region will see the quickest growth?
Asia-Pacific is forecast to grow at 25.00% CAGR, propelled by mobile-first consumers and government-backed digital initiatives.
How are privacy regulations affecting market growth?
GDPR and similar laws raise compliance costs and limit data granularity, reducing forecast CAGR by an estimated 2.1%.
What strategic moves are leaders making to strengthen positions?
Vendors are acquiring AI specialists, such as Braze buying OfferFit, to embed automated experimentation and deepen ecosystem moats.
Page last updated on:


