Computer Aided Dispatch CAD Market Size and Share
Market Overview
| Study Period | 2020 - 2031 |
|---|---|
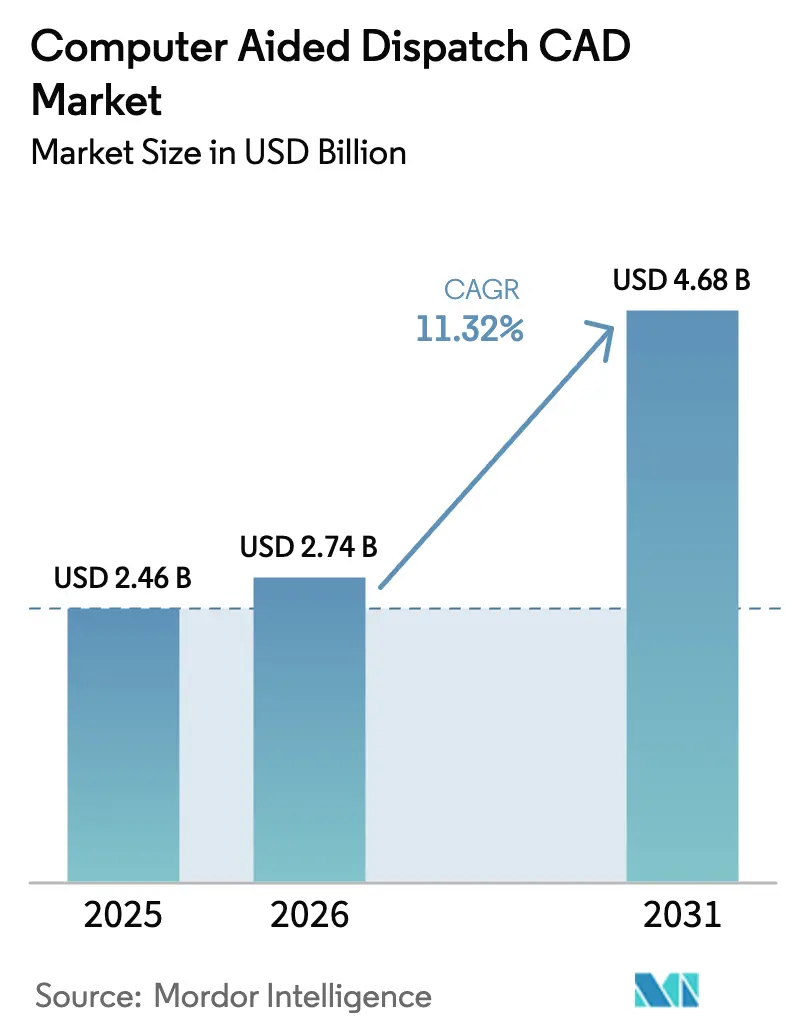
| Market Size (2026) | USD 2.74 Billion |
| Market Size (2031) | USD 4.68 Billion |
| Growth Rate (2026 - 2031) | 11.32% CAGR |
| Fastest Growing Market | Asia Pacific |
| Largest Market | North America |
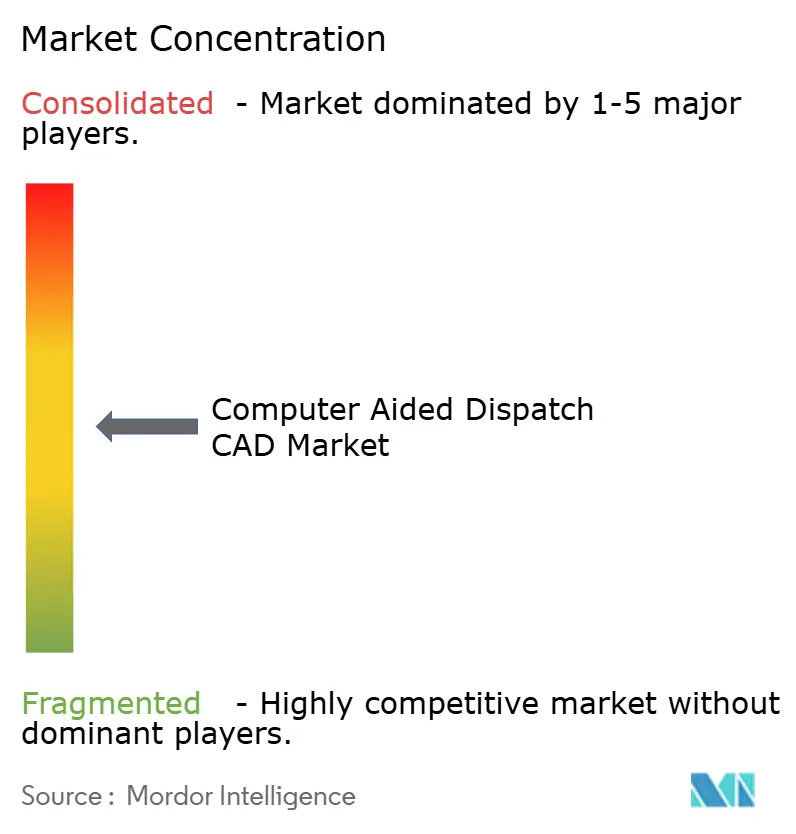
| Market Concentration | Medium |
Major Players
*Disclaimer: Major Players sorted in no particular order Image © Mordor Intelligence. Reuse requires attribution under CC BY 4.0. |
|
Computer Aided Dispatch CAD Market Analysis by Mordor Intelligence
The computer aided dispatch market size was valued at USD 2.46 billion in 2025 and estimated to grow from USD 2.74 billion in 2026 to reach USD 4.68 billion by 2031, at a CAGR of 11.32% during the forecast period (2026-2031). Adoption is accelerating as public safety agencies complete the move to NG-911, apply artificial-intelligence for predictive dispatching, and shift workloads to cloud-native platforms. Federal rules mandating IP-based emergency calling spur large replacement cycles, while the FirstNet broadband network improves mobile access for field responders[1]Federal Communications Commission, “Next Generation 911 Rules,” fcc.gov. Healthcare systems emerge as a fast-growing user group as hospitals connect ambulance fleets to CAD platforms. At the same time, small rural centers benefit from subscription pricing that removes up-front server costs. Competition remains moderate; established vendors buy cloud specialists to extend artificial-intelligence features, while new entrants promote open, interoperable architectures.
Key Report Takeaways
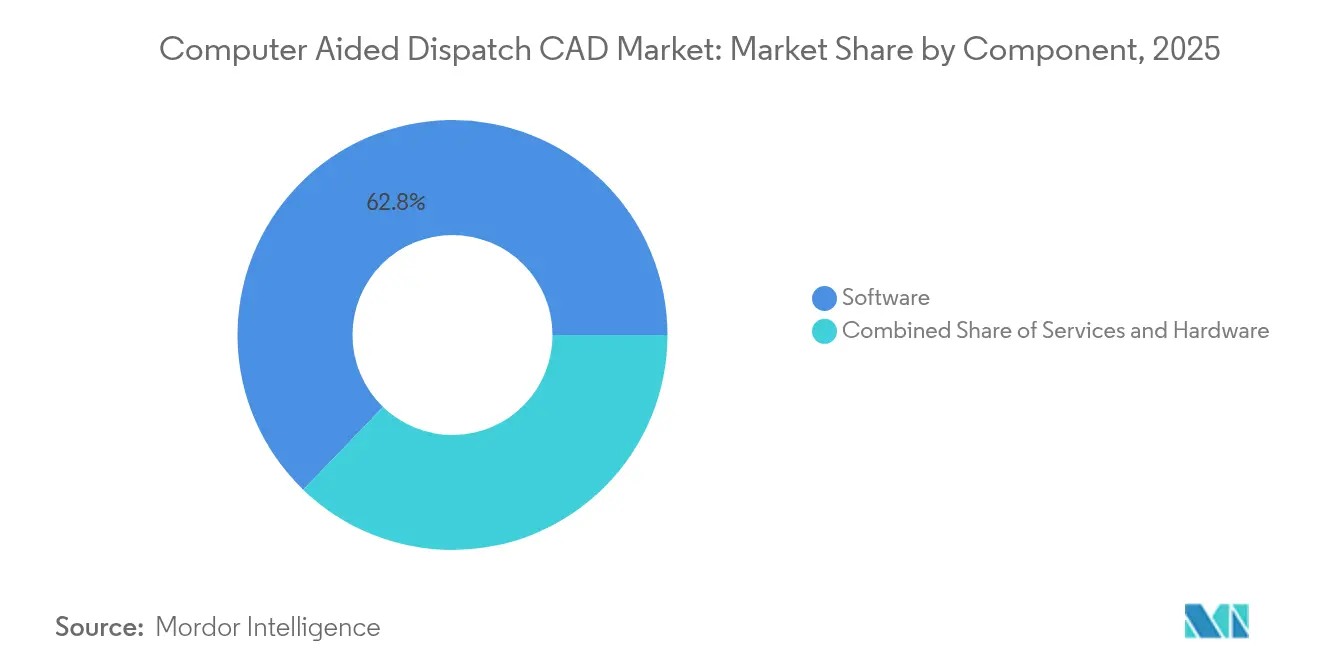
- By component, software held 62.78% of the computer aided dispatch market share in 2025; services is on track for a 14.18% CAGR to 2031.
- By deployment model, on-premise maintained 56.95% revenue share in 2025; cloud is the fastest-growing option at 16.05% CAGR through 2031.
- By end-user vertical, public safety agencies led with 46.15% revenue share in 2025; healthcare is forecast to expand at 15.92% CAGR to 2031.
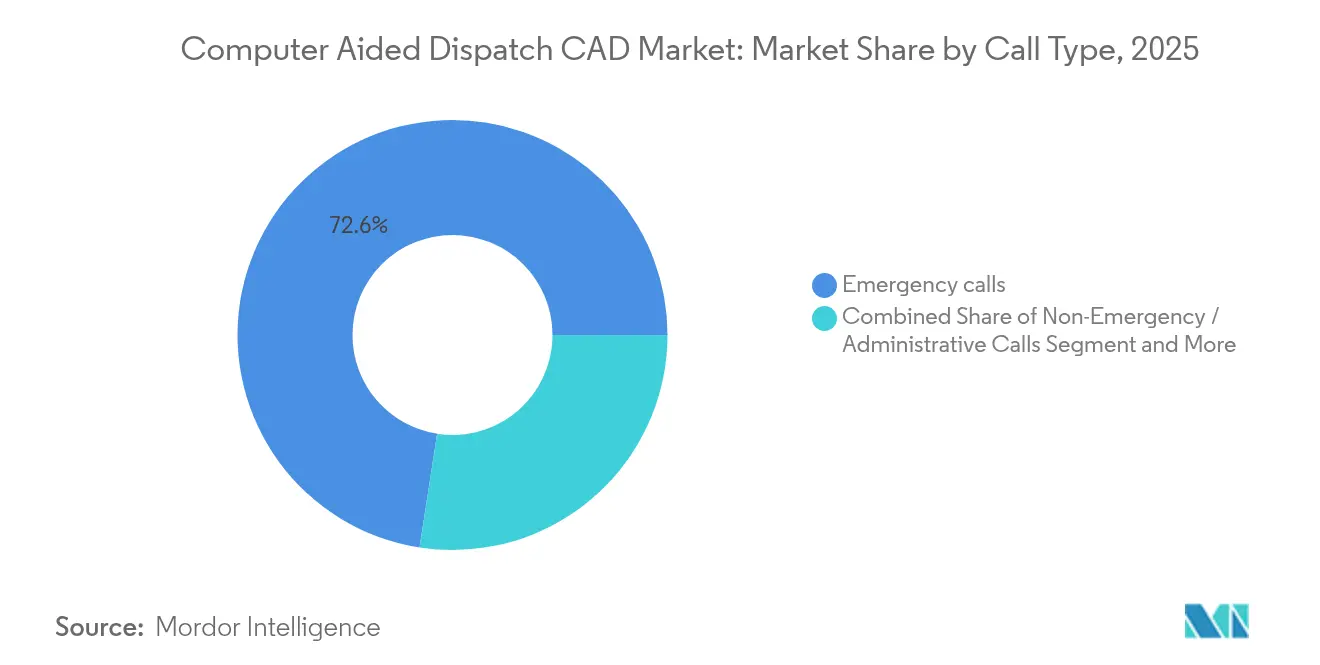
- By call type, emergency calls accounted for 72.55% of dispatch volume in 2025; scheduled dispatch is projected to rise at 16.92% CAGR.
- By organization size, large centers (≥ 75 seats) captured 51.72% of the computer aided dispatch market size in 2025; small centers (< 25 seats) show the quickest growth at 15.22% CAGR.
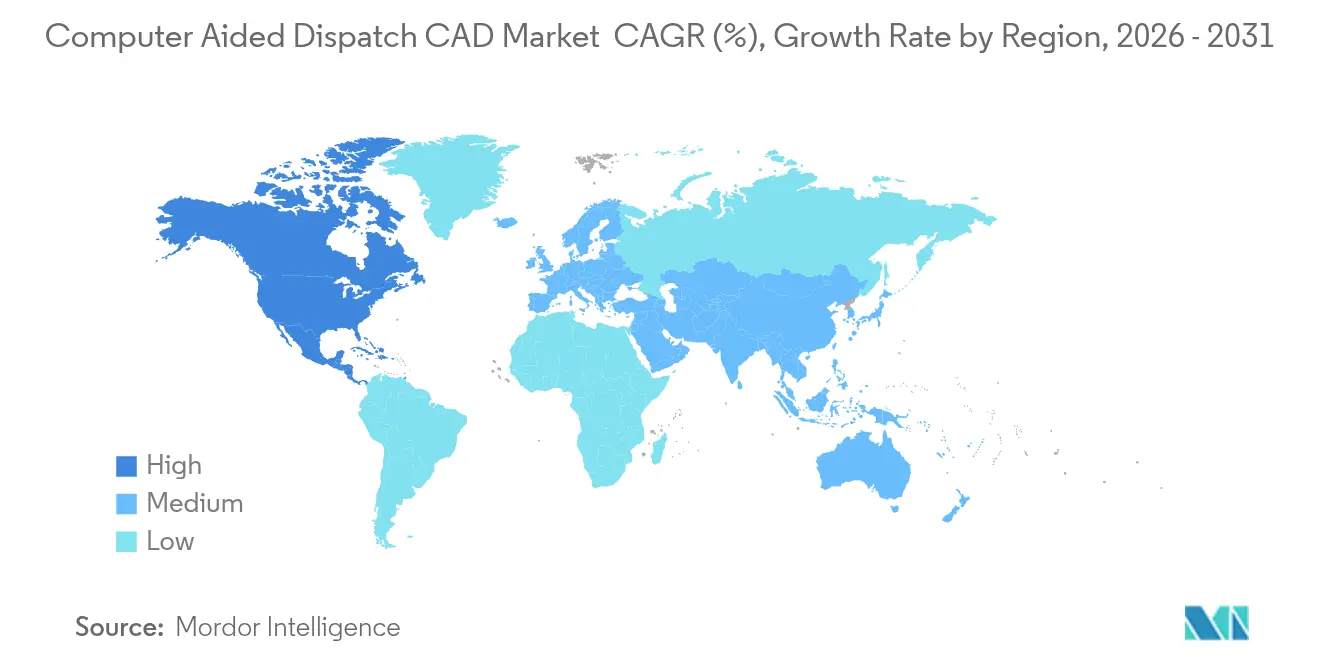
- By geography, North America commanded 43.65% revenue in 2025; Asia-Pacific is the fastest-growing area at 12.98% CAGR.
Note: Market size and forecast figures in this report are generated using Mordor Intelligence’s proprietary estimation framework, updated with the latest available data and insights as of 2026.
Global Computer Aided Dispatch CAD Market Trends and Insights
Drivers Impact Analysis*
| Driver | (~) % Impact on CAGR Forecast | Geographic Relevance | Impact Timeline |
|---|---|---|---|
| AI-enabled predictive dispatching | +2.8% | Global, early uptake in North America and Western Europe | Medium term (2-4 years) |
| Proliferation of NG-911 and LTE public-safety networks | +3.2% | North America first, expanding to Europe and Asia-Pacific | Long term (≥ 4 years) |
| Cloud-native CAD adoption by mid-sized PSAPs | +2.1% | Global, strongest in rural and suburban areas | Short term (≤ 2 years) |
| Expanding smart-city command-and-control programs | +1.9% | Urban centers worldwide, led by Asia-Pacific | Medium term (2-4 years) |
| Rising cyber-resiliency mandates for critical communications | +1.4% | Global, strictest in North America and Europe | Short term (≤ 2 years) |
| Integration with real-time video and drone feeds | +1.1% | North America and Europe, moving to Asia-Pacific | Medium term (2-4 years) |
| Source: Mordor Intelligence | |||
AI-enabled predictive dispatching
Artificial-intelligence tools upgrade CAD platforms from reactive logging to proactive resource management. Motorola Solutions’ Assist analyzes incident history, weather, and traffic to recommend staffing patterns, cutting response times by up to 15% at pilot sites[3]Motorola Solutions, “2025 Investor Presentation,” motorolasolutions.com. CentralSquare’s CitizenLink AI fields non-emergency calls, freeing telecommunicators for higher-priority events. Agencies adopting predictive analytics report double-digit efficiency gains, especially where integrated crime hotspot forecasts guide patrol coverage.
Proliferation of NG-911 and LTE public-safety networks
All U.S. carriers must deliver 911 traffic in IP form as of late-2024, compelling PSAPs to refresh CAD software capable of handling text, images, and video. The Kansas statewide NG-911 rollout shows how an ESInet plus RapidDeploy cloud mapping speeds cross-county data sharing. FirstNet broadband gives field crews secure LTE links, enabling remote dispatch during severe weather or pandemic events[2]FirstNet Authority, “FirstNet Annual Update 2025,” firstnet.gov.
Cloud-native CAD adoption by mid-sized PSAPs
Subscription-based platforms remove server purchases and provide automatic upgrades. Pima County’s 95% cloud uptime and instant scaling during wildfires illustrate financial and operational benefits. With 96% of new Tyler Technologies contracts now SaaS, agencies of 10-20 seats gain features once reserved for metro centers.
Expanding smart-city command-and-control programs
Cities integrate CAD with traffic control, CCTV, and IoT sensors to build a common operating picture. Rio de Janeiro’s Operations Center links more than 20 agencies, trimming average response by 30%. Honeywell’s City Suite embeds GIS dispatch into wider urban dashboards, while Huawei’s Shenzhen project applies AI to predict hazards and auto-generate alerts.
Restraints Impact Analysis*
| Restraint | (~) % Impact on CAGR Forecast | Geographic Relevance | Impact Timeline |
|---|---|---|---|
| Fragmented procurement and funding cycles | -1.8% | Global, acute in small jurisdictions | Long term (≥ 4 years) |
| Interoperability gaps among legacy systems | -2.3% | North America & Europe with mature installations | Medium term (2-4 years) |
| Persistent data-privacy and governance concerns | -1.1% | Global, strongest rules in Europe and California | Short term (≤ 2 years) |
| Shortage of CAD-literate telecommunicators | -1.6% | Global, notable in rural markets | Long term (≥ 4 years) |
| Source: Mordor Intelligence | |||
Fragmented procurement and funding cycles
Small municipalities often need 18-36 months to align budgets, win grants, and select vendors. Park Ridge, Illinois opted to shift calls to the county network after projected costs rose 36%, highlighting how limited funding pushes agencies toward consolidation. Complex grant rules prolong decision time, slowing broader adoption.
Interoperability gaps among legacy systems
Proprietary platforms block data exchange across county lines. The U.S. Department of Homeland Security is drafting compliance tests because agencies struggle to link CAD databases for multi-agency incidents. CentralSquare’s Unify CAD-to-CAD tool has 31 live deployments, yet many jurisdictions still rely on manual phone patches that waste critical minutes.
*Our forecasts treat driver/restraint impacts as directional, not additive. The impact forecasts reflect baseline growth, mix effects, and variable interactions.
Segment Analysis
By Component: Software Leads as Agencies Seek Intelligence
Software generated 62.78% revenue in 2025, reflecting demand for analytics, multimedia intake, and AI-driven incident management. Services, though smaller, is expanding at 14.18% CAGR as agencies outsource cloud migration and cyber-hardening. The computer aided dispatch market size for services is forecast to reach USD 1.41 billion by 2031, equal to 30.12% of total revenue. Agencies rely on vendors for configuration, integration with records systems, and user training. Hardware remains essential for rugged tablets and radio consoles but faces slower growth as mobile applications substitute fixed workstations. Vendors bundle software, hosting, and support into SaaS subscriptions that flatten costs and shorten procurement cycles.
Demand for advanced functions pushes suppliers to invest heavily in R&D. Motorola Solutions spent USD 858 million in 2023, adding natural-language call summarization and license-plate analytics. Tyler Technologies embeds large-language-model-based search across case files, while Hexagon focuses on cloud micro-services that enable selective feature activation. As software matures, managed services deliver ongoing optimization, cybersecurity monitoring, and compliance reporting, ensuring continuous alignment with evolving 911 standards and privacy laws.


By Deployment Model: Cloud Gains Momentum
On-premise installations still account for 56.95% revenue because many large agencies prefer full data control and have sunk costs in local data centers. Yet the cloud segment posts 16.05% CAGR as solutions prove resilient and secure. Bedfordshire Fire & Rescue adopted CommandCentral CRS in Microsoft Azure, reducing upgrade outages to near zero while achieving elastic scaling during storm surges. Small and mid-sized PSAPs choose cloud first, citing quick rollout and automatic disaster recovery. Hybrid setups rise where agencies keep sensitive evidence locally but tap the cloud for mapping, analytics, and remote work.
Agencies that switched during the pandemic saw dispatchers work securely from home, sustaining service continuity. The computer aided dispatch market benefits from falling subscription prices as multitenant architectures spread operating costs. Regulators now issue guidance that cloud providers meet or exceed physical-site hardening standards, easing earlier security objections.
By End-User Vertical: Healthcare Shows the Fastest Climb
Public safety agencies form the core buying group at 46.15% revenue in 2025. Police, fire, and EMS rely on CAD to coordinate fleet units and share incident data in real time. Hospitals, however, represent the strongest growth at 15.92% CAGR. With ambulance diversions rising, emergency departments deploy CAD to triage incoming cases and direct paramedic crews to specialty centers. Japan’s D-Call Net automatically alerts trauma surgeons within 20 seconds of a major crash, cutting door-to-treatment intervals by 17%. Utilities and transport firms also integrate CAD into asset monitoring to speed outage repair and accident response.
As healthcare adoption soars, vendors bundle HIPAA-compliant messaging, automatic ECG file transfer, and integration with electronic patient care records. The computer aided dispatch industry also serves campus security, airports, and event venues that need command-and-control for large crowds. Each niche requires tailored workflows, helping vendors diversify beyond traditional PSAP budgets.
By Call Type: Predictive Scheduling Expands Scope
Emergency calls drove 72.55% of total volume in 2025, yet scheduled or planned dispatch grows briskly at 16.92% CAGR. Agencies mine historical call clusters to pre-position patrols, fire units, or ambulances, turning CAD into a prevention tool. Drone-as-first-responder programs in Amarillo launch within 90 seconds for 98% of incidents, aided by automated CAD triggers that identify likely hotspots.
Non-emergency traffic, such as noise complaints or welfare checks, is increasingly triaged by AI chatbots. This automation reserves human call-takers for life-threatening events, raising overall service levels. The computer aided dispatch market size for scheduled dispatch is expected to climb steadily, supported by smart-city sensors that auto-generate incidents when cameras detect collisions or floods.
By Organization Size: Small Centers Adopt Shared Platforms
Large centers with 75 or more seats captured 51.72% revenue due to high call volumes and integration depth. Yet centers under 25 seats post the highest growth at 15.22% CAGR, driven by low-cost SaaS bundles. Regional consolidation is common: Pierce County, Washington merged five call centers into one to eliminate 40,000 duplicated annual calls. Shared cloud platforms give rural agencies redundant routing, GIS, and analytics once available only to metro hubs.
Mid-sized centers leverage hybrid architecture, hosting sensitive databases locally but subscribing to cloud analytics. Vendors now offer tiered seat licensing, letting agencies adjust capacity during seasonal events or disasters. As cyber mandates tighten, even small centers find value in vendor-managed patches and 24×7 security monitoring, further tilting adoption toward hosted solutions.
Geography Analysis
North America generated 43.65% of 2025 revenue for the computer aided dispatch market, powered by NG-911 deadlines, FirstNet coverage, and steady municipal funding. El Paso County’s multi-agency rollout of Hexagon CAD handles over 1.1 million calls each year, underscoring scale and complexity. Government grants accelerate rural upgrades, while privacy-by-design rules drive interest in cloud environments certified for Criminal Justice Information Services compliance.
Asia-Pacific is the fastest-growing region at 12.98% CAGR. Urbanization, smartphone penetration, and national digital initiatives fuel investments across China, India, and Southeast Asia. Tokyo’s #7119 nurse triage line routes non-critical cases away from ambulances, showing how tele-support can relieve overburdened services. In India, statewide emergency numbers consolidate police, fire, and medical into single PSAPs that require fully integrated CAD with multi-language prompts.
Europe posts stable growth as agencies focus on interoperability and cybersecurity. The United Kingdom deploys Motorola Solutions Control Room Solution across multiple fire services, giving 77 stations a shared view of incidents and assets. Swiss Border Guard use of Hexagon CAD integrating 1,000 AVL devices illustrates continental emphasis on border security coordination. GDPR places strict data-handling rules, steering agencies to providers offering sovereign-cloud options.

Competitive Landscape
The market shows moderate concentration. Motorola Solutions, Hexagon, and Tyler Technologies together hold close to half of global revenue. Motorola Solutions continues to absorb cloud innovators, most recently RapidDeploy in February 2025, adding real-time mapping for 1,600 ECCs across 24 states. The firm invested USD 858 million in 2023 R&D, launching Assist AI and SmartIncident to automate license-plate checks and push situational data to radios. Tyler Technologies shifted 96% of new deals to SaaS and achieved 86.3% recurring revenue in Q1 2025, proving its cloud pivot.
CentralSquare’s Unify CAD-to-CAD is now live at 31 sites, tackling interoperability gaps. New entrants such as Flock Safety and Mark43 emphasize open APIs, drone integration, and user-friendly interfaces. Vendors differentiate through artificial-intelligence, cybersecurity frameworks, and ability to connect with drones, body cameras, and GIS. Strategic alliances, like Motorola with Nokia for drone-in-a-box, indicate convergence of radio, video, and analytics into unified incident platforms.
Price competition remains limited because mission-critical buyers prioritize reliability and proven compliance. Instead, suppliers compete on total cost of ownership, user experience, and speed of deployment. The computer aided dispatch market will likely witness further acquisitions as incumbents buy niche analytics or cloud security firms to broaden portfolios and lock in long-term service contracts.
Computer Aided Dispatch CAD Industry Leaders
-
CentralSquare Technologies
-
Hexagon AB
-
Tyler Technologies
-
RapidDeploy
-
Motorola Solutions Inc.
- *Disclaimer: Major Players sorted in no particular order

Recent Industry Developments
- May 2025: Motorola Solutions posted record Q1 2025 sales of USD 2.5 billion, up 6% year-over-year, with software and services revenue rising 9%.
- April 2025: Motorola Solutions introduced the SVX video remote speaker microphone and Assist AI tool for instant license-plate queries.
- April 2025: Tyler Technologies reported USD 565.2 million Q1 2025 revenue, fueled by 21% SaaS growth and 86.3% recurring share.
- February 2025: Motorola Solutions closed the acquisition of RapidDeploy, adding Radius Mapping, mobile responder apps, and Eclipse Analytics across 1,600 ECCs in 24 states.


Research Methodology Framework and Report Scope
Market Definitions and Key Coverage
Our study defines the global computer-aided dispatch market as all revenue generated from commercially licensed software platforms that capture calls for service, automate incident logging, allocate resources, and record post-event data for public safety, healthcare, utilities, transportation, and related control rooms. Revenue from one-time license fees, annual subscriptions, implementation, and managed support services is counted.
Scope exclusion: We deliberately exclude hardware dispatch consoles, two-way radios, and turnkey public-safety answering-point construction projects.
Segmentation Overview
-
By Component
- Software
- Services
- Hardware
-
By Deployment Model
- On-premise
- Cloud
- Hybrid
-
By End-User Vertical
- Public Safety Agencies
- Government and Defense
- Transportation and Logistics
- Utilities and Energy
- Healthcare
- Other Verticals
-
By Call Type
- Emergency Calls
- Non-Emergency / Administrative Calls
- Scheduled / Planned Dispatch
-
By Organization Size
- Large Dispatch Centers (More than 75 seats)
- Mid-Sized Dispatch Centers (25-74 seats)
- Small Dispatch Centers (Less than 25 seats)
-
By Geography
-
North America
- United States
- Canada
- Mexico
-
South America
- Brazil
- Argentina
- Rest of South America
-
Europe
- United Kingdom
- Germany
- France
- Italy
- Spain
- Nordics
- Rest of Europe
-
Middle East and Africa
- GCC
- Israel
- South Africa
- Rest of Middle East and Africa
-
Asia-Pacific
- China
- India
- Japan
- South Korea
- ASEAN
- Australia
- New Zealand
- Rest of Asia-Pacific
-
North America
Detailed Research Methodology and Data Validation
Primary Research
Mordor analysts interviewed PSAP chiefs, emergency medical dispatch coordinators, state procurement officers, and CAD product managers across North America, Europe, Asia-Pacific, and the Middle East. These conversations clarified license-fee dispersion, cloud migration rates, and upgrade cycles, allowing us to plug data gaps and adjust preliminary ratios.
Desk Research
We harvested quantitative clues from tier-1, non-paywalled repositories such as National Emergency Number Association statistics, United States FCC NG-911 filings, Eurostat 112 datasets, Australian Communications and Media Authority reports, and APCO International papers. Company 10-Ks, public contract databases, and respected trade press enriched the fact base. Paid intelligence drawn through D&B Hoovers and Dow Jones Factiva supplied vendor splits and deal news that anchored our baseline. The sources listed are illustrative; many additional references informed data collection, validation, and clarification.
Market-Sizing & Forecasting
We applied a top-down build that begins with registered dispatch seats by region, multiplies them by verified software average selling prices, and aligns totals with call-volume demand pools. Select bottom-up checks using disclosed vendor revenue, partner quotes, and sampled contract values validated each territory before aggregation. Key inputs include NG-911 roll-out milestones, urban population growth, cloud deployment share, and refresh-cycle length. A multivariate regression, fed by these lagged variables, produced five-year forecasts, while scenario tests captured low- and high-adoption paths.
Data Validation & Update Cycle
Analysts run variance tests against historical spend, public budgets, and macro indicators, and senior reviewers sign off only after anomalies are resolved. Models refresh annually, with mid-cycle updates triggered by regulatory or funding shocks. A final pass before publication ensures customers receive the newest view.
Why Mordor's Computer Aided Dispatch Market Baseline Earns Decision-Makers' Trust
Published estimates often diverge because firms adopt different scopes, price ladders, or forecast horizons, and this variation can confuse buyers. Our disciplined scope, yearly refresh, and dual-angle modeling reduce such drift and give stakeholders a dependable anchor.
Key gap drivers include the practice of counting hardware revenue, using list prices rather than realized ASPs, or extending aggressive migration curves that primary contacts have not validated.
Benchmark comparison
| Market Size | Anonymized source | Primary gap driver |
|---|---|---|
| USD 2.46 B | Mordor Intelligence | |
| USD 2.33 B | Global Consultancy A | Relies solely on emergency call volume, omits service revenue |
| USD 2.53 B | Regional Consultancy B | Uses list ASPs without discount normalization |
| USD 4.87 B | Industry Journal C | Adds radio hardware and turnkey center builds to software base |
These contrasts show that Mordor's balanced, transparent model, grounded in traceable variables and refreshed assumptions, offers the most dependable baseline for strategic planning.


Key Questions Answered in the Report
What is the current size of the computer aided dispatch market?
The computer aided dispatch market reached USD 2.74 billion in 2026 and is projected to hit USD 4.68 billion by 2031 at an 11.32% CAGR.
Which deployment model is growing fastest?
Cloud deployment is expanding at 16.05% CAGR as agencies adopt SaaS platforms for lower costs and easier scalability.
Why is healthcare a high-growth vertical?
Hospitals use CAD to coordinate ambulances and specialty teams, driving a 15.92% CAGR by improving patient routing and treatment times.
How are agencies improving dispatch efficiency with AI?
Predictive analytics pre-position resources and AI chatbots handle non-urgent calls, cutting wait times and boosting response performance by up to 15%.
Which region shows the strongest future growth?
Asia-Pacific leads with a projected 12.98% CAGR thanks to smart-city projects, rapid urbanization, and national emergency-service modernization.
Page last updated on:


