Public Transportation Market Size and Share
Market Overview
| Study Period | 2020 - 2031 |
|---|---|
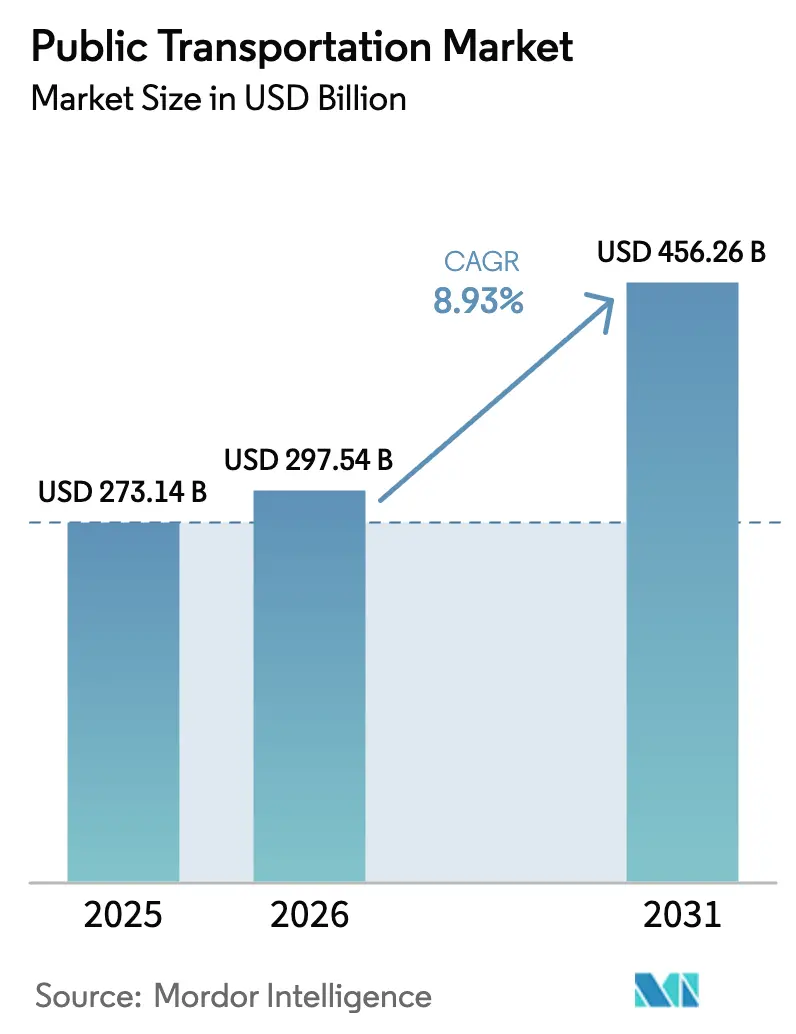
| Market Size (2026) | USD 297.54 Billion |
| Market Size (2031) | USD 456.26 Billion |
| Growth Rate (2026 - 2031) | 8.93% CAGR |
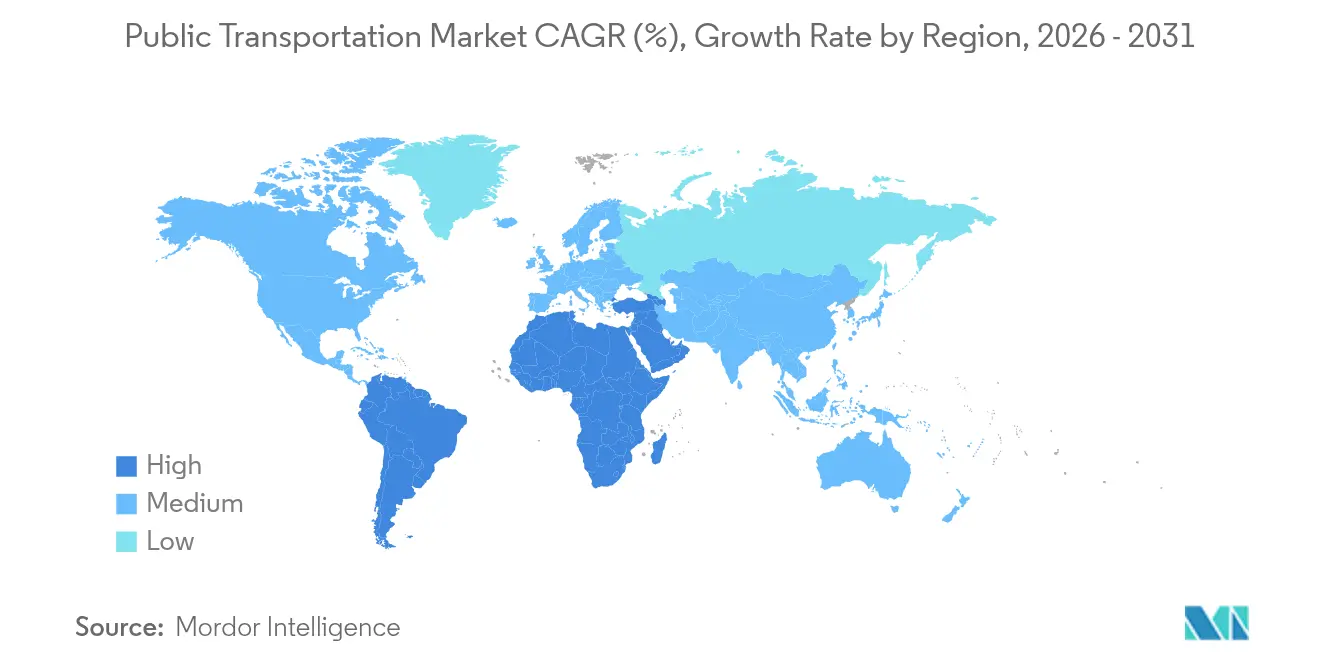
| Fastest Growing Market | Middle East |
| Largest Market | Asia Pacific |
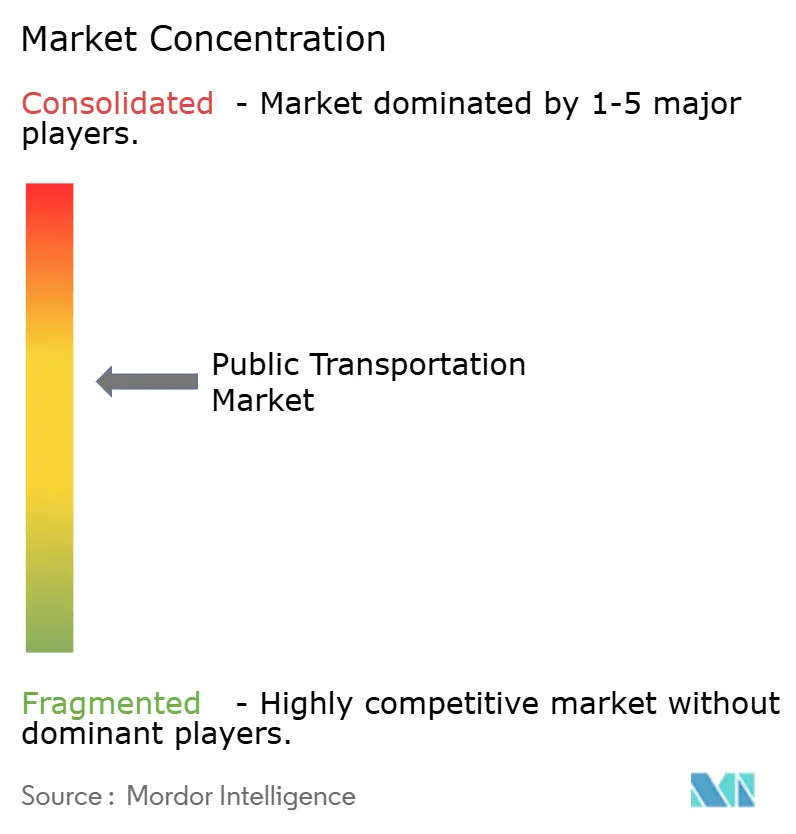
| Market Concentration | Medium |
Major Players *Disclaimer: Major Players sorted in no particular order Image © Mordor Intelligence. Reuse requires attribution under CC BY 4.0. | |
Public Transportation Market Analysis by Mordor Intelligence
The public transportation market size was valued at USD 273.14 billion in 2025 and estimated to grow from USD 297.54 billion in 2026 to reach USD 456.26 billion by 2031, at a CAGR of 8.93% during the forecast period (2026-2031). The expansion is rooted in accelerating urbanization, firm zero-emission bus (ZEB) mandates, and rapid digitalization of fare systems. Sovereign and sub-national climate policies are translating into multi-year procurement pipelines for battery-electric fleets, while Asia-Pacific’s metro build-out and the Gulf Cooperation Council’s megaprojects add scale to network investments. Technology integrators that bundle software, rolling stock, and energy infrastructure gain clear advantages as agencies seek turnkey electrification solutions. Funding gaps and fragmented governance, however, temper near-term capacity additions, making capital efficiency and service reliability the competitive differentiators in the public transportation market.
Key Report Takeaways
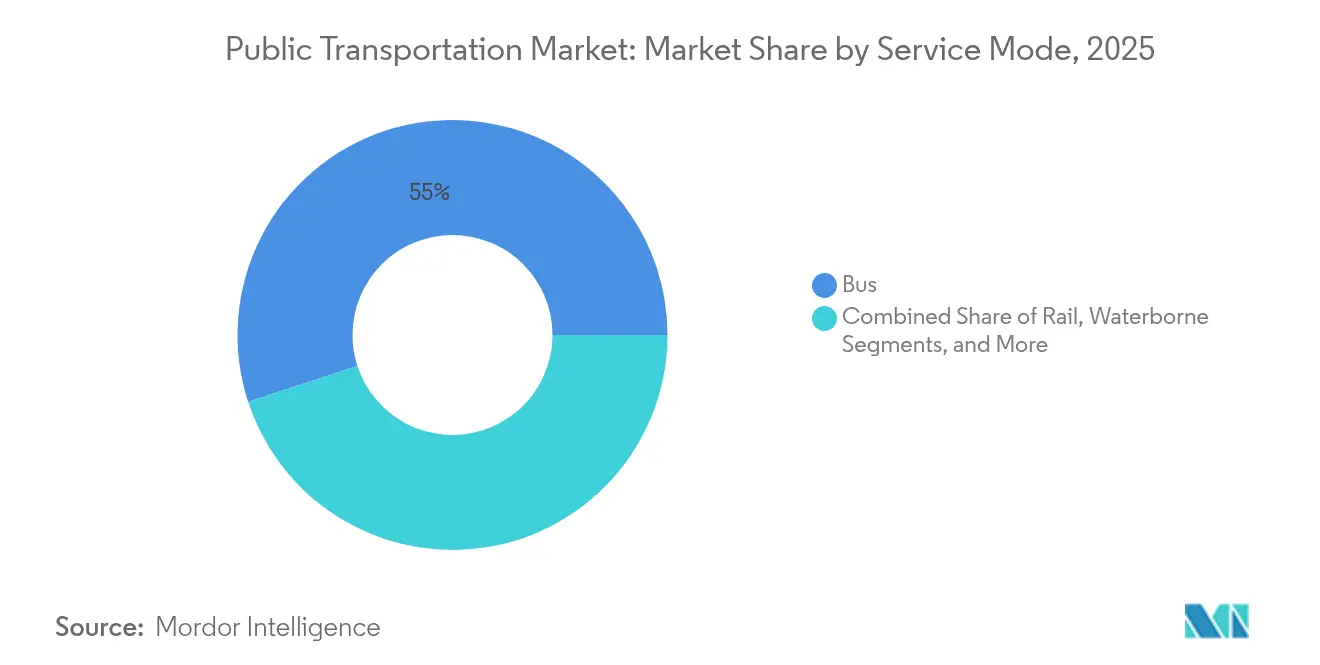
- By service mode, bus operations accounted for 55.02% of the public transportation market share in 2025, while aerial cable car is set to grow at an 12.26% CAGR through 2031.
- By ticketing method, paper tickets and smartcards retained 61.18% share in 2025; account-based and open-loop payments are advancing at 13.68% CAGR to 2031.
- By powertrain type, diesel systems held 85.05% share of the public transportation market size in 2025, yet battery-electric buses are scaling at a 26.74% CAGR.
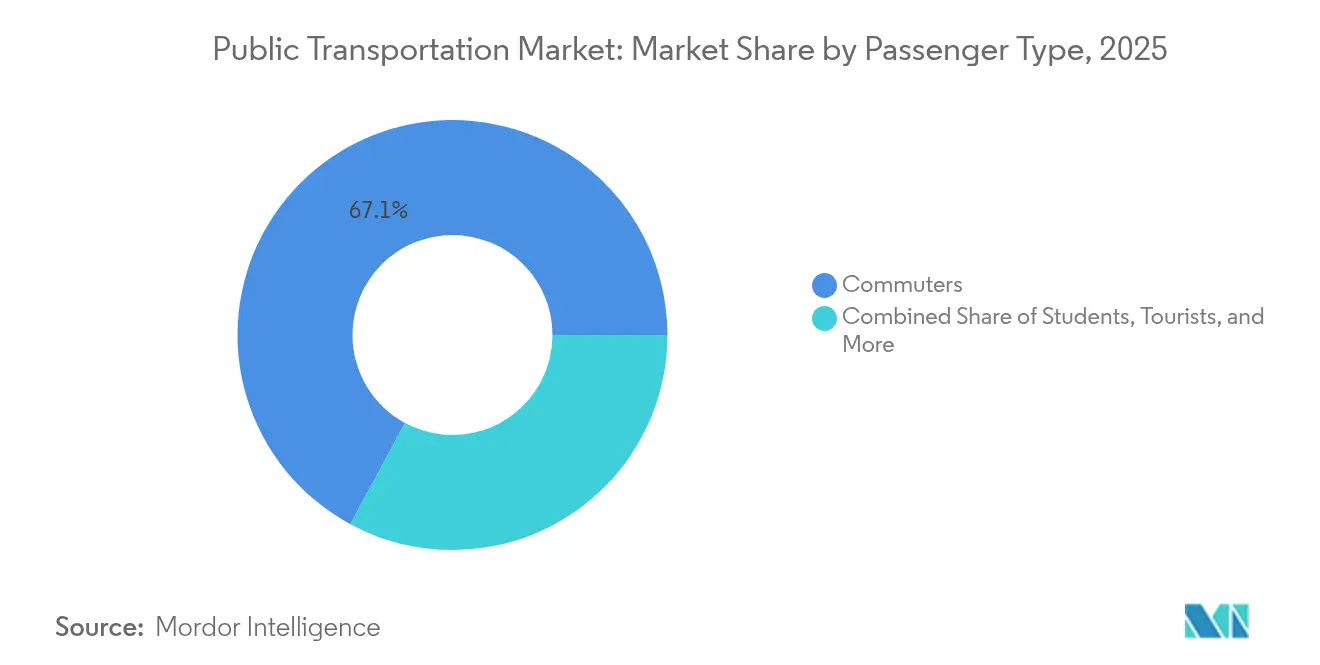
- By passenger type, commuters represented 67.12% of total ridership in 2025, while the tourist segment is expanding at 9.48% CAGR.
- By distribution channel, offline channel accounted for 77.45% of the public transportation market share in 2025, while online channel is set to grow at an 12.39% CAGR through 2031.
- By geography, Asia-Pacific led with 40.10% public transportation market share in 2025, whereas the Middle East is the fastest-growing region at 9.66% CAGR.
Note: Market size and forecast figures in this report are generated using Mordor Intelligence’s proprietary estimation framework, updated with the latest available data and insights as of 2026.
Global Public Transportation Market Trends and Insights
Drivers Impact Analysis*
| Driver | (~) % Impact on CAGR Forecast | Geographic Relevance | Impact Timeline |
|---|---|---|---|
| Urbanization and Population Density Concentration | +2.1% | Global, with highest impact in Asia-Pacific and Africa | Long term (≥ 4 years) |
| Government Climate Targets and ZEB Mandates | +1.8% | North America and EU, expanding to Asia-Pacific | Medium term (2-4 years) |
| Digital Fare Payment and ABT Adoption Cuts OPEX | +1.2% | Global, led by developed markets | Short term (≤ 2 years) |
| Post-COVID Ridership Recovery Stimulus Packages | +0.9% | North America and EU primarily | Short term (≤ 2 years) |
| Corporate Mobility-as-a-Benefit Programs | +0.7% | Global, concentrated in urban centers | Medium term (2-4 years) |
| AI-Optimized On-Demand Micro-Transit Expansion | +0.8% | North America and EU, pilot programs in Asia-Pacific | Long term (≥ 4 years) |
| Source: Mordor Intelligence | |||
Urbanization and Rising Density
Cities housing more than 7,000 residents per square kilometer capture farebox recovery ratios exceeding 40%, enabling sustainable operations without deep subsidies. São Paulo’s multi-year infrastructure plan illustrates how megacities channel density into large-scale transit corridors that reshape commuting patterns [1]São Paulo Municipal Government, “BRT Performance Metrics,” prefeitura.sp.gov.br. Strong metropolitan constituencies now lobby for transit funding ahead of highway expansion, even as rural areas see service rollbacks. Over the long term, demographic concentration remains the structural tailwind for the public transportation market.
Government Climate Goals and ZEB Mandates
California’s Advanced Clean Transit rule compels 100% zero-emission bus procurements by 2029, a model already mirrored by 15 additional US states covering 40% of national fleet demand. In parallel, the European Union’s Clean Vehicles Directive sets stepped clean-bus quotas rising to 32.5% by 2030. Such mandates override traditional cost-benefit analyses and force agencies to lock in long-term supply contracts, compressing manufacturer lead times and re-ordering the competitive field in the public transportation market.
Digital Fare Payment and ABT Roll-out
Transport for London cut fare-collection costs 30% and lifted ridership 8% after migrating to contactless account-based ticketing. Agencies deploying open-loop systems eliminate physical media expenses, shift financial risk to payment processors, and unlock real-time data for demand management. Early adopters use the freed capacity to tailor pricing by trip length or time of day, raising system utilization without expanding fleet size.
Post-COVID Stimulus for Ridership Recovery
Federal recovery packages injected USD 69.5 billion into US transit agencies, cushioning fare losses and underwriting service expansion. Extension funding through the Infrastructure Investment and Jobs Act secures near-term operating budgets, but expiry of emergency grants poses a fiscal cliff. Agencies that channeled stimulus into capital upgrades rather than operating costs are now better positioned to sustain the momentum of the public transportation market.
Restraints Impact Analysis*
| Restraint | (~) % Impact on CAGR Forecast | Geographic Relevance | Impact Timeline |
|---|---|---|---|
| High CAPEX for Fleet Electrification and Charging | -1.4% | Global, most severe in developing markets | Medium term (2-4 years) |
| Fragmented Governance and Slow Procurement Cycles | -0.8% | Global, particularly acute in federal systems | Long term (≥ 4 years) |
| Farebox Revenue Gap vs Operating-Cost Inflation | -1.1% | Global, most severe in fare-dependent systems | Short term (≤ 2 years) |
| Competition from Mobility Super-Apps | -0.6% | Urban markets globally, led by Asia-Pacific | Medium term (2-4 years) |
| Source: Mordor Intelligence | |||
High CAPEX for Fleet Electrification and Charging
Electric buses cost 2.5× diesel equivalents, while depot charging upgrades can exceed USD 1 million per site. The Metropolitan Transportation Authority’s program places all-in costs near USD 4.2 million per vehicle when infrastructure is included. Developing regions face additional grid reliability constraints, compelling them to install redundant power solutions that stretch capital budgets and slow the transition in the public transportation market.
Fragmented Governance and Slow Procurement
The San Francisco Bay Area’s 27 operators illustrate how dispersed authority lengthens project timelines by up to three years, erodes economies of scale, and locks agencies into incompatible fare systems. Federal buy-America provisions and lengthy environmental reviews add further complexity, delaying fleet replacement cycles and infrastructure roll-outs that are vital to meet ZEB deadlines.
*Our forecasts treat driver/restraint impacts as directional, not additive. The impact forecasts reflect baseline growth, mix effects, and variable interactions.
Segment Analysis
By Service Mode: Bus Dominance Faces Aerial Cable Car Disruption
Bus services commanded 55.02% market share in 2025, reflecting their cost-effectiveness and route flexibility compared to fixed-rail infrastructure. Dedicated bus-rapid-transit corridors that raise peak-hour speeds by 35% in São Paulo prove how focused lane prioritization can lift capacity without heavy rail outlays. Coach and inter-city buses cede long-haul share where high-speed rail lines now dominate corridors beyond 300 kilometers, especially in China’s eastern seaboard. However, aerial cable car mode is expanding at 12.26% CAGR through 2031, driven by increasing urbanization, the need for sustainable transportation solutions, and the rising popularity of tourism in various locations.
A growing mix of contract models emerges. Municipal agencies keep strategic control of routes, while private franchisees provide vehicles, drivers, and maintenance in availability-based agreements. This asset-light structure allows smaller cities to join the public transportation market without carrying heavy balance-sheet risk. Bus makers respond by bundling battery leasing, depot charging, and telematics into subscription packages that smooth capital hits.


By Ticketing Method: Digital Adoption Builds Network Intelligence
Traditional paper tickets and smartcards maintained 61.18% market share in 2025, but account-based and open-loop payment systems are growing at 13.68% CAGR as transit agencies embrace contactless technology. Open-loop systems deliver real-time settlement data that allows agencies to adjust headways dynamically during peak events, a functionality not possible with legacy media. For unbanked riders, agencies partner with retail chains to load digital credits, ensuring accessibility while closing cash-handling loopholes. Magnetic stripe cards phase out by 2027 under updated payment security standards, allowing agencies to retire maintenance-heavy turnstile readers and redeploy labor to customer service roles.
Hybrid ticketing periods create transitional expense spikes as operators run parallel systems to avoid excluding cash-dependent users. Once migration passes the 70% threshold, agencies typically shutter paper stock warehouses and recover the incremental costs within two fiscal years. Over time, the data exhaust from digital ticketing serves as the backbone for integrated mobility-as-a-service platforms that stitch together buses, rail, ride-shares, and micro-mobility fleets in a single journey planner.
By Powertrain Type: Battery-Electric Momentum Builds Scale Efficiencies
Diesel’s installed base guarantees its 85.05% share of the public transportation market size today, but the future procurement pipeline tilts heavily toward battery-electric units. Agencies lock in multi-year purchase agreements to secure limited manufacturing slots, compressing delivery times for buyers that commit to larger volumes. Battery-electric operating costs fall steadily as kilowatt-hour prices drop and regenerative braking slashes maintenance. Hybrid drive trains remain transitory, giving operators 25-30% fuel savings without charging infrastructure outlays, yet resale values for hybrid stock are depreciating faster amid looming ZEB compliance deadlines. Fuel-cell systems are field-tested in Nordic and Canadian winters where battery range suffers, while CNG fleets narrow to regions with low-cost gas and favorable tax regimes.
Supply chains struggle to keep pace with raw-material demand. Nickel and cobalt sourcing constraints impose 18-month waits for battery-electric buses versus six months for diesel. Agencies counter by staging procurement in tranches, matching depot upgrades to staggered delivery windows to avoid stranded assets. Financing innovation also appears as rolling stock lessors offer pay-as-you-ride contracts that align capital commitments with ridership revenue streams.
By Passenger Type: Core Commuter Base Anchors Volume, Tourists Outpace Growth
Commuters contributed 67.12% of 2025 ridership and remain the baseline volume driver for weekday scheduling. Corporate mobility-as-a-benefit programs expand transit subsidies within Fortune 500 sustainability roadmaps and help smooth peak crush loads by promoting flexible work hours. Tourist ridership advances at 9.48% CAGR as cities weave rail links to airports and entertainment districts into broader destination marketing campaigns.
Students make up a counter-cyclical cushion. Discounted semester passes lock young users into habitual transit use, laying an annuity base for future commuter growth. Elderly and disabled riders push agencies toward low-floor vehicles and tactile wayfinding, elevating per-capita operating costs but attracting federal reimbursement streams tied to accessibility mandates.
By Distribution Channel: Online Platforms Redefine Customer Engagement
Offline and on-premise channels maintained 77.45% market share in 2025, encompassing station ticket machines, retail partnerships, and customer service centers, but online channels are expanding at 12.39% CAGR as mobile applications and web platforms reduce distribution costs. Digital channels enable real-time alerts, trip comparison, and stored-value wallets, improving user satisfaction while slashing queuing bottlenecks.
Where smartphone penetration lags, agencies partner with convenience stores to sell digital credits, expanding reach without returning to paper tokens. Equity concerns remain: agencies keep minimal physical windows to serve cash users and the visually impaired. Over time, unified account-based profiles allow riders to earn loyalty perks and transfer seamlessly across bus, rail, and shared-mobility services.
Geography Analysis
Asia-Pacific held 40.10% of the public transportation market in 2025 and continues to dominate by virtue of its unmatched project pipeline. China alone delivered more than 300 kilometers of new metro lines across 14 cities in 2024, using infrastructure as a macro-economic stabilizer. India’s network surpassed the 1,000-kilometer mark, with Tier-2 cities such as Kanpur adopting turnkey metro packages that compress design-to-operation cycles. Still, municipal debt levels are climbing; local governments increasingly rely on land-value capture and special-purpose vehicles to keep projects off-balance-sheet, a risk that could slow expansions should ridership lag projections. Japan showcases age-friendly station retrofits under JR East’s barrier-free program, setting a design benchmark for rapidly aging societies.
The Middle East represents the fastest-growing geography, posting a 9.66% CAGR through 2031. Saudi Arabia’s USD 25 billion Riyadh Metro, with six driverless lines and 176 stations, illustrates the scale of transformation underway. GCC governments earmark USD 140 billion for a trans-Gulf rail spine linking Kuwait to Oman, seeking freight diversification and integrated tourism clusters. Turkey leverages EU pre-accession funds for Istanbul metro extensions, while Israel’s Tel Aviv light-rail pushes toward network completion despite geopolitical headwinds. Oil price volatility remains the chief risk. Budget reprioritization during price dips could defer rolling stock orders and stall depot electrification, injecting cyclical uncertainty into the public transportation market.
North America and Europe focus on modernizing legacy assets rather than greenfield builds. The United States channels USD 20.5 billion from the Infrastructure Investment and Jobs Act toward state-of-good-repair work such as New York’s Second Avenue Subway Phase II and Chicago’s Red Line Extension . European Union cohesion funds help Eastern European cities add tram networks, while Western Europe replaces diesel fleets with ZEB offerings and upgrades signaling to Communications-Based Train Control. The mature ridership base pushes agencies to emphasize punctuality, accessibility, and digital engagement, rather than raw capacity growth.

Competitive Landscape
The public transportation market shows moderate fragmentation with regional consolidation spikes. State-owned giants dominate Asia-Pacific, such as China Railway Group Limited and MTR Corporation, yet mixed public-private models take hold in Europe and North America. FirstGroup’s acquisition of RATP Dev Transit London broadens its United Kingdom footprint and grants immediate access to Transport for London tenders [3]FirstGroup Plc, “Acquisition of RATP Dev Transit London,” firstgroupplc.com. Operators leverage mergers to spread electrification costs across larger fleets and negotiate vehicle prices at volume discounts.
Technology incumbents and software natives now vie for system-integrator roles. Siemens Mobility secured a contract with Deutsche Bahn to digitize rail corridors, embedding AI-based predictive maintenance and autonomous operations. Via Transportation scales on-demand algorithms to more than 500 municipalities, monetizing software subscriptions rather than operating fleets. Such asset-light models allow quick entry into mid-size cities that cannot afford full in-house dispatch platforms.
Capital markets reward operators that ring-fence electrification risk through green bonds and battery leasing. Keolis’ USD 85 million acquisition of Pacific Western Transportation’s business lines diversifies revenue into paratransit and employee shuttles, demonstrating a hedge strategy against cyclical commuter volumes [4]Keolis Canada, “Purchase of Pacific Western Transportation Lines,” keolis.ca. As ZEB mandates bite, OEMs form turnkey partnerships, bundling buses, chargers, and depot upgrades into long-term service agreements that shift residual-value exposure off transit agencies. Competitive intensity therefore centers on integrated offerings rather than unit-price bidding.
Public Transportation Industry Leaders
Deutsche Bahn AG
Keolis SA
Régie Autonome des Transports Parisiens (RATP)
Transdev Group SA
MTR Corporation
- *Disclaimer: Major Players sorted in no particular order

Recent Industry Developments
- June 2025: Beep Inc. began operating the Jacksonville Transportation Authority’s fully autonomous NAVI shuttle service, the first nationwide to run on public streets.
- February 2025: The Metropolitan Transportation Authority signed a USD 1.1 billion order with New Flyer for 265 battery-electric buses, including depot chargers and a decade of maintenance support.
- December 2024: The Federal Transit Administration finalized uniform accessibility standards for pedestrian facilities in public rights-of-way.
- October 2024: The US Department of Transportation lifted federal employee transit benefits to USD 325 per month, covering 2.2 million workers.


Global Public Transportation Market Report Scope
Public transportation includes any form of transport, such as buses, trains, bicycles, subways, and motorcycles, which are available to the general public to help them move from one point to another. Public transportation's main characteristics include efficiency, openness, and accessibility.
The public transportation market is segmented by distribution channel (online, offline), by type (road, rail, other types), by geography (North America, Europe, Asia-Pacific, Latin America, Middle East and Africa). The market sizes and forecasts are provided in terms of value (USD) for all the above segments.
| Bus | Urban Bus |
| Bus Rapid Transit (BRT) | |
| Coach / Inter-city | |
| Rail | Metro / Subway |
| Light Rail / Tram | |
| Commuter Rail | |
| Waterborne | Ferry |
| Water Taxi | |
| Aerial Cable Car / Other |
| Paper Ticket |
| Magnetic Stripe Card |
| Contactless Smartcard |
| Mobile Ticket / QR |
| Account-Based and Open-Loop Payments |
| Diesel |
| Hybrid |
| Battery Electric |
| Fuel-Cell Electric |
| CNG / LNG |
| Commuters |
| Students |
| Elderly and Persons w/ Disabilities |
| Tourists |
| Others |
| Online |
| Offline / On-Premise |
| North America | United States | |
| Canada | ||
| Mexico | ||
| South America | Brazil | |
| Argentina | ||
| Rest of South America | ||
| Europe | Germany | |
| United Kingdom | ||
| France | ||
| Italy | ||
| Spain | ||
| Russia | ||
| Rest of Europe | ||
| Asia-Pacific | China | |
| Japan | ||
| India | ||
| South Korea | ||
| Australia and New Zealand | ||
| Rest of Asia-Pacific | ||
| Middle East and Africa | Middle East | Saudi Arabia |
| United Arab Emirates | ||
| Turkey | ||
| Rest of Middle East | ||
| Africa | South Africa | |
| Nigeria | ||
| Egypt | ||
| Rest of Africa | ||
| By Service Mode | Bus | Urban Bus | |
| Bus Rapid Transit (BRT) | |||
| Coach / Inter-city | |||
| Rail | Metro / Subway | ||
| Light Rail / Tram | |||
| Commuter Rail | |||
| Waterborne | Ferry | ||
| Water Taxi | |||
| Aerial Cable Car / Other | |||
| By Ticketing Method | Paper Ticket | ||
| Magnetic Stripe Card | |||
| Contactless Smartcard | |||
| Mobile Ticket / QR | |||
| Account-Based and Open-Loop Payments | |||
| By Powertrain Type | Diesel | ||
| Hybrid | |||
| Battery Electric | |||
| Fuel-Cell Electric | |||
| CNG / LNG | |||
| By Passenger Type | Commuters | ||
| Students | |||
| Elderly and Persons w/ Disabilities | |||
| Tourists | |||
| Others | |||
| By Distribution Channel | Online | ||
| Offline / On-Premise | |||
| By Geography | North America | United States | |
| Canada | |||
| Mexico | |||
| South America | Brazil | ||
| Argentina | |||
| Rest of South America | |||
| Europe | Germany | ||
| United Kingdom | |||
| France | |||
| Italy | |||
| Spain | |||
| Russia | |||
| Rest of Europe | |||
| Asia-Pacific | China | ||
| Japan | |||
| India | |||
| South Korea | |||
| Australia and New Zealand | |||
| Rest of Asia-Pacific | |||
| Middle East and Africa | Middle East | Saudi Arabia | |
| United Arab Emirates | |||
| Turkey | |||
| Rest of Middle East | |||
| Africa | South Africa | ||
| Nigeria | |||
| Egypt | |||
| Rest of Africa | |||


Key Questions Answered in the Report
What is the current size of the public transportation market?
The public transportation market stands at USD 297.54 billion in 2026 and is forecast to climb to USD 456.26 billion by 2031.
Which region holds the largest share of the public transportation market?
Asia-Pacific leads with 40.10% public transportation market share due to extensive metro and bus rapid transit expansion.
How fast is the battery-electric bus segment growing?
Battery-electric buses are expanding at a 26.74% CAGR, making them the fastest-growing powertrain within the public transportation market.
What are the key restraints facing fleet electrification?
High upfront vehicle costs, expensive depot charging upgrades, and grid capacity constraints reduce adoption speed.
Page last updated on:


