Tortilla Market Size and Share
Market Overview
| Study Period | 2021 - 2031 |
|---|---|
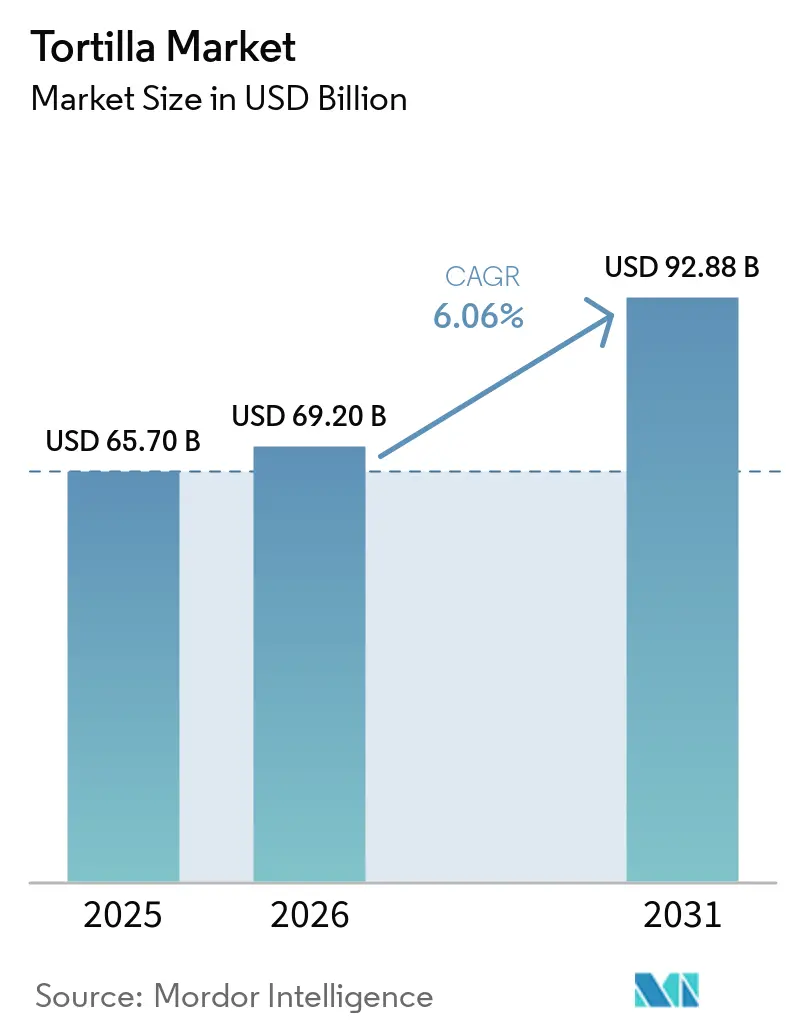
| Market Size (2026) | USD 69.20 Billion |
| Market Size (2031) | USD 92.88 Billion |
| Growth Rate (2026 - 2031) | 6.06% CAGR |
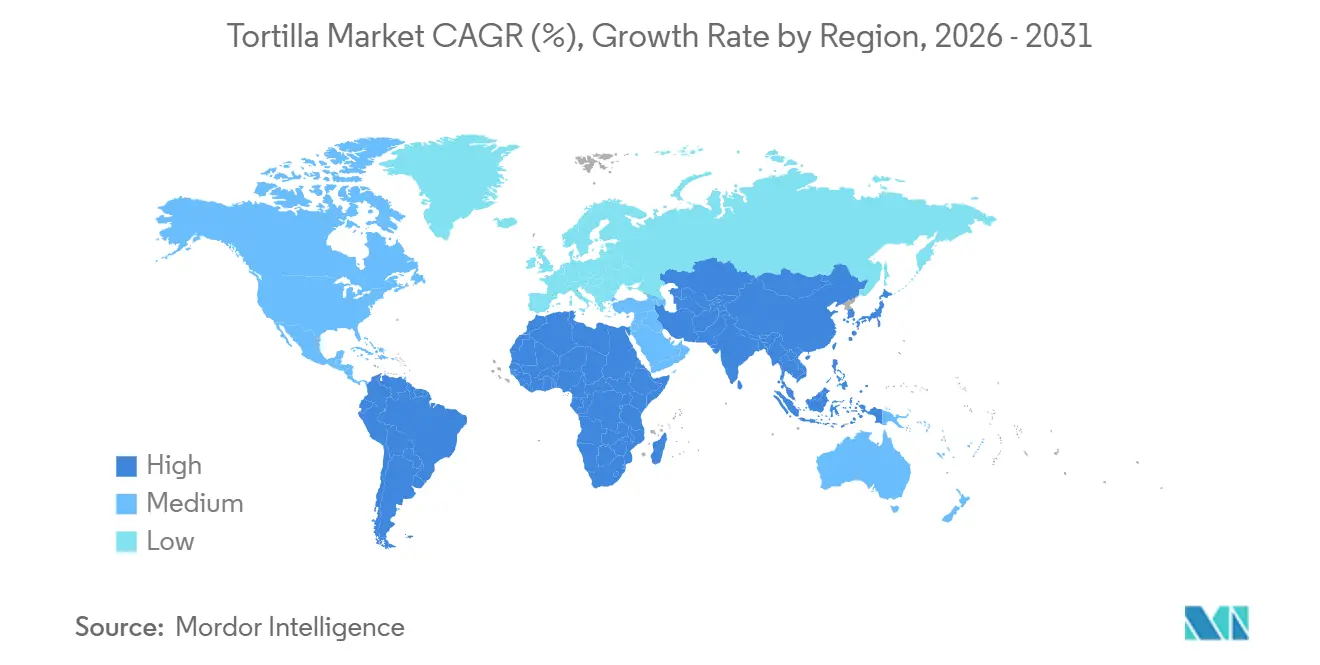
| Fastest Growing Market | Asia Pacific |
| Largest Market | North America |
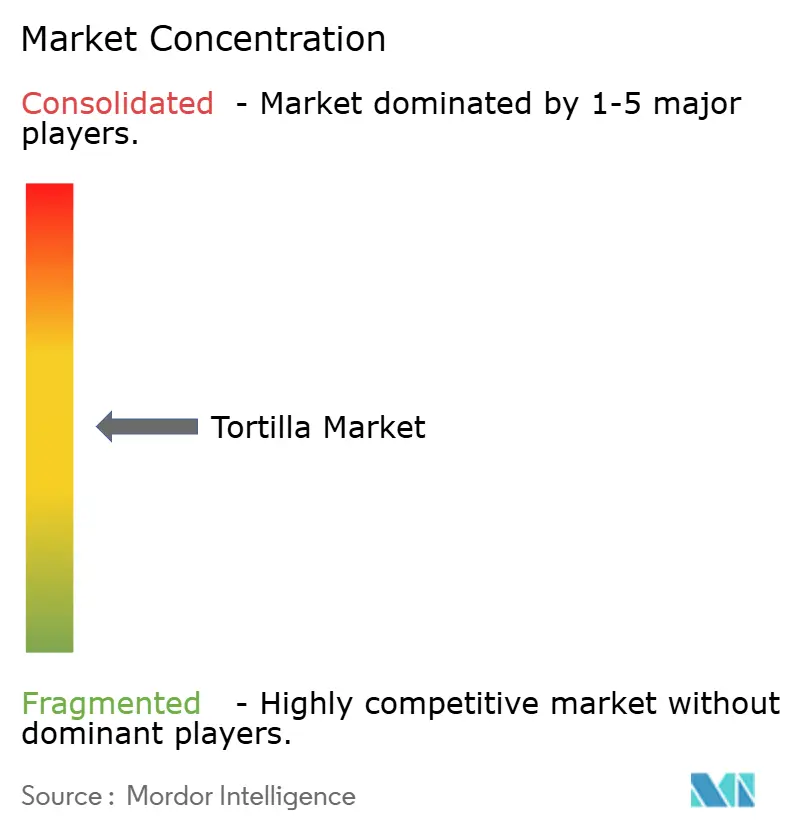
| Market Concentration | Medium |
Major Players *Disclaimer: Major Players sorted in no particular order Image © Mordor Intelligence. Reuse requires attribution under CC BY 4.0. | |
Tortilla Market Analysis by Mordor Intelligence
The tortilla market size is projected to expand from USD 65.70 billion in 2025 and USD 69.20 billion in 2026 to USD 92.88 billion by 2031, registering a CAGR of 6.06% between 2026 to 2031. The expansion of the tortilla market is driven significantly by the growing demand for convenient, portable meal options alongside the increasing popularity of Mexican and Tex-Mex cuisine, with quick-service restaurants progressively shifting focus toward tortilla-based menus to further contribute to market growth. Frozen tortillas have emerged as the fastest-growing segment, supported by advancements in cold-chain logistics across emerging markets. While gluten-free formulations account for a smaller share of the market, they command premium shelf space, underscoring the impact of health-conscious segmentation on profit margins. The competitive intensity within the market remains moderate, as major players like GRUMA (Gruma, S.A.B. de C.V.) and Grupo Bimbo leverage their scale advantages. However, niche brands are increasingly fragmenting the market share by catering to specific micro-segments, including grain-free and clean-label product categories.
Key Report Takeaways
- By product type, corn tortillas commanded 39.11% of the tortilla market share in 2025, while tortilla chips are set to expand at a 7.32% CAGR through 2031.
- By form, fresh and shelf-stable variants held 63.82% of the tortilla market size in 2025; frozen formats are projected to advance at 6.99% CAGR to 2031.
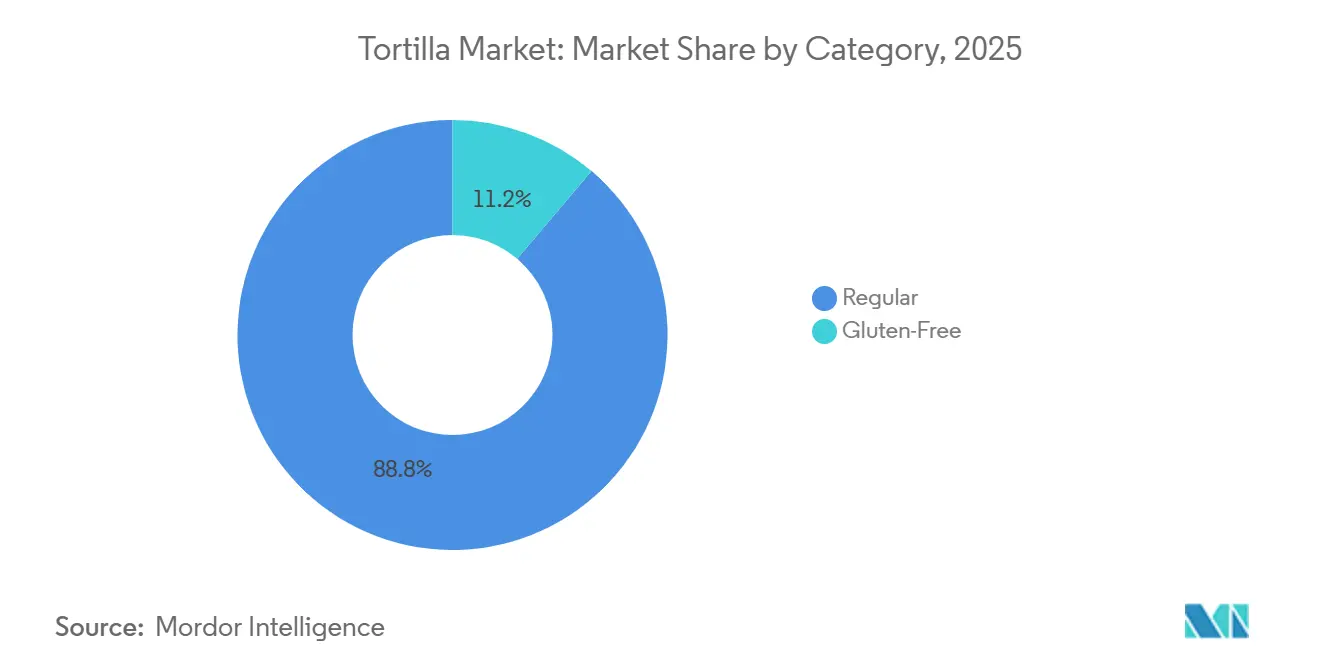
- By category, regular tortillas represented 88.81% of 2025 value, whereas gluten-free lines lead growth at 7.21% CAGR over 2026-2031.
- By distribution channel, foodservice and institutions accounted for 55.97% of 2025 revenue; retail channels are expanding at 7.87% CAGR through 2031.
- By geography, North America led with 46.83% revenue in 2025; Asia-Pacific is the fastest-growing region at 8.12% CAGR through 2031.
Note: Market size and forecast figures in this report are generated using Mordor Intelligence’s proprietary estimation framework, updated with the latest available data and insights as of January 2026.
Global Tortilla Market Trends and Insights
Drivers Impact Analysis*
| Driver | (~) % Impact on CAGR Forecast | Geographic Relevance | Impact Timeline |
|---|---|---|---|
| Rising demand for convenient, portable meal options like wraps and burritos | +1.2% | Global, with strongest uptake in North America, Europe, and urban Asia-Pacific | Medium term (2-4 years) |
| Growing popularity of ethnic cuisines, especially Tex-Mex and Mexican fusion globally | +1.0% | Global, led by Europe (Spain, France, Germany) and Asia-Pacific (China, Japan, South Korea) | Long term (≥ 4 years) |
| Expansion of quick-service restaurants and fast-casual chains using tortillas | +0.9% | North America, Europe, and urban centers in Asia-Pacific and Middle East | Medium term (2-4 years) |
| Increasing adoption of gluten-free corn-based tortillas for dietary needs | +0.8% | North America and Europe, with emerging demand in Asia-Pacific | Short term (≤ 2 years) |
| Urbanization leading to time-pressed lifestyles favoring ready-to-eat formats | +0.7% | Asia-Pacific, Middle East, and Latin America urban corridors | Long term (≥ 4 years) |
| Versatility in applications, from tacos to snacks and meal kits | +0.6% | Global, with meal-kit penetration highest in North America and Europe | Medium term (2-4 years) |
| Source: Mordor Intelligence | |||
Rising demand for convenient, portable meal options like wraps and burritos
Time-constrained consumers are driving a shift toward grab-and-go formats, with tortillas serving as the base for burritos, wraps, and quesadillas that provide complete nutrition in a portable form. This trend is particularly evident in urban areas where commute times exceed one hour, and limited time for meal preparation has increased demand for products requiring minimal assembly and suitable for on-the-go consumption. The frozen burrito category has grown significantly, supported by cryogenic freezing technologies that maintain texture and flavor, allowing manufacturers to distribute products nationally without compromising quality. An example is West Liberty Foods' BBQ Chicken Wrap Ingredient Pack, which includes flour tortillas, pre-cooked proteins, and sauces in a 70-day refrigerated format, helping reduce labor and improve efficiency in foodservice kitchens. Retail channels are also adapting to this trend, with supermarkets allocating more shelf space to refrigerated tortilla sections featuring flavored wraps such as tomato basil, spinach herb, and garlic herb, which are designed to enhance meal quality without requiring advanced culinary skills.
Growing popularity of ethnic cuisines, especially Tex-Mex and Mexican fusion globally
Mexican and Tex-Mex cuisines have seen significant growth in popularity across non-traditional markets, with tortillas now commonly available in mainstream European and Asian supermarkets alongside local flatbreads. In Europe, Spain is at the forefront of this trend, with tortilla sales increasing as consumers embrace fusion dishes that blend Spanish ingredients with Mexican culinary techniques, such as chorizo-filled tacos and patatas bravas quesadillas. In the Asia-Pacific region, localized flavor innovations reflect this trend, including seaweed-infused tortillas in Japan, curry-spiced versions in India, and kimchi wraps in South Korea. These adaptations align with regional taste preferences while retaining the convenience of the tortilla format. The expansion of this culinary fusion is further supported by social media, which amplifies food trends, and by younger consumers who prioritize experiential dining over traditional meal formats. To take advantage of this trend, brands should invest in regional flavor research and development and collaborate with local chefs to strengthen their position in high-growth markets. In contrast, brands that depend solely on standardized products risk becoming commoditized.
Expansion of quick-service restaurants and fast-casual chains using tortillas
Quick-service restaurant (QSR) and fast-casual operators are increasingly incorporating tortillas into their core menu structures due to the operational benefits they offer, which directly impact unit economics. Tortillas require only basic cooking equipment, such as a griddle or steamer, reducing capital expenditure per location. Additionally, their compact storage requirements save back-of-house space compared to bulkier bread products. The ongoing expansion of Chipotle and the growth of regional chains like Tortilla UK highlight how tortilla-based menus facilitate rapid scaling. Standardized assembly processes reduce training time and minimize labor variability across franchise locations. Mission Foods' bulk wrap variety packs, distributed through foodservice channels, are designed for high-volume operations, with heating instructions tailored for steam cabinets and grills to ensure consistent texture throughout shifts. For restaurant operators, the advantages of tortilla-focused menus are clear: they reduce ingredient stock-keeping unit (SKU) counts, streamline supply chains, and allow for menu customization at the point of sale, ultimately enhancing throughput and profit margins per square foot.
Increasing adoption of gluten-free corn-based tortillas for dietary needs
The demand for gluten-free products has grown beyond individuals diagnosed with celiac disease, evolving into a lifestyle choice for consumers looking to reduce wheat consumption. This trend has created a premium market segment, with gluten-free flour tortillas often priced higher than conventional options. While corn tortillas naturally meet gluten-free requirements, manufacturers are expanding the category with grain-free alternatives made from cassava, almond, and coconut flours, appealing to consumers following paleo and ketogenic diets. Siete Family Foods, acquired by PepsiCo in January 2025, achieved significant revenue by positioning grain-free tortillas and chips within the better-for-you segment, available in thousands of retail locations. Similarly, Tia Lupita Foods markets cactus-based tortillas as gluten-free, non-genetically modified organism (non-GMO), and preservative-free, shipping frozen products via United States Postal Service (USPS) Priority to address the cold-chain challenges of fresh formulations. Regulatory support is also notable, as Food and Drug Administration (FDA) gluten-free labeling standards provide clear compliance guidelines, while European Food Safety Authority (EFSA) regulations harmonize claims across member states, easing market entry for certified products [1]Source: United States Food and Drug Administration, “Gluten-Free Labeling of Foods,” fda.gov.
Restraints Impact Analysis*
| Restraint | (~) % Impact on CAGR Forecast | Geographic Relevance | Impact Timeline |
|---|---|---|---|
| Stringent food safety and labeling regulations varying by region | -0.4% | Global, with highest compliance costs in North America and Europe | Medium term (2-4 years) |
| Short shelf life of fresh tortillas leading to spoilage risks | -0.5% | Global, most acute in regions with underdeveloped cold-chain infrastructure | Short term (≤ 2 years) |
| Limited cold chain infrastructure in emerging regions | -0.3% | Asia-Pacific (excluding Japan, South Korea), Middle East, Africa, and interior Latin America | Long term (≥ 4 years) |
| Packaging waste concerns amid sustainability scrutiny | -0.2% | Europe, North America, and urban Asia-Pacific markets with active environmental regulations | Medium term (2-4 years) |
| Source: Mordor Intelligence | |||
Stringent food safety and labeling regulations varying by region
Regulatory fragmentation across jurisdictions increases compliance costs, placing a heavier burden on smaller manufacturers that lack dedicated regulatory affairs teams. For example, California's requirement for folic acid fortification in corn masa products differs from federal Food and Drug Administration (FDA) standards, compelling producers serving the state to maintain separate formulations and labeling. Similarly, the European Union's upcoming restrictions on certain preservatives and the Food and Drug Administration's ban on titanium dioxide necessitate reformulation efforts, straining research and development budgets and delaying product launches. The European Food Safety Authority's differing stance on enzyme use in dough conditioning further complicates transatlantic trade, as products approved in the United States may require re-certification for European markets, extending time-to-market and increasing legal expenses [2]. These regulatory differences benefit larger companies such as GRUMA and Grupo Bimbo, which have dedicated compliance functions and can spread certification costs across high-volume production. In contrast, regional players must either limit their geographic reach or accept reduced margins to manage compliance costs across multiple jurisdictions.
Short shelf life of fresh tortillas leading to spoilage risks
Fresh tortillas typically have a limited refrigerated shelf life, which restricts distribution timelines and increases the risk of spoilage, especially in multi-tier distribution networks involving wholesalers and independent retailers. This limitation requires manufacturers to maintain regional production facilities to reduce transit times, thereby limiting economies of scale and increasing per-unit logistics costs compared to shelf-stable products. Enzyme-based shelf-life extenders, such as maltogenic amylase and phospholipase, along with hydrocolloid blends, help address this challenge by preserving texture and moisture retention. However, adoption remains inconsistent due to consumer preferences for clean-label products, which often reject ingredient lists perceived as overly technical. This creates a strategic dilemma: extending shelf life with additives may deter health-conscious consumers, while minimalist formulations restrict geographic distribution and increase waste. Frozen tortilla formats provide an alternative, but the high costs of cold-chain logistics and consumer preferences for fresh over frozen products limit their viability, particularly in foodservice channels where authentic texture is prioritized over extended storage capabilities.
*Our forecasts treat driver/restraint impacts as directional, not additive. The impact forecasts reflect baseline growth, mix effects, and variable interactions.
Segment Analysis
By Product Type: Chips Drive Growth, Corn Holds Cultural Ground
Tortilla chips are projected to grow at a compound annual growth rate (CAGR) of 7.32% through 2031, surpassing other product types as manufacturers focus on flavor innovation and functional nutrition to expand snacking occasions beyond traditional dip-and-chip consumption. Examples include PepsiCo's Tostitos Mexican Street Corn and Doritos Protein (10 grams per serving), which demonstrate how established players utilize research and development capabilities to introduce limited-edition flavors and protein-enriched variants. These products command premium pricing and appeal to health-conscious millennial consumers. Corn tortillas accounted for 39.11% of the product-type share in 2025, driven by their cultural authenticity in Mexican cuisine and gluten-free attributes. However, their growth is slowing as flour tortillas gain popularity in fusion applications, where their larger diameter and greater flexibility support wrap-style formats. Tostadas and taco shells remain niche products, primarily used by foodservice operators seeking pre-formed shells for labor efficiency and portion control. Despite this, their combined market share remains below 15% due to limited versatility compared to flat tortillas, which can be shaped post-production.
Flour tortillas are experiencing growth driven by the increasing popularity of wraps and burritos, particularly in North America and Europe, where consumers associate larger-diameter tortillas with meal completeness and value. The segment faces a strategic balance between authenticity and functionality: corn tortillas provide cultural authenticity and health benefits, while flour tortillas offer better tear resistance and a neutral flavor profile suitable for diverse fillings. Manufacturers are addressing this by introducing hybrid formulations such as corn-flour blends, whole-grain options, and flavored wraps (e.g., spinach, tomato basil), which combine the strengths of both types. Mission Foods' variety packs, which include multiple flavors in foodservice-sized cases, illustrate how operators are leveraging assortment strategies to gauge consumer preferences without committing to single stock-keeping units (SKUs).


By Form: Frozen Gains as Cold-Chain Matures
Fresh and shelf-stable tortillas accounted for 63.82% of the form-based market share in 2025, while frozen variants are growing at a compound annual growth rate (CAGR) of 6.99%, driven by advancements in enzyme technologies and improved packaging that address texture degradation issues. Enzymes such as maltogenic amylase and phospholipase are being utilized to maintain pliability after thawing, while hydrocolloids like guar and carob gums help retain moisture during freeze-thaw cycles. These innovations mitigate brittleness and dryness, which previously limited the appeal of frozen tortillas. This progress is enabling national distribution for brands without regional production facilities, providing smaller players with market access if they invest in frozen formulations. For example, Tia Lupita Foods ships cactus tortillas frozen via United States Postal Service (USPS) Priority. This logistics approach avoids the high costs of refrigerated trucking while ensuring product integrity through expedited parcel delivery timelines.
Fresh tortillas continue to dominate foodservice channels where operators prioritize authentic texture and manage short shelf lives through high turnover rates. However, in retail, consumer preferences are shifting toward frozen tortillas due to their extended storage capabilities, even if they come with minor texture differences. Manufacturers' strategies depend on their channel focus. Portfolios heavily reliant on foodservice favor fresh production with regional plants, while retail-focused strategies increasingly justify investments in frozen production capacity. These investments enable geographic expansion without proportional increases in logistics costs. Shelf-stable tortillas occupy an intermediate position, offering ambient distribution without refrigeration but requiring preservatives that conflict with clean-label preferences. This trade-off limits their appeal in premium market segments. As a result, form-based segmentation is fragmenting along channel and price-tier lines. Fresh tortillas dominate foodservice and premium retail, frozen tortillas are gaining traction in mass-market retail, and shelf-stable formats cater to price-sensitive and infrastructure-constrained markets.
By Category: Gluten-Free Commands Premium, Regular Defends Volume
Regular tortillas accounted for 88.81% of the category share in 2025, reflecting a mainstream consumer base that prioritizes affordability and familiarity over specialized dietary attributes. However, gluten-free variants are growing at a compound annual growth rate (CAGR) of 7.21%, driven by an increase in celiac disease diagnoses and a shift toward wheat-avoidance as a lifestyle choice among affluent demographics. Siete Family Foods' grain-free portfolio exemplifies the economic potential of gluten-free positioning. Before its USD 1.2 billion acquisition by PepsiCo, the brand generated USD 500 million in revenue, with products retailing at 20-30% premiums over conventional tortillas. The brand achieved distribution across 40,000 locations by initially targeting natural-food retailers and premium supermarket chains before expanding into mainstream channels. Cassava, almond, and coconut flour formulations are gaining traction, each catering to specific dietary groups such as paleo, ketogenic (keto), and Whole30 diets, known for their high brand loyalty and willingness to pay for perceived health benefits.
The segmentation within the tortilla market is influencing strategic decisions among market participants. Companies face a choice between focusing on gluten-free research and development, characterized by lower production volumes but higher profit margins, or defending their position in the regular segment through price competition and promotional activities. GRUMA and Grupo Bimbo are pursuing dual strategies, maintaining large-scale production of regular tortillas while launching premium gluten-free sub-brands targeted at niche distribution channels. At the same time, private-label products, which have shown significant growth in the hard and soft tortilla category through March 2025, remain concentrated in the regular segment. Retailers are taking advantage of price differences to attract cost-conscious consumers, thereby increasing margin pressures on branded competitors.
By Distribution Channel: Retail Closes Gap on Foodservice
In 2025, foodservice and institutional buyers represented 55.97% of the distribution channel share. Meanwhile, the retail channel is expanding at a compound annual growth rate (CAGR) of 7.87%. This growth is fueled by the increasing prominence of e-commerce platforms, supermarket private-label programs, and direct-to-consumer brands catering to health-conscious consumers with specialty formulations that are often unavailable through traditional foodservice supply chains. These trends underscore distinct value propositions: foodservice prioritizes bulk packaging, consistent texture, and operational efficiency, while retail focuses on brand differentiation, attractive packaging, and on-pack claims emphasizing health and sustainability attributes. According to the International Trade Administration, global B2C e-commerce is growing at a steady CAGR of 14.4% [3]Source: International Trade Administration “2024 eCommerce Size & Sales Forecast,” trade.gov.
Mission Foods' foodservice packs, designed for steam-cabinet heating, differ significantly from their retail stock-keeping units (SKUs), which feature resealable pouches, nutritional information, and recipe suggestions to drive consumer purchases. E-commerce remains the fastest-growing retail sub-channel, enabling niche brands to bypass slotting fees and reach national audiences through direct shipping. However, frozen tortilla brands encounter higher fulfillment costs due to the cold-chain logistics required for parcel delivery. Supermarkets and hypermarkets continue to dominate retail volume, with refrigerated tortilla sections experiencing notable growth in the 52 weeks ending March 2025. This growth is attributed to brands like Siete, which achieved significant sales increases and secured premium shelf space due to strong sales velocity and margin contributions.
Geography Analysis
North America accounted for 46.83% of the geographic market share in 2025, driven by the region's strong cultural connection to Mexican cuisine, well-established quick-service restaurant (QSR) infrastructure, and high per-capita consumption of convenience foods. However, growth is slowing due to market saturation and demographic changes that are reducing the expansion of Hispanic populations, which have historically driven category adoption. The United States continues to be the largest national market for tortillas. The retail tortilla growth rate indicates a maturing category, with incremental gains driven by premiumization trends, such as organic, gluten-free, and protein-fortified options, rather than increases in volume. In Mexico, the market is deeply rooted in cultural traditions but faces economic volatility. Tortilla prices increased significantly in 2022, following a notable rise in international maize prices. This highlights how reliance on commodity imports and limited domestic self-sufficiency exacerbate inflationary pressures on consumers. In Canada, consistent demand is supported by urban multiculturalism and the penetration of quick-service restaurants, though per-capita consumption remains lower than in the United States, which limits overall growth potential.
The Asia-Pacific region is experiencing significant growth, with a projected compound annual growth rate (CAGR) of 8.12 percent through 2031. Urbanization, rising disposable incomes, and culinary globalization are driving tortilla adoption in markets where the product was virtually unknown a decade ago. China and India are the primary growth drivers, with tortillas positioned as convenient alternatives to traditional flatbreads such as roti, naan, and baozi wrappers in urban centers where time constraints and Western food trends are reshaping meal patterns. In Japan and South Korea, localized flavor variants such as seaweed and kimchi are aligning tortillas with regional taste preferences. Meanwhile, Australia's established Mexican-food culture provides a mature base for premium and organic segments. In Southeast Asia, including Thailand, Indonesia, and Singapore, tortillas are in the early stages of adoption, primarily distributed through modern retail chains and international QSR franchises. However, infrastructure constraints and price sensitivity limit penetration beyond affluent urban populations. For brands targeting Asia-Pacific, localization is critical, including flavor adaptation, halal certification in Muslim-majority markets, and partnerships with regional retailers and foodservice operators to build category awareness and encourage trial.
Europe's tortilla market exhibits mixed growth patterns. The United Kingdom's market is relatively mature, supported by chains like Tortilla UK and widespread supermarket distribution. However, growth is slowing as the category nears saturation in urban areas. Regulatory harmonization under the European Food Safety Authority (EFSA) provides a unified compliance framework, reducing market-entry barriers for pan-European brands. Nonetheless, cultural fragmentation, such as varying taste preferences, meal structures, and retail formats, necessitates country-specific strategies rather than a one-size-fits-all approach. In South America, growth is concentrated in Brazil, Argentina, and Chile, where urbanization and rising middle-class incomes are driving demand for packaged and frozen tortillas. However, the region's cultural preference for fresh, locally produced foods limits the appeal of shelf-stable imports. This dynamic underscores the need for localized strategies to address consumer preferences while leveraging urban growth trends. The Middle East and Africa remain emerging markets for tortillas. Distribution is primarily through hypermarkets in Gulf Cooperation Council countries such as the United Arab Emirates and Saudi Arabia, as well as urban areas in South Africa. However, limited cold-chain infrastructure and low consumer awareness constrain near-term growth. These regions represent long-term opportunities, contingent on investments in infrastructure and efforts to educate consumers about the category.

Competitive Landscape
The tortilla market demonstrates moderate concentration, with GRUMA and Grupo Bimbo holding a significant share of global capacity. This dominance is supported by their vertically integrated supply chains, regional production networks, and multi-brand portfolios that cater to value, mainstream, and premium segments. GRUMA's planned USD 233 million investment for 2024 focuses on capacity expansions in Guatemala, China, Europe, and Mexico. This includes a USD 89 million plant in Yucatán with an annual output of 56,000 tonnes and a USD 46.5 million snack facility in Puebla. These investments reflect a strategy to maintain market share through scale while entering high-growth regions ahead of smaller competitors. Similarly, Grupo Bimbo's acquisition of Joy Food International in Morocco, scheduled for January 2026, includes a CPE-800 tortilla line capable of producing 1,300 pieces per hour. This move extends Grupo Bimbo's reach in North Africa and the Middle East, leveraging its bakery distribution networks to cross-sell tortillas alongside bread and other baked goods. However, the market is becoming increasingly fragmented at the premium and specialty ends. Brands such as Siete Family Foods, acquired by PepsiCo for USD 1.2 billion in January 2025, and Tia Lupita Foods are capturing higher margins by targeting health-conscious consumers. These consumers are willing to pay 20 to 30 percent premiums for grain-free, organic, and clean-label products.
White-space opportunities in the tortilla market are concentrated around three key areas: alternative-flour innovation such as chickpea, lentil, and hemp, functional nutrition such as protein-fortified and probiotic-infused products, and sustainable packaging that complies with emerging regulatory requirements while maintaining shelf life. Emerging disruptors are increasingly adopting direct-to-consumer models to bypass traditional retail channels. They leverage social media and influencer partnerships to build brand equity before transitioning to brick-and-mortar distribution. This approach was successfully executed by Siete and is being replicated by Tia Lupita with its cactus-based tortillas, which are shipped frozen via parcel carriers.
Automation is becoming a critical competitive advantage as labor shortages persist, particularly in North America. Manufacturers are deploying robotics for processes such as dough sheeting, cutting, and packaging to reduce labor dependency and improve consistency. The strategic decision-making for established players involves balancing economies of scale in core segments with the agility required to capture fast-growing niches. This dynamic is driving mergers and acquisitions activity, as large companies acquire emerging brands rather than developing specialty capabilities internally. General Mills' USD 10 million acquisition of La Tiara in May 2025 and its subsequent April 2026 Walmart-exclusive relaunch illustrate this buy-versus-build strategy. The company chose to purchase an established brand and distribution network rather than introducing a new stock-keeping unit (SKU) into an already crowded category.
Tortilla Industry Leaders
GRUMA S.A.B. de C.V.
Grupo Bimbo S.A.B. de C.V.
Ole Mexican Foods Inc.
Tyson Foods Inc.
PepsiCo Inc.
- *Disclaimer: Major Players sorted in no particular order

Recent Industry Developments
- June 2025: General Mills acquired the La Tiara brand of hard taco shells from Gladstone Food Products for approximately USD 10 million. The acquisition followed Gladstone's operational shutdown caused by construction-related issues.
- March 2025: Siete Family Foods expanded its operations in Buda, Texas, by occupying 218,000 square feet in the Buda Commerce Center. The company invested an estimated USD 250,000 in facility modifications to support increased production capacity following its acquisition by PepsiCo.
- November 2024: General Mills has announced the expansion of its Hannibal, Missouri facility to include a production line for Old El Paso hard-shell tacos. This initiative is supported by the Missouri Works program and aims to enhance the manufacturing capabilities of the facility, which currently employs more than 1,000 workers.


Global Tortilla Market Report Scope
The tortilla market includes the industrial production and commercial distribution of corn and wheat-based unleavened flatbreads and related products. These products include wraps, taco shells, tostadas, chips, and mixes, which are supplied through retail and foodservice channels globally. The market is segmented by product type, including tostadas, corn tortillas, flour tortillas, tortilla chips, and taco shells. It is also segmented by form into fresh or shelf-stable and frozen options. By category, the market includes regular and gluten-free products. Distribution channels are divided into foodservice and institutions (business-to-business or B2B), retail (business-to-consumer or B2C), supermarkets and hypermarkets, convenience stores, online retail stores, and other distribution channels. Geographically, the market is analyzed across North America, Europe, Asia-Pacific, South America, and the Middle East and Africa. The market sizing has been done in value terms in USD for all the abovementioned segments.
| Tostadas |
| Corn Tortillas |
| Flour Tortillas |
| Tortilla Chips |
| Taco Shells |
| Fresh/Shelf Stable |
| Frozen |
| Regular |
| Gluten-Free |
| Foodservice and Institutions (B2B) | |
| Retail (B2C) | Supermarkets and Hypermarkets |
| Convenience Stores | |
| Online Retail Stores | |
| Other Distribution Channel |
| North America | United States |
| Canada | |
| Mexico | |
| Rest of North America | |
| Europe | Germany |
| United Kingdom | |
| Italy | |
| France | |
| Spain | |
| Netherlands | |
| Poland | |
| Belgium | |
| Sweden | |
| Rest of Europe | |
| Asia-Pacific | China |
| India | |
| Japan | |
| Australia | |
| Indonesia | |
| South Korea | |
| Thailand | |
| Singapore | |
| Rest of Asia-Pacific | |
| South America | Brazil |
| Argentina | |
| Colombia | |
| Chile | |
| Peru | |
| Rest of South America | |
| Middle East and Africa | South Africa |
| Saudi Arabia | |
| United Arab Emirates | |
| Nigeria | |
| Egypt | |
| Morocco | |
| Turkey | |
| Rest of Middle East and Africa |
| By Product Type | Tostadas | |
| Corn Tortillas | ||
| Flour Tortillas | ||
| Tortilla Chips | ||
| Taco Shells | ||
| By Form | Fresh/Shelf Stable | |
| Frozen | ||
| By Category | Regular | |
| Gluten-Free | ||
| By Distribution Channel | Foodservice and Institutions (B2B) | |
| Retail (B2C) | Supermarkets and Hypermarkets | |
| Convenience Stores | ||
| Online Retail Stores | ||
| Other Distribution Channel | ||
| By Geography | North America | United States |
| Canada | ||
| Mexico | ||
| Rest of North America | ||
| Europe | Germany | |
| United Kingdom | ||
| Italy | ||
| France | ||
| Spain | ||
| Netherlands | ||
| Poland | ||
| Belgium | ||
| Sweden | ||
| Rest of Europe | ||
| Asia-Pacific | China | |
| India | ||
| Japan | ||
| Australia | ||
| Indonesia | ||
| South Korea | ||
| Thailand | ||
| Singapore | ||
| Rest of Asia-Pacific | ||
| South America | Brazil | |
| Argentina | ||
| Colombia | ||
| Chile | ||
| Peru | ||
| Rest of South America | ||
| Middle East and Africa | South Africa | |
| Saudi Arabia | ||
| United Arab Emirates | ||
| Nigeria | ||
| Egypt | ||
| Morocco | ||
| Turkey | ||
| Rest of Middle East and Africa | ||


Key Questions Answered in the Report
What is the projected value of the tortilla market by 2031?
The tortilla market is forecast to reach USD 92.88 billion by 2031, reflecting a 6.06% CAGR from 2026 to 2031.
Which region is expected to grow fastest in tortilla consumption?
Asia-Pacific leads with an 8.12% CAGR through 2031, driven by urban middle-class adoption and localized flavor innovations.
How significant is the gluten-free segment within tortillas?
Gluten-free lines captured 11.19% of 2025 value and are growing at 7.21% CAGR, outpacing the regular category in margin contribution.
Who are the dominant manufacturers in tortillas?
GRUMA and Grupo Bimbo together hold more than 60% of global capacity through integrated supply chains and broad brand portfolios.
What are the main challenges limiting tortilla shelf life?
Fresh tortillas last roughly 70 days refrigerated, making spoilage a concern in long supply chains without robust cold-chain support.
Page last updated on:


