Market Overview
| Study Period | 2021 - 2031 |
|---|---|
| Forecast Data Period | 2026 - 2031 |
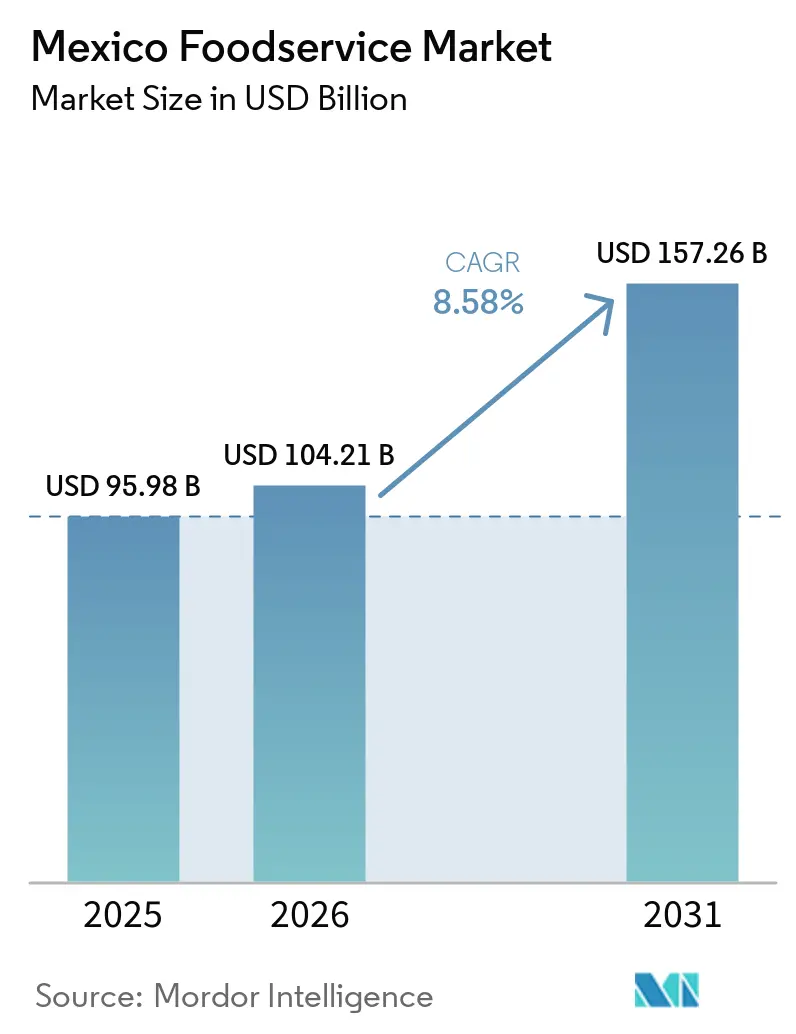
| Base Year Market Size (2025) | USD 95.98 Billion |
| Market Size (2026) | USD 104.21 Billion |
| Market Size (2031) | USD 157.26 Billion |
| Growth Rate (2026 - 2031) | 8.58% CAGR |
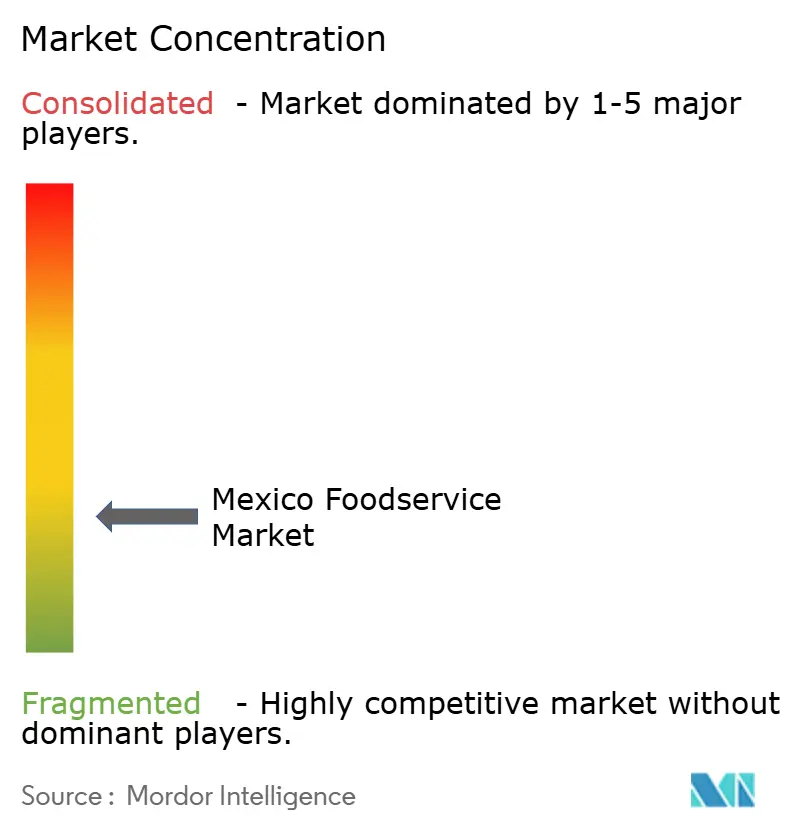
| Market Concentration | Low |
Major Players
*Disclaimer: Major Players sorted in no particular order Image © Mordor Intelligence. Reuse requires attribution under CC BY 4.0. |
|
Mexico Foodservice Market Analysis by Mordor Intelligence
The Mexico foodservice market was valued at USD 95.98 billion in 2025 and estimated to grow from USD 104.21 billion in 2026 to reach USD 157.26 billion by 2031, at a CAGR of 8.58% during the forecast period (2026-2031). Several factors are driving this expansion, including rising disposable income, urbanization, and an increasing demand for convenience-driven dining options such as fast food, delivery services, and online ordering platforms. The country’s vibrant tourism sector and growing middle class are further fueling market growth, with consumers seeking diverse and international food offerings. Additionally, health-conscious trends and a shift toward healthier dining options are influencing the foodservice landscape. As the market expands, it presents opportunities for both local and international foodservice players to tap into the evolving consumer preferences and growing demand for convenience and variety.
Key Report Takeaways
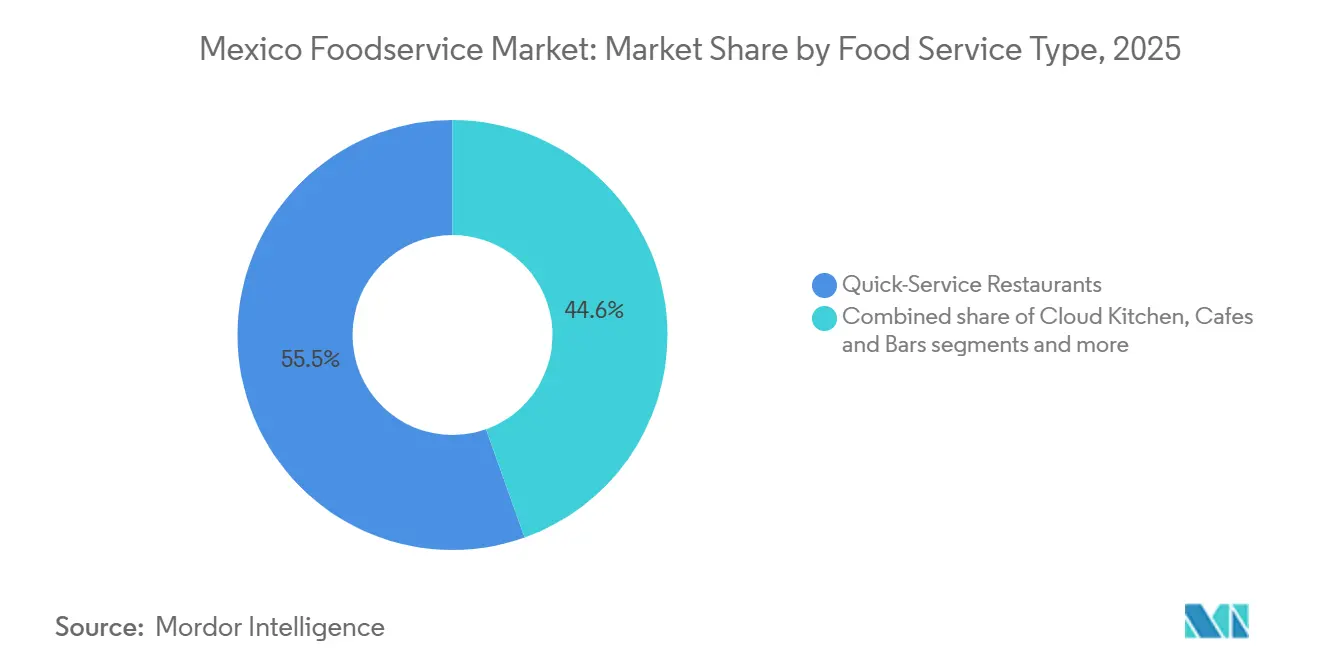
- By foodservice type, quick-service restaurants captured 55.45% of the Mexico foodservice market share in 2025, while cafes and bars are forecast to expand at a 12.31% CAGR between 2026 and 2031.
- By outlet, independent outlets held 56.53% of the Mexico foodservice market size in 2025, while chained outlets are advancing at a 10.16% CAGR through 2031.
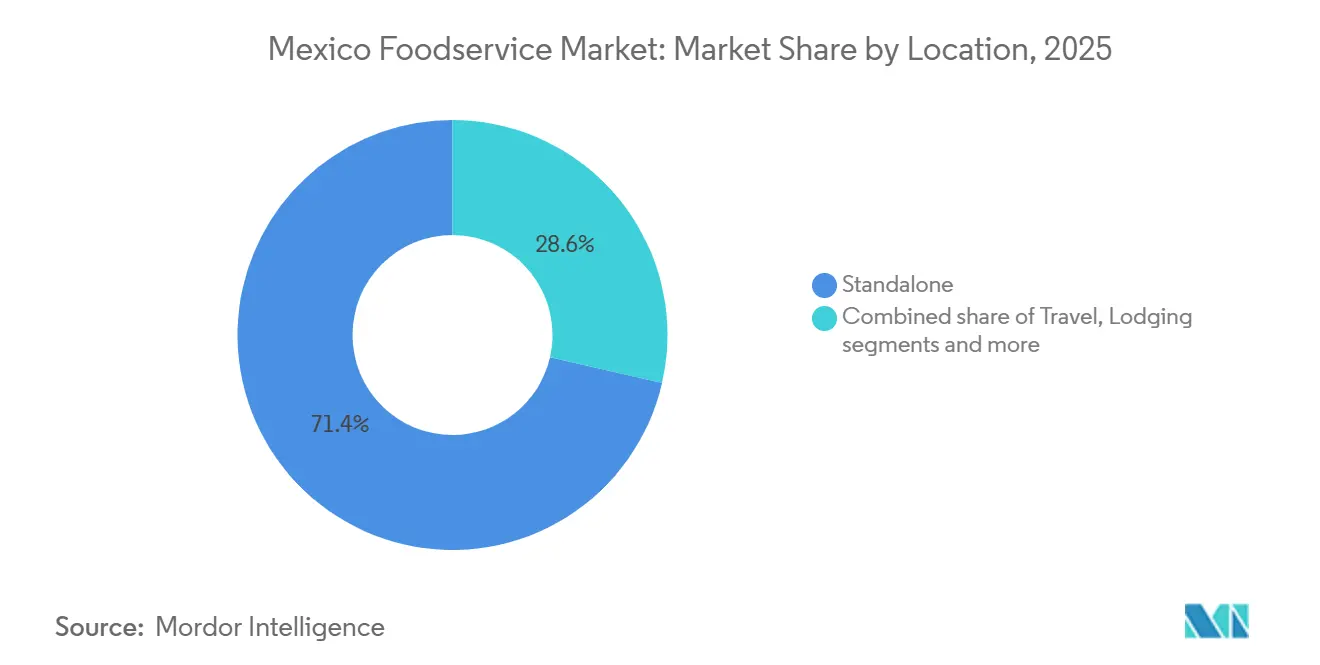
- By location, standalone locations commanded 71.41% of sector revenue in 2025; lodging-based foodservice is projected to grow at a 12.14% CAGR to 2031.
- By service type, dine-in transactions accounted for 62.14% of sales in 2025; delivery is expected to rise at a 12.71% CAGR across the forecast horizon.
Note: Market size and forecast figures in this report are generated using Mordor Intelligence’s proprietary estimation framework, updated with the latest available data and insights as of January 2026.
Mexico Foodservice Market Trends and Insights
Drivers Impact Analysis*
| Driver | (~) % Impact on CAGR Forecast | Geographic Relevance | Impact Timeline |
|---|---|---|---|
| Increasing dining out and convenience food consumption | +1.8% | National, with concentration in Mexico City, Monterrey, Guadalajara | Medium term (2-4 years) |
| Growing tourism and business travel boosting demand for foodservice sector | +2.1% | Quintana Roo, Baja California Sur, Nayarit, Jalisco, Mexico City | Short term (≤ 2 years) |
| Investments in infrastructure and government support for the hospitality sector | +0.9% | Guerrero (Acapulco), Quintana Roo, tourist corridors | Medium term (2-4 years) |
| Growth in middle-class households leads to higher demand for diverse food options | +0.7% | National, with urban concentration | Long term (≥ 4 years) |
| Interest in international cuisines fosters growth in ethnic and fusion foodservice establishments | +1.2% | Mexico City, Monterrey, Guadalajara, Puebla, Querétaro | Medium term (2-4 years) |
| Growing adoption of online food delivery platforms fuels market growth | +1.9% | National, led by Mexico City, Guadalajara, Monterrey | Short term (≤ 2 years) |
| Source: Mordor Intelligence | |||


Increasing dining out and convenience food consumption
The growing trend of dining out and convenience food consumption is a significant driver of the Mexico foodservice market. As urbanization increases and disposable incomes rise, more consumers are opting to eat out or order food rather than cooking at home. This shift is largely driven by busy lifestyles, especially in metropolitan areas like Mexico City and Monterrey, where people seek quick, convenient dining options. Furthermore, the rising availability of online ordering platforms such as Uber Eats and Rappi enhances convenience, allowing consumers to have a wide variety of food options at their fingertips. As a result, dining out is increasingly seen as a lifestyle choice rather than just an occasional activity. This growing demand is reflected in the restaurant sector, which now generates 3.8 million jobs across more than 680,000 establishments, contributing 3.2% to Mexico's national GDP and 13.4% to tourism GDP, further highlighting the vital role the foodservice industry plays in the country’s economy [1]Source: Portal CANIRAC , "Cámara Nacional de la Industria de Restaurantes y Alimentos Condimentados", portal.canirac.org.mx .
Growing tourism and business travel boosting demand for foodservice sector
The increasing tourism and business travel in Mexico are key drivers of growth in the country's foodservice market. From January to July 2025, Mexico recorded 27.7 million international tourist arrivals, a rise of over 7% compared to the same period in 2024, further fueling demand for dining options across the country [2]Source: Travel and Tour World, "Nearly Five Million Tourists Show Up in Mexico for 2025–2026 End‑of‑Year Season As National Data Shows Record Growth in Tourism", travelandtourworld.com. As more international visitors flock to popular destinations, the need for diverse dining experiences increases, prompting restaurants, hotels, and local eateries to expand their offerings. Business travel also contributes, with corporate events and conferences generating a need for catering and quick, high-quality meals. This surge in travel is encouraging the growth of both fine dining and fast-casual establishments, as well as delivery services. Mexico’s foodservice market is benefiting from a wide variety of consumer preferences, from traditional Mexican dishes to international cuisines. Major cities like Mexico City and Monterrey are seeing the highest demand due to increased business activity. Overall, tourism and business travel play a vital role in sustaining the momentum of Mexico's foodservice sector.
Investments in infrastructure and government support for the hospitality sector
Investments in infrastructure and strong government support are driving the growth of Mexico's foodservice market. The government has been prioritizing improvements in transportation, airports, and tourist facilities, which enhance accessibility for both tourists and business travelers. Additionally, initiatives to promote the hospitality sector, such as financial incentives and policy support, encourage the expansion of hotels, restaurants, and catering services. These developments create a more favorable environment for foodservice businesses, helping them meet rising demand and improve service quality. Major infrastructure projects, such as new airports and highways, also open up previously underserved areas, expanding the market reach for foodservice providers. As a result, the sector benefits from increased consumer traffic and greater economic opportunities. Overall, the combination of infrastructure development and government backing is propelling the growth of Mexico’s dynamic foodservice industry.
Interest in international cuisines fosters growth in ethnic and fusion foodservice establishments
The growing interest in international cuisines is driving significant growth in Mexico's foodservice market, with rising demand for ethnic and fusion establishments. Consumers are increasingly seeking diverse flavors from Asian, Middle Eastern, and Latin American influences, blending them with traditional Mexican dishes like tacos and moles. This trend is especially popular among urban millennials and tourists, expanding menus in both quick-service restaurants (QSRs) and full-service outlets. Fusion concepts, such as sushi-burritos or Korean-Mexican tacos, are attracting younger demographics and premium diners willing to pay more for innovative experiences. Urbanization and rising disposable incomes in cities like Mexico City and Guadalajara are fueling the growth of specialized ethnic chains and pop-ups. Social media also plays a crucial role, amplifying the visibility of viral dishes and encouraging trial and repeat visits to these trendy eateries.
Restraints Impact Analysis*
| Restraint | (~) % Impact on CAGR Forecast | Geographic Relevance | Impact Timeline |
|---|---|---|---|
| Stringent regulations on food safety and hygiene | -0.6% | National, enforced by Comisión Federal para la Protección contra Riesgos Sanitarios | Medium term (2-4 years) |
| Inconsistent food supply chains, including shortages and price volatility | -0.9% | National, acute in agricultural states | Short term (≤ 2 years) |
| Rising costs of raw materials, labor, and rent limiting profitability | -1.4% | National, most severe in Mexico City, Monterrey, Guadalajara | Short term (≤ 2 years) |
| Growth of home cooking, especially with food delivery kits | -0.5% | Urban centers, middle-income households | Medium term (2-4 years) |
| Source: Mordor Intelligence | |||
Stringent regulations on food safety and hygiene
Stringent regulations on food safety and hygiene are a key restraint in Mexico's foodservice market, driving up operational costs and increasing compliance burdens for establishments. Authorities like Comisión Federal para la Protección contra Riesgos Sanitarios (COFEPRIS) enforce rigorous standards for food handling, storage, and preparation, requiring frequent inspections, certifications, and staff training programs. Small and independent operators often struggle with the financial strain of upgrading facilities, investing in sanitation equipment, and hiring specialized personnel to meet these standards. Non-compliance can lead to hefty fines, temporary closures, or even license revocations, discouraging new entrants and slowing expansion, especially in the casual dining and street food segments. In urban areas like Mexico City, where heightened scrutiny follows past outbreaks, chains are compelled to adopt costly Hazard Analysis and Critical Control Points (HACCP) systems and traceability technologies. While these regulations protect public health, they also limit menu innovation and flexibility, particularly for ethnic or fusion concepts with complex supply chains.
Rising costs of raw materials, labor, and rent limiting profitability
Labor costs have surged as Mexico's minimum wage climbed from MXN 312.41 per day in 2023 to MXN 374.89 in 2024 and MXN 419.88 in 2025, representing a 97% increase in real terms between 2019 and 2025 [3]Source: Centro de Estudios Fiscales, S.C. (CEFA), "El Fiscal", cefa.org.mx. Restaurant-specific inflation accelerated in January 2025, driven by food commodity prices and energy costs. Real-estate inflation in prime urban locations, particularly Mexico City's Polanco and Condesa districts, Monterrey's San Pedro, and Guadalajara's Providencia has pushed rents beyond the reach of single-unit operators, consolidating market share among chains with access to institutional capital. Cámara Nacional de la Industria Restaurantera y Alimentos Condimentados (CANIRAC) reported that security spending rose 8% in 2024, with 99% of establishments installing surveillance cameras, adding another fixed cost. These pressures are forcing operators to optimize labor scheduling, automate order-taking, and renegotiate lease terms, but many independents lack the scale or sophistication to implement these measures effectively.
*Our forecasts treat driver/restraint impacts as directional, not additive. The impact forecasts reflect baseline growth, mix effects, and variable interactions.
Segment Analysis
By Foodservice Type: Cafes and Bars Outpace QSR Growth
Quick-Service Restaurants (QSR) commanded the largest market share in Mexico's foodservice market in 2025, capturing 55.45% of total sales through their unmatched efficiency and affordability. Brands like Domino's, Burger King, and prominent local chains dominated this segment by offering sub-USD 5 meals that cater directly to budget-conscious consumers facing economic pressures. These outlets excel in delivering rapid service with minimal wait times, often under five minutes, making them the go-to choice for urban workers and families seeking value without compromise. The segment's strength lies in its widespread presence across cities like Mexico City, Guadalajara, and Monterrey, where high foot traffic and drive-thru options amplify accessibility. QSRs have also leveraged aggressive digital integration, including app-based ordering and loyalty programs, to lock in repeat customers amid rising inflation.
Cafes and Bars emerged as the fastest-growing segment in Mexico's foodservice market, projected to expand at a robust 12.31% CAGR through 2031, outpacing other categories amid evolving consumer lifestyles. This growth reflects a bifurcation in priorities, where premium-seeking urban millennials and Gen Z demographics prioritize experiential socializing over pure transactional meals. Cafes are riding the wave of specialty coffee culture and Instagram-worthy aesthetics, drawing younger crowds with artisanal beverages, light bites, and co-working vibes in trendy neighborhoods. Bars, meanwhile, capitalize on craft cocktails, local craft beers, and nightlife recovery post-pandemic, fostering evening footfall in entertainment districts. The segment benefits from rising disposable incomes among professionals and tourism influx, particularly in coastal and cultural hubs like Cancun and Oaxaca. Overall, this trajectory signals a premiumization trend, balancing QSR's value focus with cafes and bars' emphasis on lifestyle and indulgence.


By Outlet: Chained Concepts Gain Ground in Fragmented Market
Independent outlets dominated the Mexico foodservice market in 2025, securing 56.53% of the total market size through their entrenched presence and adaptability to local tastes. These establishments, ranging from family-run taquerias to neighborhood comederas, thrive on authentic regional cuisines like street-style tacos, pozole, and fresh seafood, which resonate deeply with everyday consumers. Their prevalence stems from low entry barriers, flexibility in menu pricing, and strong community ties, particularly in non-metro areas where chained options remain sparse. Independent outlets excel in catering to price-sensitive diners amid economic volatility, offering customizable portions and home-style cooking that multinational chains struggle to replicate. This segment's resilience is evident in its dominance across full-service and limited-service formats, bolstered by cash-based transactions and word-of-mouth loyalty.
Chained outlets are surging as the fastest-growing segment in Mexico's foodservice market, forecasted to advance at a compelling 10.16% CAGR through 2031, driven by expansion strategies and brand standardization. Major players like Grupo Caliente and international entrants are scaling rapidly in urban hubs such as Mexico City and border cities, capitalizing on consistent quality, marketing muscle, and loyalty programs. These chains benefit from economies of scale in procurement, enabling competitive pricing while introducing innovations like hybrid dine-in/delivery models. The growth trajectory reflects rising urbanization and middle-class aspirations, where consumers seek reliable experiences amid busy lifestyles. Chained outlets are also penetrating tier-2 cities via franchising, supported by digital platforms for seamless ordering and data-driven menu tweaks. This momentum signals a modernization wave, gradually eroding independents' share as branded convenience gains traction nationwide.
By Location: Lodging Segment Rides Tourism Wave
Standalone locations commanded 71.41% of sector revenue in Mexico's foodservice market in 2025, establishing themselves as the overwhelming dominant force through their widespread accessibility and operational flexibility. These outlets, encompassing independent eateries, street vendors, and small-scale restaurants, thrive across urban centers like Mexico City and rural communities alike, offering everything from quick tacos to full meals tailored to local palates. Their stronghold derives from low overhead costs, rapid adaptability to regional ingredients, and direct engagement with loyal neighborhood customers who prioritize familiarity and affordability. Standalone venues excel in high-volume, everyday dining occasions, capturing casual breakfasts, lunches, and snacks that chained or institutional formats cannot match in scale or immediacy. This segment's resilience shines amid economic fluctuations, as proprietors swiftly adjust menus and pricing to maintain footfall without corporate constraints.
Lodging-based foodservice emerged as the fastest-growing segment in Mexico's foodservice market, forecasted to surge at a robust 12.14% CAGR through 2031, fueled by booming tourism and hospitality recovery. Hotel restaurants, resort buffets, and in-house dining within accommodations are capitalizing on international visitor influx to hotspots like Cancun, Riviera Maya, and Puerto Vallarta, where travelers seek convenient, all-inclusive options. This growth reflects heightened travel demand post-pandemic, with luxury and mid-tier properties expanding food and beverage offerings to boost occupancy and ancillary revenue. Lodging-based outlets benefit from captive audiences, enabling premium pricing on fusion cuisines, themed brunches, and room service that blend local flavors with global appeal.
By Service Type: Delivery Platforms Reshape Consumer Behavior
Dine-in transactions dominated Mexico's foodservice market in 2025, capturing 62.14% of total sales through their enduring appeal as the cornerstone of social and cultural dining experiences. Traditional restaurants, cafes, and family-style eateries thrive on the preference for on-premise gatherings, where consumers savor full meals, ambiance, and personal service that digital alternatives cannot replicate. This segment's strength stems from widespread availability across urban hubs like Mexico City and regional towns, catering to lunch breaks, family outings, and evening socializing with authentic flavors like mole and carnitas. Dine-in outlets maintain loyalty through personalized hospitality, live music in some venues, and the tactile joy of shared plates, which resonate deeply in Mexico's communal food culture.
Delivery emerged as the fastest-growing segment in Mexico's foodservice market, projected to expand at an impressive 12.71% CAGR through the forecast period, propelled by digital adoption and urban convenience demands. Platforms like Uber Eats, Rappi, and DiDi Food have transformed accessibility, enabling rapid doorstep service for busy professionals and households in sprawling metros such as Guadalajara and Tijuana. This surge reflects post-pandemic habits, with cloud kitchens optimizing menus for packaging and apps driving impulse orders during peak hours. Delivery benefits from low consumer effort, real-time tracking, and promotions that undercut dine-in costs, particularly for late-night cravings or rainy days. The segment's momentum is boosted by partnerships with QSRs and independents, alongside investments in last-mile logistics to penetrate tier-2 cities.
Geography Analysis
The Mexico foodservice market is geographically diverse, with major growth concentrated in urban areas, particularly in Mexico City, Monterrey, and Guadalajara. These metropolitan regions account for a significant portion of the market share due to their large populations, higher disposable incomes, and evolving dining preferences. Mexico City, as the capital and largest city, leads the market, offering a wide variety of foodservice options ranging from quick-service restaurants (QSRs) to casual dining and fine dining establishments. The fast-paced lifestyle in these cities is a key driver for the increasing demand for delivery services and fast-food chains, contributing to the growth of the foodservice market.
In contrast, smaller cities and rural regions experience more moderate growth. While foodservice options are available, the market is less saturated compared to urban centers, with a preference for traditional, home-cooked meals and local dining experiences. However, the expansion of regional players and international chains is gradually changing this landscape. Smaller cities are seeing a rise in the popularity of international cuisines, quick-service options, and delivery platforms, as well as an increase in the number of mid-range restaurants catering to a growing middle class.
The tourism sector plays a vital role in shaping the geography of the foodservice market in Mexico, particularly in beach destinations like Cancún, Los Cabos, and Puerto Vallarta. These tourist hotspots experience high foot traffic, driving demand for diverse dining options, including international fast food, local Mexican cuisine, and upscale restaurants. The influx of international tourists supports the expansion of global restaurant chains and local gourmet dining experiences. This geography-based demand creates significant growth opportunities for businesses in these regions, as foodservice providers cater to both local residents and tourists seeking unique dining experiences.
Competitive Landscape
The Mexico foodservice market is characterized by a highly fragmented landscape, with numerous players ranging from large multinational chains to small local restaurants. The market's diversity allows for a wide array of offerings, catering to varying consumer preferences across different regions. Global brands like McDonald’s, Pizza Hut, and Subway dominate the fast food and quick-service restaurant (QSR) sectors, leveraging their established brand presence, operational efficiency, and wide-reaching distribution networks. However, local players, such as Toks and Vips, also hold substantial market share by offering distinct Mexican dining experiences and regional flavors, allowing them to build strong customer loyalty.
In addition to established brands, new entrants and independent operators continue to shape the competitive environment. Small-scale restaurants, food trucks, and independent cafes thrive by focusing on niche markets, offering unique or authentic Mexican cuisine and personalized dining experiences. These players often cater to changing consumer demands for healthier options, sustainable practices, and local sourcing. The rise of online food delivery services, such as Rappi and Uber Eats, has also intensified competition, enabling even small local businesses to access broader customer bases and compete against larger foodservice chains.
The growing trend of health-conscious dining and sustainability is fostering competition between brands to adapt and innovate. Larger chains are incorporating organic, plant-based, and locally sourced food items into their menus to meet evolving consumer preferences. At the same time, independent restaurants are responding to these shifts by emphasizing fresh ingredients, sustainable practices, and dietary-specific menus like gluten-free or vegan options. As the market continues to evolve, players must remain agile and responsive to these trends to maintain competitiveness and address shifting consumer expectations.
Mexico Foodservice Industry Leaders
-
Yum! Brands Inc.
-
Alsea, S.A.B. de C.V.
-
Arcos Dorados Holdings Inc.
-
Restaurant Brands International Inc.
-
Wendy's International, Inc.
- *Disclaimer: Major Players sorted in no particular order

Recent Industry Developments
- December 2025: Alsea, S.A.B. de C.V., the top foodservice operator in South America and Europe, has inked a deal with Raising Cane’s to establish restaurants in Mexico. The inaugural outlet is slated to commence operations in the latter half of 2026, and Alsea is eyeing further expansion prospects in the area.
- October 2025: Popeyes has inked new development agreements with regional franchisees in Mexico. These collaborations underscore a pivotal moment in Popeyes' expansion strategy, with a dedicated plan to establish over 300 restaurants in the next decade across Mexico's Northwest, West, Central, and Southeast regions.
- April 2025: Chipotle Mexican Grill has inked a deal to debut its restaurants in Mexico. Teaming up with Alsea, S.A.B. de C.V. (Alsea), a prominent restaurant operator in both Latin America and Europe, Chipotle is set to launch its first Mexican outlet by early 2026, with plans to scout further expansion opportunities in the area.


Mexico Foodservice Market Report Scope
Foodservice is the business of preparing, handling, and serving food to people outside of their homes. The market scope encompasses cafes & bars, cloud kitchens, full-service restaurants, and quick-service restaurants.
The Mexico foodservice market is segmented by foodservice type, outlet, location, and service type. Based on foodservice type, the market is segmented into cafes and bars, cloud kitchens, full-service restaurants and quick-service restaurants. Based on outlet, the market is segmented by chained outlets and independent outlets. Based on location, the market is segmented by leisure, lodging, retail, standalone, and travel. Based on service type, the market is segmented by dine-in, takeaway, and delivery). The market sizing has been done in value terms in USD for all the above mentioned segments.
By Foodservice Type
| Cafes and Bars | Bars and Pubs |
| Cafes | |
| Juice/Smoothie/Dessert Bars | |
| Specialist Coffee and Tea Shops | |
| Cloud Kitchens | |
| Full-Service Restaurants | Asian |
| European | |
| Latin American | |
| Middle Eastern | |
| North American | |
| Other FSR Cuisines | |
| Quick-Service Restaurants | Bakeries |
| Burger | |
| Ice-cream | |
| Meat-based Cuisines | |
| Pizza | |
| Other QSR Cuisines |
Outlet
| Chained Outlets |
| Independent Outlets |
Location
| Leisure |
| Lodging |
| Retail |
| Standalone |
| Travel |
Service Type
| Dine-in |
| Takeaway |
| Delivery |
| By Foodservice Type | Cafes and Bars | Bars and Pubs |
| Cafes | ||
| Juice/Smoothie/Dessert Bars | ||
| Specialist Coffee and Tea Shops | ||
| Cloud Kitchens | ||
| Full-Service Restaurants | Asian | |
| European | ||
| Latin American | ||
| Middle Eastern | ||
| North American | ||
| Other FSR Cuisines | ||
| Quick-Service Restaurants | Bakeries | |
| Burger | ||
| Ice-cream | ||
| Meat-based Cuisines | ||
| Pizza | ||
| Other QSR Cuisines | ||
| Outlet | Chained Outlets | |
| Independent Outlets | ||
| Location | Leisure | |
| Lodging | ||
| Retail | ||
| Standalone | ||
| Travel | ||
| Service Type | Dine-in | |
| Takeaway | ||
| Delivery | ||


Market Definition
- FULL-SERVICE RESTAURANTS - A foodservice establishment where customers are seated at a table, give their order to a server and are served food at a table.
- QUICK SERVICE RESTAURANTS - A foodservice establishment that provides customers convenience, speed, and food offerings at lower prices. Customers usually help themselves and carry their own food to their tables.
- CAFES & BARS - A type of foodservice business that include bars and pubs that are licensed to serve alcoholic drinks for consumption, cafes that serve refreshments and light food items, as well as specialty tea and coffee shops, dessert bars, smoothie bars, and juice bars.
- CLOUD KITCHEN - A foodservice business that utilizes a commercial kitchen for the purpose of preparing food for delivery or takeout only, with no dine-in customers.
| Keyword | Definition |
|---|---|
| Albacore Tuna | It is one of the smallest species of tuna found in the six distinct stocks known globally in the Atlantic, Pacific, and Indian oceans, as well as the Mediterranean Sea. |
| Angus beef | It is beef derived from a specific breed of cattle indigenous to Scotland. It requires certification from the American Angus Association to receive the "Certified Angus Beef" quality mark. |
| Asian cuisine | It includes full-service offerings in restaurants that serve cuisines from cultures such as Chinese, Indian, Korean, Japanese, Bengali, Southeast Asian, etc. |
| Average Order Value | It is the average value of all orders made by the customers at a foodservice establishment. |
| Bacon | It is salted or smoked meat that comes from the back or sides of a pig. |
| Bars & Pubs | It is a drinking establishment that is licensed to serve alcoholic drinks for consumption on the premises. |
| Black Angus | It is beef derived from a black-hided breed of cows that don't have horns. |
| BRC | British Retail Consortium |
| Burger | It is a sandwich consisting of one or more cooked beef patties, placed inside a sliced bread roll or bun roll. |
| Café | It is a foodservice establishment serving various refreshments (mainly coffee) and light meals. |
| Cafes & Bars | It is a type of foodservice business that include bars and pubs that are licensed to serve alcoholic drinks for consumption, cafes that serve refreshments and light food items, as well as specialty tea and coffee shops, dessert bars, smoothie bars, and juice bars. |
| Cappuccino | It is an Italian coffee drink that is traditionally prepared with equal parts double espresso, steamed milk, and steamed milk foam. |
| CFIA | Canadian Food Inspection Agency |
| Chained Outlet | It refers to a foodservice establishment that shares brands, operates in several locations, has central management, and standardized business practices. |
| Chicken Tender | It refers to chicken meat prepared from the pectoralis minor muscles of a chicken bird. |
| Cloud Kitchen | It is a foodservice business that utilizes a commercial kitchen for the purpose of preparing food for delivery or takeout only, with no dine-in customers. |
| Cocktail | It is an alcoholic mixed drink made with either a single spirit or a combination of spirits, mixed with other ingredients such as juices, flavored syrups, tonic water, shrubs, and bitters. |
| Edamame | It is a Japanese dish prepared with soybeans (harvested before they ripen or harden) and cooked in its pod. |
| EFSA | European Food Safety Authority |
| ERS | Economic Research Service of the USDA |
| Espresso | It is a concentrated form of coffee, served in shots. |
| European cuisine | It includes full-service offerings in restaurants that serve cuisines from cultures such as Italian, French, German, English, Dutch, Danish, etc. |
| FDA | Food and Drug Administration |
| Fillet Mignon | It is a cut of meat taken from the smaller end of the tenderloin. |
| Flank Steak | It is a cut of beef steak taken from the flank, which lies forward of the rear quarter of a cow. |
| Foodservice | It refers to the part of the food industry which includes businesses, institutions, and companies which prepare meals outside the home. It includes restaurants, school and hospital cafeterias, catering operations, and many other formats. |
| Franks | Also known as frankfurter or Würstchen, it is a type of highly seasoned smoked sausage popular in Austria and Germany. |
| FSANZ | Food Standards Australia New Zealand |
| FSIS | Food Safety and Inspection Service |
| FSSAI | Food Safety and Standards Authority of India |
| Full service restaurant | It refers to a foodservice establishment where customers are seated at a table, give their order to a server, and are served food at a table. |
| Ghost Kitchen | It refers to a cloud kitchen. |
| GLA | Gross Leasable Area |
| Gluten | It is a family of proteins found in grains, including wheat, rye, spelt, and barley. |
| Grain-fed beef | It is beef derived from cattle that have been fed a diet supplemented with soy and corn and other additives. Grain-fed cows can also be given antibiotics and growth hormones to fatten them up more quickly. |
| Grass-fed beef | It is beef derived from cattle that have only been fed grass as feed. |
| Ham | It refers to the pork meat taken from the leg of a pig. |
| HoReCa | Hotels, Restaurants and Cafes |
| Independent Outlet | It refers to a foodservice establishment that operates with a single outlet or is structured as a small chain with no more than three locations. |
| Juice | It is a drink made from the extraction or pressing of the natural liquid contained in fruit and vegetables. |
| Latin American | It includes full-service offerings in restaurants that serve cuisines from cultures such as Mexican, Brazilian, Argentinian, Colombian, etc. |
| Latte | It is a milk-based coffee that is made up of one or two shots of espresso, steamed milk, and a thin layer of frothed milk. |
| Leisure | It refers to foodservice offered as a part of a recreation business, such as sports arenas, zoos, movie theaters, and museums. |
| Lodging | It refers to foodservice offerings at hotels, motels, guesthouses, holiday homes, etc. |
| Macchiato | It is an espresso coffee drink with a small amount of milk, usually foamed. |
| Meat-based cuisines | This inlcudes food items like fried chicken, steak, ribs, etc. where meat is the primary ingredient for the dish. |
| Middle Eastern cuisine | It includes full-service offerings in restaurants that serve cuisines from cultures such as Arabic, Lebanese, Iranian, Israeli, etc. |
| Mocktail | It is an non-alcoholic mixed drink. |
| Mortadella | It is a large Italian sausage or luncheon meat made of finely hashed or ground heat-cured pork, which incorporates at least 15% small cubes of pork fat. |
| North American | It includes full-service offerings in restaurants that serve cuisines from cultures such as American, Canadian, Caribbean, etc. |
| Pastrami | It refers to a highly seasoned smoked beef, typically served in thin slices. |
| PDO | Protected Designation of Origin: It is the name of a geographical region or specific area that is recognized by official rules to produce certain foods with special characteristics related to location. |
| Pepperoni | It is an American variety of spicy salami made from cured meat. |
| Pizza | It is a dish made typically of flattened bread dough spread with a savory mixture usually including tomatoes and cheese and often other toppings and baked. |
| Primal cuts | It refers to the major sections of the carcass. |
| Quick service restaurant | It refers to a foodservice establishment that provides customers convenience, speed, and food offerings at lower prices. Customers usually help themselves and carry their own food to their tables. |
| Retail | It refers to a foodservice outlet inside a mall. shopping complex or a commercial real estate building, where there are other businesses operating as well. |
| Salami | It is a cured sausage consisting of fermented and air-dried meat. |
| Saturated fat | It is a type of fat in which the fatty acid chains have all single bonds. It is generally considered unhealthy. |
| Sausage | It is a meat product made of finely chopped and seasoned meat, which may be fresh, smoked, or pickled and which is then usually stuffed into a casing. |
| Scallop | It is an edible shellfish that is a mollusk with a ribbed shell in two parts. |
| Seitan | It is a plant-based meat substitute made out of wheat gluten. |
| Self-service kiosk | It refers to a self-order point-of-sale (POS) system through which customers place and pay for their own orders at kiosks, enabling totally contactless and frictionless service. |
| Smoothie | It is a beverage made by placing all the ingredients in a container and processing them together, without removing the pulp. |
| Specialty coffee & tea shops | It refers to a foodservice establishment that serves only various types of tea or coffee. |
| Standalone | It refers to a restaurants that have an independent infrastructure setup and not connected to any other business. |
| Sushi | It is a Japanese dish of prepared vinegared rice, usually with some sugar and salt, accompanied by a variety of ingredients, such as seafood—often raw—and vegetables. |
| Travel | It refers to foodservice offerings such as airplane food, dining on long-distance trains, and foodservice on cruise ships. |
| Virtual Kitchen | It refers to a cloud kitchen. |
| Wagyu Beef | It is beef derived from any of four strains of a breed of black or red Japanese cattle that are valued for their highly marbled meat. |


Research Methodology
Mordor Intelligence follows a four-step methodology in all our reports.
- Step-1: Identify Key Variables: In order to build a robust forecasting methodology, the variables and factors identified in Step 1 are tested against available historical market numbers. Through an iterative process, the variables required for the market forecast are set, and the model is built on the basis of these variables.
- Step-2: Build a Market Model: Market size estimations for the forecast years are in nominal terms. Inflation is considered for average order value, and it is forecasted as per predicted inflation rates in the countries.
- Step-3: Validate and Finalize: In this important step, all market numbers, variables, and analyst calls are validated through an extensive network of primary research experts from the market studied. The respondents are selected across levels and functions to generate a holistic picture of the market studied.
- Step-4: Research Outputs: Syndicated Reports, Custom Consulting Assignments, Databases & Subscription Platforms


