Thailand Hyperscale Data Center Market Size and Share
Market Overview
| Study Period | 2019 - 2031 |
|---|---|
| Forecast Data Period | 2025 - 2031 |
| Historical Data Period | 2019 - 2023 |
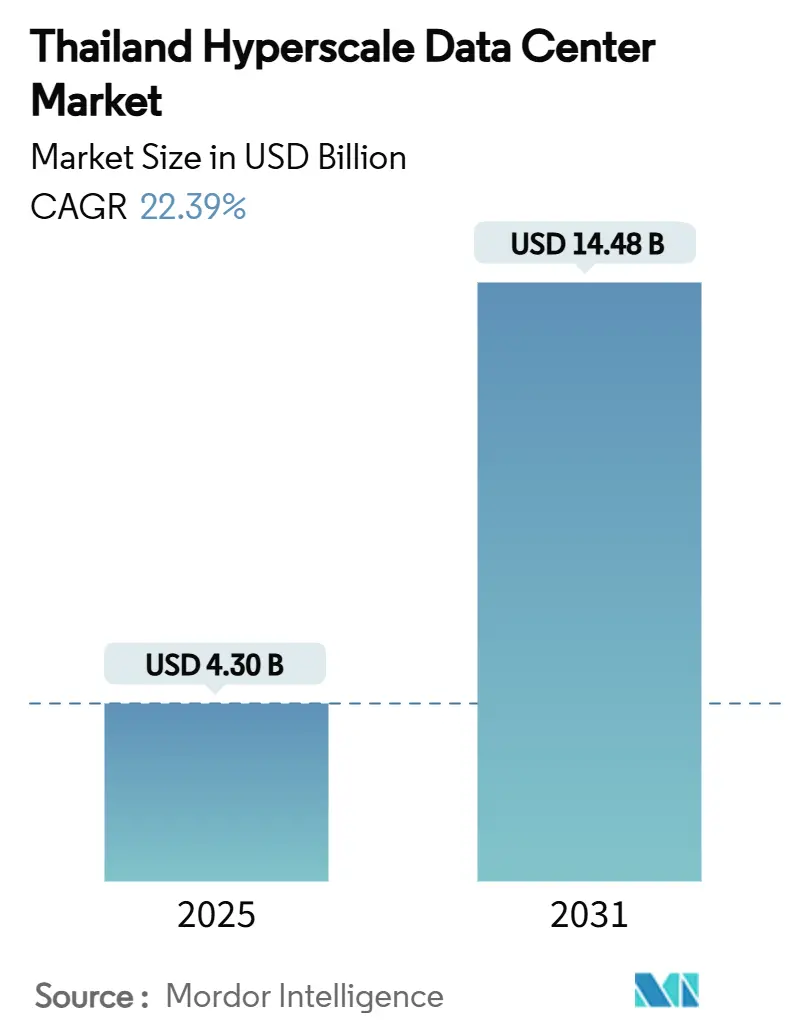
| Market Size (2025) | USD 4.30 Billion |
| Market Size (2031) | USD 14.48 Billion |
| Growth Rate (2025 - 2031) | 22.39% CAGR |
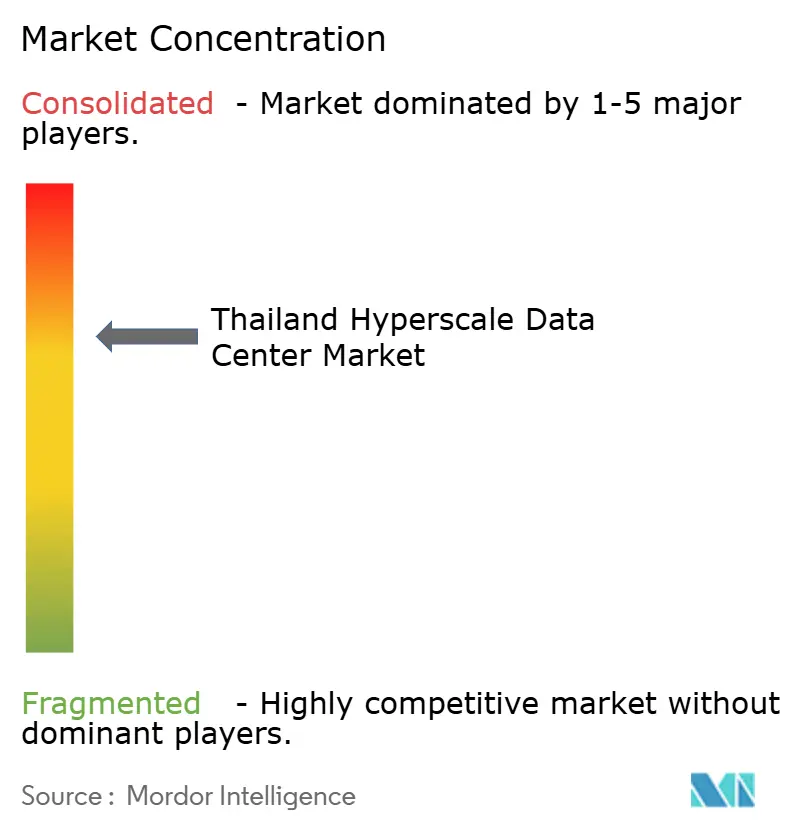
| Market Concentration | Medium |
Major Players *Disclaimer: Major Players sorted in no particular order Image © Mordor Intelligence. Reuse requires attribution under CC BY 4.0. | |
Thailand Hyperscale Data Center Market Analysis by Mordor Intelligence
Thailand Hyperscale Data Center Market - Market Overview
Thailand hyperscale data center market size stands at USD 4.30 billion in 2025 and is projected to reach USD 14.48 billion by 2031, expanding at a 22.39% CAGR. The installed IT load mirrors this trajectory, rising from 756.92 MW in 2025 to 2,533.89 MW by 2031, indicating capacity-driven value growth rather than pricing premiums. Demand is propelled by government incentives under Thailand 4.0, rapid enterprise cloud adoption, and hyperscaler self-build commitments that exceeded USD 8 billion during 2024-2025. Subsea cable landings in the Eastern Economic Corridor (EEC) reduce international bandwidth costs, strengthening Thailand’s position as a cross-border latency hub. At the same time, electricity-tariff uncertainty and limited renewable-energy certificate (REC) supply temper near-term expansion, compelling operators to prioritise energy-efficient architectures and direct power-purchase agreements.
Key Report Takeaways
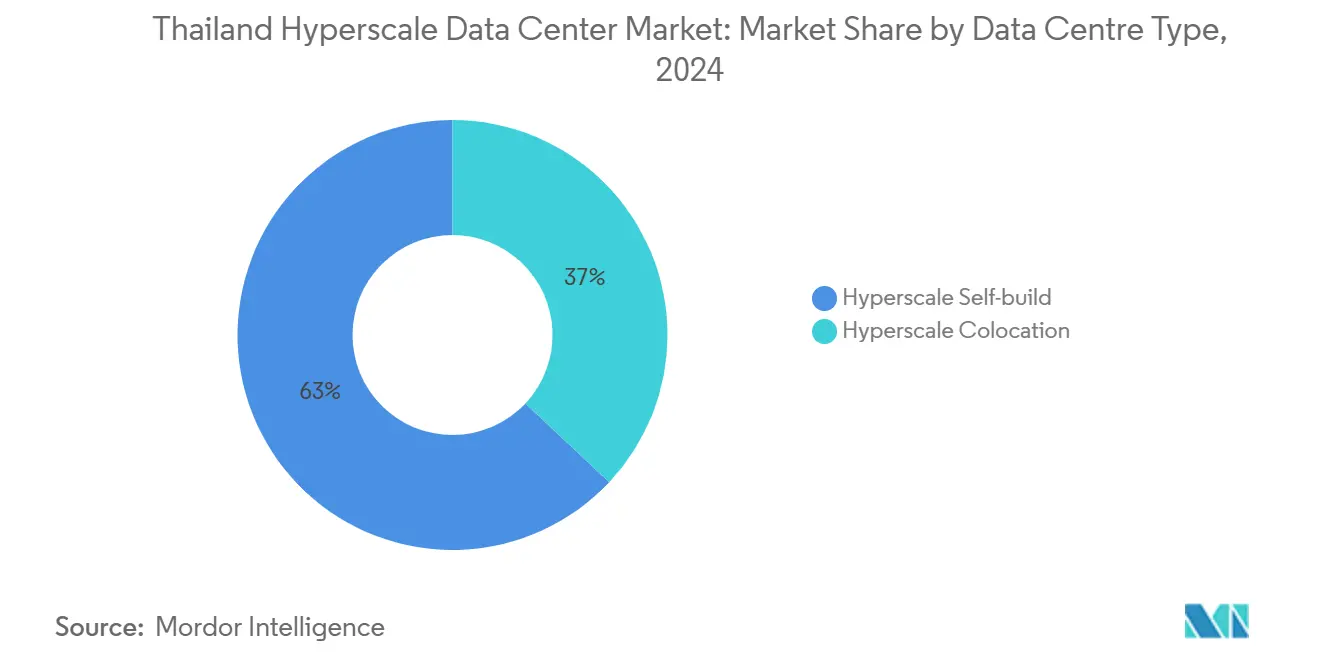
- By data centre type, hyperscaler self-build held 63% of the Thailand hyperscale data center market share in 2024.
- By component, IT infrastructure accounted for 45% of the Thailand hyperscale data center market size in 2024.
- By tier standard, Tier IV deployments are projected to grow at a 23.2% CAGR to 2030, outpacing Tier III.
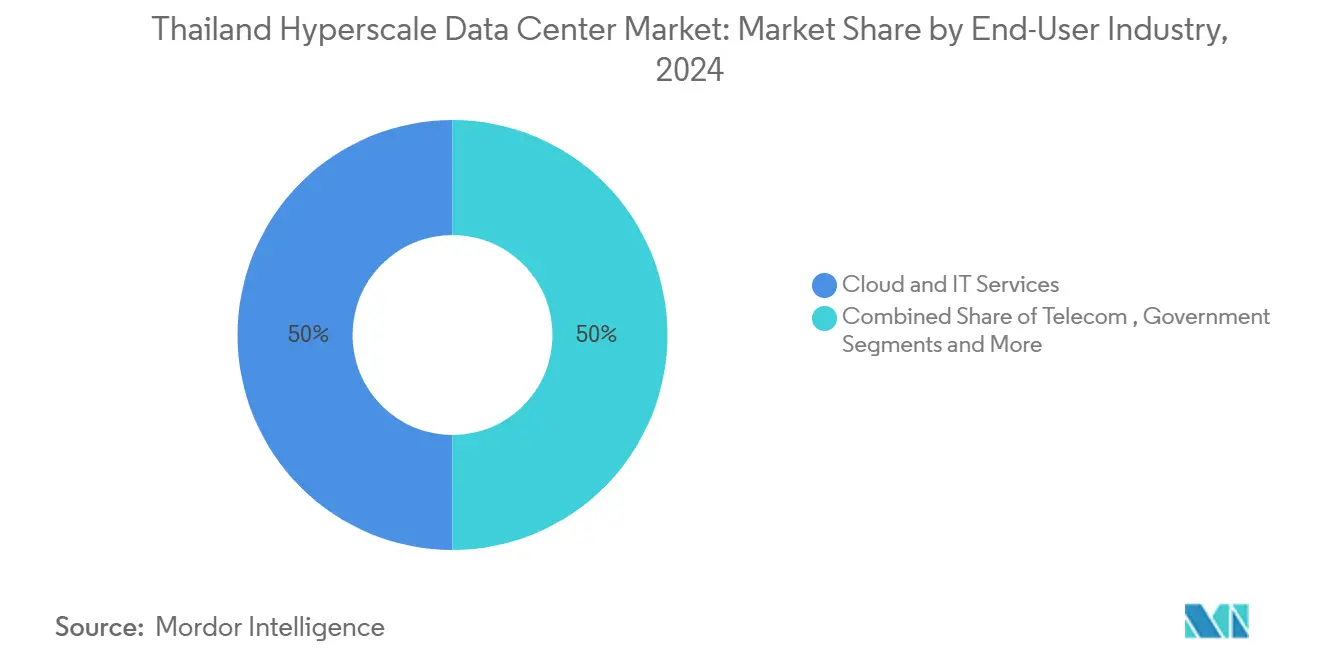
- By end-user industry, BFSI workloads record the highest forecast CAGR at 23.1% through 2030.
- By data centre size, mega-scale facilities (greater than 60 MW) are set to expand at a 24.6% CAGR during the same period.
Thailand sits within a large system shaped by the activity of multiple countries and regions operating in parallel. Our global report on hyperscale data center market reflects how these multiple regional dynamics combine into a worldwide structure.
Thailand Hyperscale Data Center Market Trends and Insights
Drivers Impact Analysis*
| Driver | (~) % Impact on CAGR Forecast | Geographic Relevance | Impact Timeline |
|---|---|---|---|
| Cloud-region expansions by hyperscalers | +6.2% | Bangkok and EEC | Medium term (2-4 years) |
| BOI tax incentives and Thailand 4.0 digital policy | +4.8% | National; EEC priority | Long term (≥ 4 years) |
| 5G-driven OTT video and mobile-gaming traffic | +3.9% | Urban centres | Short term (≤ 2 years) |
| EEC subsea-cable landings | +2.7% | Chonburi, Rayong, Chachoengsao | Medium term (2-4 years) |
| Planned 1.5 GW renewable-PPA framework | +2.1% | Industrial zones | Long term (≥ 4 years) |
| Cross-border latency hubs for Indochina AI clusters | +1.8% | Border provinces and Bangkok nodes | Long term (≥ 4 years) |
| Source: Mordor Intelligence | |||
Cloud-region expansions by hyperscalers
Amazon Web Services launched the AWS Asia Pacific (Thailand) Region in January 2025 after pledging USD 5 billion, creating three availability zones engineered for sovereign-cloud and AI workloads.[1]Amazon Web Services, “AWS Launches Infrastructure Region in Thailand,” PRESS.ABOUTAMAZON.COM Google committed USD 1 billion for a Chonburi campus that will anchor its first Thai cloud region. Microsoft and Oracle have disclosed similar roadmaps, while AIS is co-building a domestically owned cloud under Oracle Alloy to capture sensitive public-sector workloads. These deployments create a virtuous cycle of enterprise migration, stimulating colocation and edge demand across the Thailand hyperscale data center market.
BOI tax incentives and Thailand 4.0 digital policy
The Board of Investment (BOI) grants 50% corporate-income-tax reductions for five years on data-centre CAPEX over USD 33 million, plus import-duty exemptions on critical equipment.[2]U.S. Department of Commerce, “Thailand Clean Energy Direct Purchase,” TRADE.GOV Enhanced privileges in the EEC include longer tax holidays and fast-track licensing, trimming total cost of ownership by 15-20 % relative to neighbouring Malaysia. Coupled with grant programmes for AI skill-building, the framework reinforces demand across cloud, BFSI, and manufacturing verticals.
5G-driven OTT video and mobile-gaming traffic
Mobile-gaming throughput on AIS’s 5G network doubled between 2023-2024, surpassing 2 PB per month. Ultra-high-definition video and network slicing for enterprise use cases necessitate edge nodes within 50 km of urban clusters, catalysing micro-regional capacity within the Thailand hyperscale data center market.
Eastern Economic Corridor (EEC) subsea-cable landings
CAT Telecom’s 9,400 km Asia Direct Cable links Thailand with China, Japan and Singapore, lowering international transit latency and cost by 30-40 %. Additional landing stations such as MOALEE in Rayong foster Thailand’s emergence as a regional data-transit gateway.
Restraints Impact Analysis*
| Restraint | (~) % Impact on CAGR Forecast | Geographic Relevance | Impact Timeline |
|---|---|---|---|
| Scarcity of RECs for large-scale green power | -2.8% | National industrial estates | Medium term (2-4 years) |
| Higher electricity tariffs vs. Malaysia and Vietnam | -3.4% | Bangkok metro | Short term (≤ 2 years) |
| Land-cost inflation in Bangkok metro | -1.9% | Bangkok CBD and suburbs | Short term (≤ 2 years) |
| Grid-curtailment risk during northern-drought season | -1.6% | Northern and central provinces | Short term (≤ 2 years) |
| Source: Mordor Intelligence | |||
Higher electricity tariffs erode regional competitiveness
Proposed tariff hikes of up to 44% increase operating costs for 24/7 facilities, narrowing cost differentials with Malaysia’s Penang corridor.[3]Reccessary, “Thailand considers electricity price increase of up to 44%,” RECCESSARY.COM. Operators respond by signing long-tenor renewable PPAs or locating in the EEC, where industrial rates are marginally lower.
Scarcity of renewable-energy certificates constrains green power access
Only 3,934 MW of renewable capacity is REC-eligible, insufficient for hyperscaler sustainability targets, inflating certificate prices and complicating 100 % green-power commitments.
*Our forecasts treat driver/restraint impacts as directional, not additive. The impact forecasts reflect baseline growth, mix effects, and variable interactions.
Segment Analysis
By Data Centre Type: Self-Build Dominance Faces Colocation Disruption
Self-build deployments capture 63% Thailand hyperscale data center market share in 2024. Hyperscalers choose bespoke designs with 40-140 kW per-rack densities to host AI training clusters. However, colocation’s 24.5% forecast CAGR signals a pivot toward capital-light expansion. Facilities offered by STT GDC provide liquid-cooled, GPU-ready halls that let cloud providers stage capacity while de-risking real-estate exposure.
Colocation suppliers shorten deployment lead times to under 12 months versus 20-24 months for greenfield self-builds, attractive for secondary regional nodes or latency-sensitive edge workloads. Hybrid “build-to-suit-then-lease-back” models are proliferating, enabling hyperscalers to shape specifications yet conserve balance-sheet flexibility, a trend that will continue to diversify the Thailand hyperscale data center market.


By Component: IT Infrastructure Leads While DCIM/BMS Accelerates
IT infrastructure holds 45% of Thailand hyperscale data center market size in 2024, covering servers, storage and high-speed Ethernet fabrics. Demand escalates as operators transition from 100 G to 400/800 G interconnects for GPU clusters. DCIM/BMS solutions grow at 22.5% CAGR as AI-enabled platforms like Huawei NetEco 6000 cut PUE by 8% through predictive thermal optimisation.
Electrical equipment, particularly 2N UPS arrays and diesel rotary UPS systems, scales with power densities, while mechanical infrastructure adopts rear-door heat exchangers and immersive liquid cooling. Integrated monitoring across these components underpins operational resilience and drives opex efficiencies that enhance the competitiveness of the Thailand hyperscale data center market.
By Tier Standard: Tier III Dominance Shifts Toward Tier IV
Tier III sites comprise 75% of existing capacity, offering concurrent maintainability. Yet Tier IV development is forecast to grow 23.2% CAGR through 2030 as AI training costs exceed USD 10 million per model run, making downtime intolerable. True IDC’s alliance with SIAM.AI CLOUD includes a Tier IV facility designed for NVIDIA H100 clusters.
Tier IV architecture mandates 2N+1 power trains and fully fault-tolerant mechanical systems, raising CAPEX but delivering 99.995 % availability. Premium pricing and higher GPU utilisation rates offset incremental costs, making Tier IV attractive for BFSI, government, and critical AI workloads within the Thailand hyperscale data center market.
By End-User Industry: Cloud–IT Leadership Challenged by BFSI Growth
Cloud and IT users account for 50% of Thailand hyperscale data center market size, driven by sovereign regions from AWS and Google. BFSI workloads grow fastest at 23.1% CAGR as digital-banking regulations require local data residency and real-time analytics. Bank of Ayudhya leverages AWS services for fraud detection and regulatory reporting.
Telecom operators expand edge nodes for 5G network slicing, while media and entertainment companies demand high-bandwidth streaming infrastructure. Manufacturing embraces Industry 4.0 smart factories needing low-latency analytics, and the public sector drives adoption via cloud-first mandates, broadening the Thailand hyperscale data center market.

By Data Centre Size: Large Facilities Dominate While Mega-Scale Surges
Large facilities ≤ 25 MW held 54% market share in 2024. They remain popular for incremental expansion and diverse customer cohorts. Mega-scale campuses > 60 MW exhibit the highest growth (24.6% CAGR), led by Google’s Chonburi site and TikTok’s USD 8.8 billion nationwide plan.
Mega-scale projects leverage economies of scale for liquid-cooling plants and on-site 230 kV substations, lowering unitised CAPEX. The EEC provides land parcels with dual-grid feeds and proximity to submarine cables, making the corridor the epicentre of future mega-scale capacity in the Thailand hyperscale data center market.
Geography Analysis
Bangkok remains the primary node, hosting over 60% of operational capacity owing to carrier-dense exchanges and proximity to corporate headquarters. However, land prices escalated 75% between 2021-2024, with Q4 2022 alone registering a 12.5% YoY increase. These economics divert new builds toward the EEC, where BOI incentives, dual-feed power and multiple cable landings enable larger footprints. The EEC already anchors committed investments exceeding USD 4 billion from AWS, Google and Stratus Technology, underscoring its status in the Thailand hyperscale data center market.
Northern and central provinces such as Chiang Mai and Nakhon Ratchasima develop edge nodes that serve tourism and agri-tech sectors, reducing latency to under 15 ms for local applications. Cross-border terrestrial fibre routes to Laos and Cambodia further enhance Thailand’s appeal as an Indochina gateway. Nonetheless, grid-curtailment risks during drought seasons in the north necessitate redundant feeds and diesel reserves, prompting operators to integrate on-site solar plus battery storage.
Competitive pressures from Malaysia’s Johor corridor, offering electricity at 2.80-3.20 baht/kWh equivalent, challenge Thailand on power cost. Yet Thailand counters with lower submarine bandwidth pricing and political stability, which together with tax incentives maintain a balanced value proposition for hyperscale investors. Collectively, these dynamics sustain robust multi-regional growth within the Thailand hyperscale data center market.
Mordor Intelligence provides coverage of the hyperscale data center market across other key regional markets, including North America, Middle East, and Africa, each with their regulatory frameworks and demand patterns. Detailed country-level analysis extends to Singapore, Vietnam, United States, Saudi Arabia, South Africa, and China incorporating local coverage and market participation, as required.
Competitive Landscape
Global hyperscalers dominate strategic direction, but local incumbents wield strong regulatory and customer relationships. AWS’s region launch guarantees baseline demand that domestic players can leverage through managed-service ecosystems. Google’s AI-centric campus and Microsoft’s forthcoming region intensify competition for renewable power and skilled labour. True IDC, NTT GDC, and STT GDC respond by retrofitting facilities for liquid cooling and 800 G switching, ensuring technical parity within the Thailand hyperscale data center market.
Joint-venture models proliferate: Global Infrastructure Partners’ partnership with CP Group and True IDC injects international capital while preserving Thai ownership. Colocating telecom operators such as AIS-CSL exploits 5G edge requirements to bundle connectivity and compute. New entrants, including CoreWeave, seek GPU-focused capacity, potentially accelerating tier-IV conversions. The competitive battlefield shifts from pure space-and-power to AI service enablement, with providers embedding NVIDIA DGX-certified pods and Managed Kubernetes offerings.
Ongoing M&A and brownfield expansions are expected as capacity constraints tighten. Nevertheless, ample white-space opportunities persist in secondary metros and sector-specific clouds (healthcare and public-sector). Operators that balance price, sustainability and deployment velocity will capture outsized share of the Thailand hyperscale data center market.
Thailand Hyperscale Data Center Industry Leaders
STT GDC
Microsoft Corporation
Google Inc.
Amazon Web Services
Alibaba Cloud
- *Disclaimer: Major Players sorted in no particular order

Recent Industry Developments
- July 2025: NTT Data invested USD 90 million to open a cutting-edge Bangkok data centre, strengthening Southeast Asia’s digital backbone Technice.
- June 2025: BOI approved Stratus Technology’s USD 727 million project, adding >120 MW new capacity Reuters.
- May 2025: Baker McKenzie advised Global Infrastructure Partners on partnering with CP Group and True IDC for infrastructure upgrades Baker McKenzie.
- March 2025: The government cleared USD 2.7 billion of data-centre investments, including Beijing Haoyang’s 300 MW campus, Economic Times.


Research Methodology Framework and Report Scope
Market Definitions and Key Coverage
In this study, we define Thailand's hyperscale data center market as new server campuses that provide at least 10 MW of designed IT load and are owned or leased by global cloud or digital platforms, deploying advanced power, cooling, and interconnect systems to scale compute.
Scope Exclusions: Our coverage leaves out enterprise, edge, and colocation facilities below the 10 MW threshold.
Segmentation Overview
- By Data Centre Type
- Hyperscale Self-build
- Hyperscale Colocation
- By Component
- IT Infrastructure
- Server Infrastructure
- Storage Infrastructure
- Network Infrastructure
- Electrical Infrastructure
- PDUs
- Transfer Switches and Switchgears
- UPS Systems
- Generators
- Other Electrical Infrastructure
- Mechanical Infrastructure
- Cooling Systems
- Racks
- Other Mechanical Infrastructure
- General Construction
- Core and Shell Development
- Installation and Commissioning
- Design Engineering
- Fire-Detection, Suppression and Physical Security
- DCIM/BMS Solutions
- IT Infrastructure
- By Tier Standard
- Tier III
- Tier IV
- By End-User Industry
- Cloud and IT
- Telecom
- Media and Entertainment
- Government
- BFSI
- Manufacturing
- E-Commerce
- Other End Users
- By Data Centre Size
- Large ( Less than or equal to 25 MW)
- Massive (Greater than 25 MW and Less than equal to 60 MW)
- Mega (Greater than 60 MW)
Detailed Research Methodology and Data Validation
Primary Research
Our analysts held structured calls with hyperscaler construction managers, global design-build firms, local utilities, and colocation sales leaders in Bangkok, Chonburi, and Rayong. These conversations validated usable floor area, prevailing PUE, renewable procurement plans, and realistic ramp-up schedules that secondary data could not fully resolve.
Desk Research
During desk research, our Mordor analysts gathered official facts from the National Broadcasting and Telecommunications Commission, Board of Investment gazettes, Customs trade data, Energy Regulatory Commission load curves, and capacity trackers such as DC Byte, clarifying policy timelines, equipment imports, power tariffs, and site pipelines.
We then layered company 10-K filings, investor decks, press releases, and snapshots from D&B Hoovers and Dow Jones Factiva to cross-check investment amounts and commissioning dates. The listed names are illustrative, while many other open records strengthened the evidence base.
Market-Sizing & Forecasting
Mordor's model begins with a top-down capacity pool built from installed and announced megawatt figures, which is then adjusted for utilization and average service price to reach a revenue baseline for Thailand's hyperscale segment. A selective bottom-up roll-up of five large campuses keeps totals within observable limits.
Renewable tariff spreads, power-purchase agreement uptake, metro fiber density, land cost inflation, and rack energy density feed a multivariate regression that projects demand through the forecast period. Scenario analysis for fast AI workload growth versus conventional IT migration refines the final growth rate.
Data Validation & Update Cycle
Mordor Intelligence runs variance checks against BOI approvals, NBTC licenses, and electricity sales, then re-contacts sources when anomalies surface before sign-off. The model refreshes each year, with interim updates after material events, so clients always receive the latest view.
Why Mordor's Thailand Hyperscale Data Center Baseline Commands Reliability
Published estimates often diverge because some firms mix hyperscale, colocation, and enterprise revenue, apply different price ladders, or update irregularly. We outline these contrasts so buyers can see how our clearer definition, consistent variables, and annual refresh yield a steadier anchor.
Key gaps arise around whether self-built cloud campuses are counted, how capital outlay is converted to revenue, and which exchange rates are locked in. Our model uses on-the-ground billing insights, applies average yearly FX rates, and keeps a transparent workload mix.
Benchmark comparison
| Market Size | Anonymized source | Primary gap driver |
|---|---|---|
| USD 4.30 B (2025) | Mordor Intelligence | - |
| USD 1.56 B (2024) | Regional Consultancy A | Counts capital spend and blends enterprise with colocation |
| USD 1.15 B (2024) | Trade Journal B | Bundles all facility types and uses investment cost, not revenue |
| USD 0.65 B (2023) | Global Consultancy C | Excludes cloud self-build capacity and relies on limited public records |
Open report teasers quote 2024 values of USD 1.56 billion and USD 1.15 billion, while a 2023 analyst note cites USD 0.65 billion, underscoring the wide spread outside our baseline.
The comparison shows that once consistent scope, conversion logic, and refresh cadence are applied, Mordor's market view aligns with real cash flows and offers the most balanced middle path.


Key Questions Answered in the Report
How large is the Thailand hyperscale data center market in 2025?
The market is valued at USD 4.30 billion with 756.92 MW of installed IT load.
What CAGR is expected for the Thailand hyperscale data center market from 2025-2031?
The forecast CAGR is 22.39%, driving market size to USD 14.48 billion by 2031.
Which deployment model is growing fastest?
Hyperscaler colocation is projected to grow at a 24.5% CAGR through 2030.
Why is the EEC important for new facilities?
The EEC offers dual-grid power, subsea cable landings and BOI tax incentives, lowering total ownership costs and latency to regional markets.
What is the main cost challenge for operators?
Rising electricity tariffs—potentially up to 44%—erode Thailand’s cost advantage versus Malaysia and Vietnam, compelling direct renewable PPAs.
Which industry vertical is expanding quickest in demand?
A6. BFSI workloads lead with a 23.1% CAGR as digital-banking regulations require local data residency and high-reliability infrastructure.
Page last updated on:


