Indonesia Hyperscale Data Center Market Size and Share
Market Overview
| Study Period | 2019 - 2031 |
|---|---|
| Forecast Data Period | 2025 - 2031 |
| Historical Data Period | 2019 - 2023 |
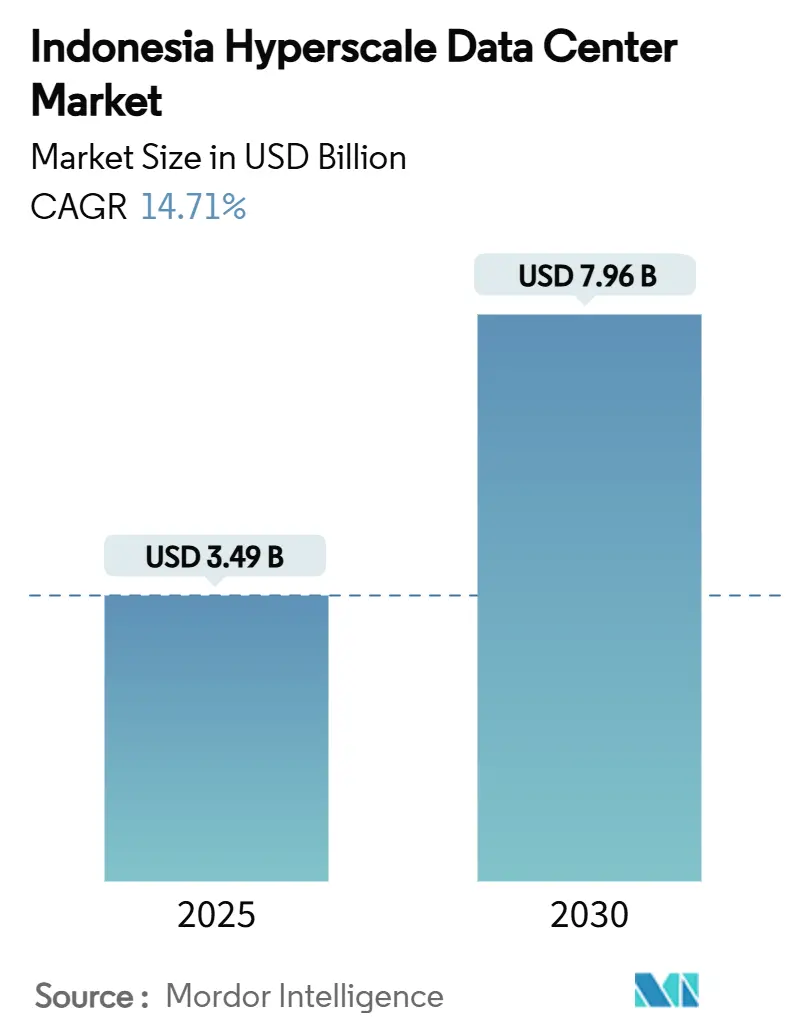
| Market Size (2025) | USD 3.49 Billion |
| Market Size (2030) | USD 7.96 Billion |
| Growth Rate (2025 - 2030) | 14.71% CAGR |
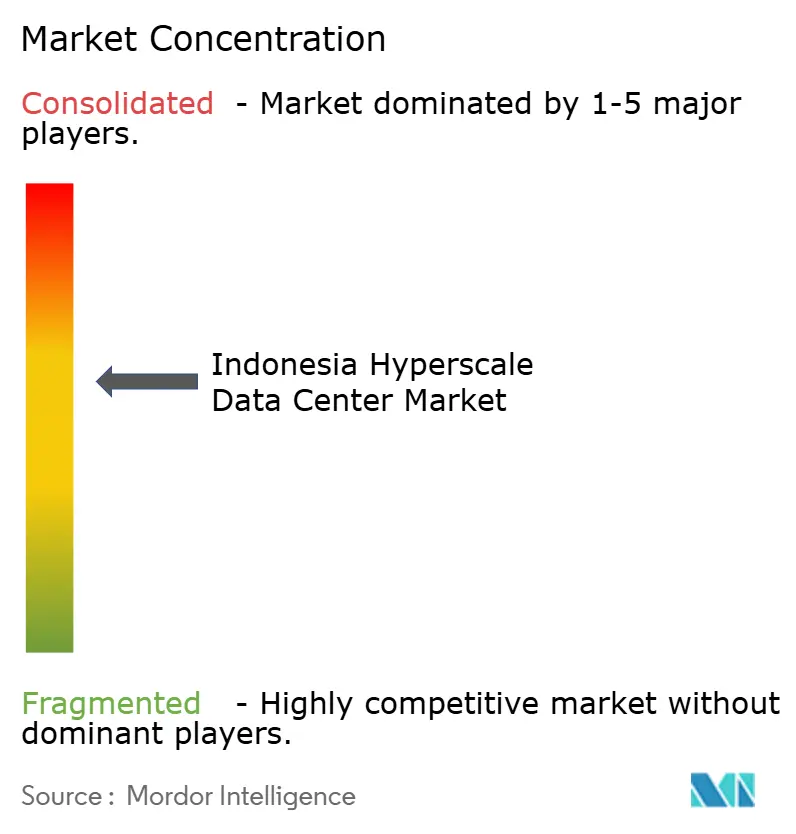
| Market Concentration | Medium |
Major Players *Disclaimer: Major Players sorted in no particular order Image © Mordor Intelligence. Reuse requires attribution under CC BY 4.0. | |
Indonesia Hyperscale Data Center Market Analysis by Mordor Intelligence
The Indonesia hyperscale data center market size reached USD 3.49 billion in 2025 and is projected to climb to USD 7.96 billion by 2031, advancing at a 14.71% CAGR. Parallel power capacity will scale from 1,074.86 MW to 2,992.42 MW at an even faster 18.61% CAGR, underscoring how higher-density, AI-ready racks lift economic value faster than physical footprint. Demand is amplified by “Making Indonesia 4.0” manufacturing digitalization, OTT video traffic that is rising above 35% a year, and BI-FAST real-time payments that oblige active-active Tier IV redundancy. Colocation remains dominant today, yet rapid self-build growth by hyperscalers illustrates an emergent two-tier market in which sovereign cloud estates coexist with multi-tenant halls. Supply expansion is now shifting to West Java as Greater Jakarta’s grid allocations above 200 MVA tighten, prompting operators to lock in renewable PPAs and liquid-cooling designs that match AI thermal loads.
Key Report Takeaways
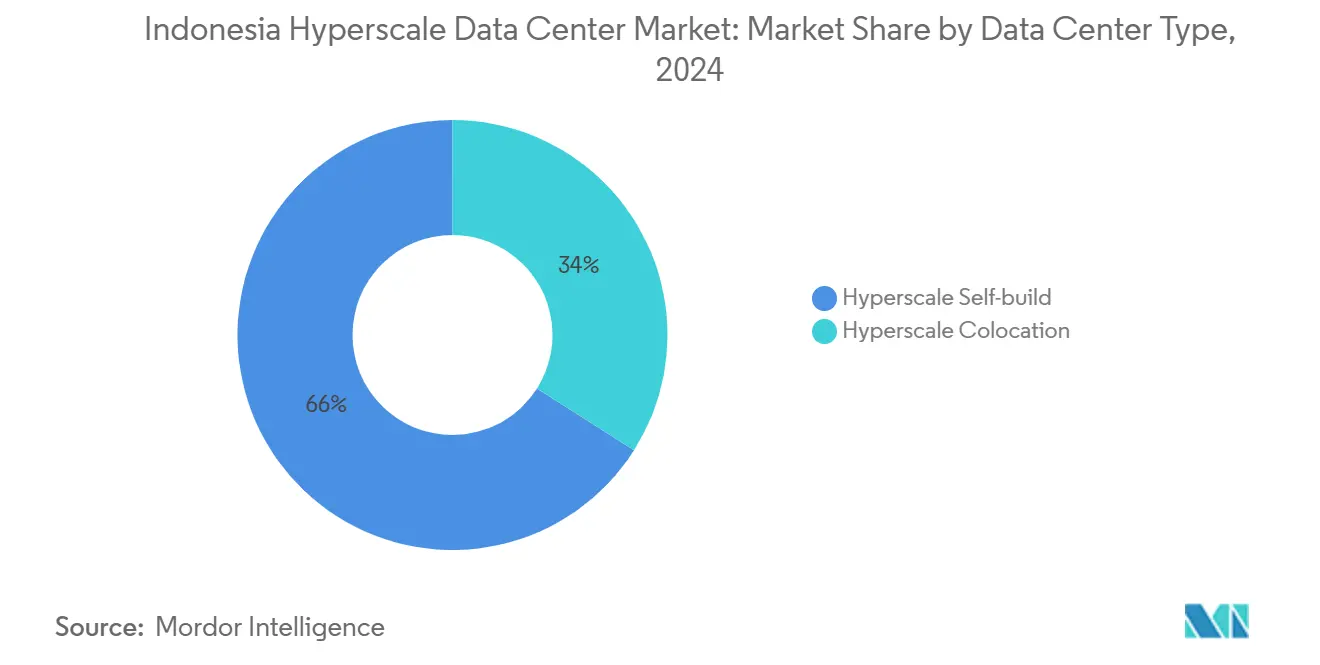
- By data center type, hyperscale colocation led with 66% of the Indonesia hyperscale data center market share in 2024; hyperscaler self-build facilities are forecast to expand at a 16.6% CAGR through 2030.
- By component, IT infrastructure accounted for 43% share of the Indonesia hyperscale data center market size in 2024, while liquid-cooling systems are advancing at a 15.1% CAGR through 2030.
- By tier standard, Tier III facilities held 75% share in 2024; Tier IV is the fastest-growing class at a 14.9% CAGR to 2030.
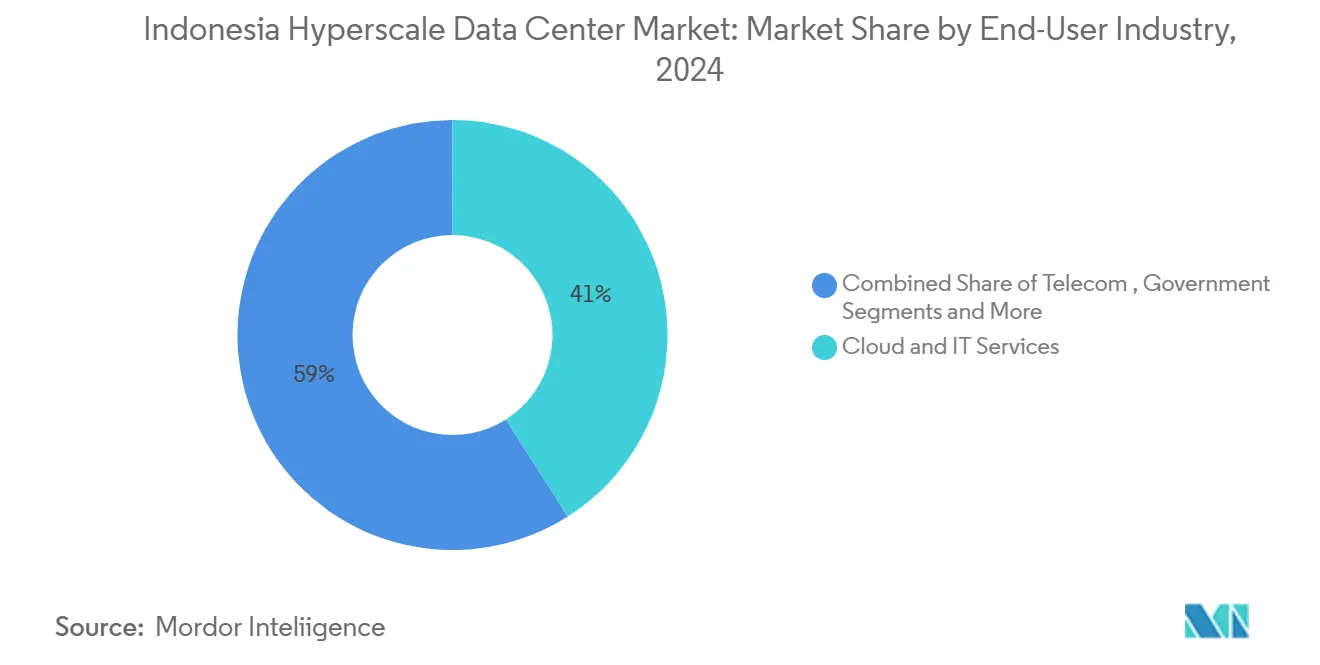
- By end-user industry, cloud and IT commanded 41% revenue in 2024; AI cloud providers are projected to grow at 15.3% CAGR through 2030.
- By data center size, massive campuses (25–60 MW) captured 57% share of the Indonesia hyperscale data center market in 2024, while mega sites (greater than 60 MW) are expanding at a 17.0% CAGR.
Anticipated developments are shaped at a system level, with Indonesia signals feeding into a larger global picture. The outlook on global hyperscale data center market consolidates these expectations.
Indonesia Hyperscale Data Center Market Trends and Insights
Drivers Impact Analysis*
| Driver | (~) % Impact on CAGR Forecast | Geographic Relevance | Impact Timeline |
|---|---|---|---|
| Making Indonesia 4.0 digital-industry push | +2.8% | National; Greater Jakarta and West Java | Medium term (2–4 years) |
| OTT video and e-commerce traffic >35% CAGR | +3.2% | Greater Jakarta, West Java, spreading to Central and East Java | Short term (≤2 years) |
| BI-FAST active-active Tier IV mandate | +2.1% | National priority in Greater Jakarta | Medium term (2–4 years) |
| PLN green-energy certificates for hyperscale PPAs | +1.9% | National; early use in Java and Sumatra | Long term (≥4 years) |
| Jakarta–Cibitung 50 kW rack substations | +1.8% | Greater Jakarta and West Java | Short term (≤2 years) |
| Nusantara AI-edge zones | +1.5% | Kalimantan and East Java spillover | Long term (≥4 years) |
| Source: Mordor Intelligence | |||
Government-backed “Making Indonesia 4.0” digital-industry push
Industrial policy is forcing factories to integrate real-time analytics and robotics, and those latency-sensitive workloads demand hyperscale edge sites located in Bekasi, Cikarang, and upcoming Nusantara zones.[1]PT PLN (Persero), “PLN Siapkan Listrik Bersih Layani Pertumbuhan Industri Data Center di Indonesia,” pln.co.id Targeted 80% manufacturing automation by 2030 creates line-of-sight demand for sub-10 ms latency racks that traditional enterprise rooms cannot deliver. PLN’s dedicated substations for 50 kW racks mirror this industrial shift and give the Indonesia hyperscale data center market fresh momentum outside Jakarta’s core. The government values the sector’s incremental USD 3.37 billion contribution to GDP, anchoring predictable capex cycles for operators. The manufacturing-centric pattern differentiates Indonesia from consumer-led peers and cements its role as Southeast Asia’s production data hub.
OTT video and e-commerce traffic surging greater than 35% CAGR
Bandwidth spikes from live-shopping streams and high-definition video catalogs are compressing traditional upgrade windows, compelling platforms such as Tokopedia to pre-book hyperscale capacity long before festivals or flash sales. Linguistic diversity across 17,000 islands pushes content providers toward distributed cache nodes that only the Indonesia hyperscale data center market can supply at scale. Live-shopping alone pushes peak bandwidth 16 times higher than static content, raising rack density and interconnect requirements.[2] Intel Corporation, “Tokopedia Supports Growing Userbase,” intel.com Operators therefore specify 400G and 800G leaf-spine fabrics as standard builds. The growth delta between traffic (35% CAGR) and legacy space adds lock-in for colocation suppliers that can deploy modular halls within 9–12 months.
National payment-switch (BI-FAST) mandating active-active Tier IV sites
Real-time payment finality inside one second necessitates zero-downtime computing, making Tier IV dual-path power and cooling compulsory for core banking applications.[3]Bank Indonesia, “BI-FAST News Release,” bi.go.id Financial institutions therefore provision at least two identically rated campuses within the Indonesia hyperscale data center market, usually in Jakarta and West Java, to satisfy active-active topology. The shift drives a structural uptick in high-end fit-out costs because facility-level redundancies replace equipment-level N+1 designs. BI-FAST also cascades into adjacent fintech and e-commerce ecosystems, multiplying underlying demand. As a result, Tier IV rack footprints are projected to rise faster than Tier III despite their higher capex per MW.
PLN green-energy certificates enabling hyperscale PPAs
State utility PLN now offers certified renewable power bundles for data center clients, removing the largest hurdle global cloud brands faced in meeting Scope 2 emissions targets. Its green hydrogen pilots and floating-solar arrays let large buyers lock in 10-year fixed prices, which protects op-ex and accelerates new build commitments. The framework positions the Indonesia hyperscale data center market as the first in Southeast Asia able to secure multi-hundred-MW green PPAs at scale, drawing hyperscalers that previously centered expansions in Singapore or Malaysia. Renewable supply reliability also helps operators gain environmental approvals in groundwater-restricted districts such as Bekasi.
Restraints Impact Analysis*
| Restraint | (~) % Impact on CAGR Forecast | Geographic Relevance | Impact Timeline |
|---|---|---|---|
| Scarcity of greater than 200 MVA grid allotments | –2.9% | Greater Jakarta and West Java | Short term (≤2 years) |
| Import-license delays for GPUs and optics | –1.8% | National hyperscale campuses | Medium term (2–4 years) |
| Ground-water extraction caps | –1.4% | Bekasi and Cikarang; Central Java expansion | Long term (≥4 years) |
| Carbon-pricing pilot on diesel backup >30 MW | –1.2% | National hyperscale sites | Medium term (2–4 years) |
| Source: Mordor Intelligence | |||
Scarcity of great than 200 MVA grid allotments in Greater Jakarta
Jakarta’s transmission backbone is near saturation, with data-center bookings forecast to absorb 2,200 MW by 2030, more than one-third of PLN’s incremental substation additions. Incumbents therefore secure multi-year reservations, leaving limited headroom for new entrants and pushing expansion toward Bekasi and Cikarang. The detour lifts land supply yet raises latency for Jakarta-centric apps, forcing operators to engineer new metro-connect dark-fiber rings that add capex. Artificial scarcity simultaneously lifts barrier-to-entry for the Indonesia hyperscale data center market, effectively rewarding early movers with pricing power and tenancy stickiness.
Import-license delays for GPUs and optics
High-end GPUs and 800G transceivers face 6-to-12-month import clearance under local content rules, lengthening AI cluster deployment timelines beyond customer demand windows. Larger operators mitigate by charter-freighting full container loads, but smaller entrants absorb the delay, losing share on AI projects. Hardware obsolescence risk rises because model-training chip generations advance every 18 months, making the licensing queue an operating-leverage drag on the Indonesia hyperscale data center industry. The bottleneck also discourages public-cloud operators from offering latest-generation AI accelerators locally until customs certainty improves.
*Our forecasts treat driver/restraint impacts as directional, not additive. The impact forecasts reflect baseline growth, mix effects, and variable interactions.
Segment Analysis
By Data Center Type: Colocation dominance drives market maturation
Colocation halls accounted for 66% of 2024 revenue within the Indonesia hyperscale data center market, mirroring enterprise preference for capex-light scaling and rapid on-demand provisioning. Sovereign cloud requirements, however, are fuelling a 16.6% CAGR in self-build footprints through 2030. Multi-tenant sites spread fixed infrastructure costs across diverse tenants, allowing e-commerce platforms to burst capacity during seasonal peaks without owning real estate. Conversely, self-build campuses by Microsoft and Google grant customised cooling envelopes and proprietary security layers essential for AI model training. Over the forecast window, hybrid deployment strategies will blend short-term colocation with longer-term dedicated builds, reinforcing two parallel growth tracks inside the broader Indonesia hyperscale data center market.
Colocation’s installed base already benefits from location concentration in metro-fiber zones, offering consistent <1 ms cross-connect latency. Self-build projects are increasingly sited on greenfield plots where 50 kW rack densities become baseline specification. Those densities tilt total cost of ownership toward immersion cooling and medium-voltage busway distribution, changing supplier mix in favour of liquid-cooling vendors. As government data-residency mandates tighten, hyperscalers are dual-tracking expansion plans to ensure fully Indonesian-owned legal entities hold land titles, an approach that adds corporate structuring complexity but unlocks large-scale capex budgets.


By Component: IT infrastructure leads while cooling innovation accelerates
Servers, storage, and network gear represented 43% of 2024 spending, reflecting AI accelerator bundles, DDR5 memory, and 400G optical fabrics now standard in hyperscale refresh cycles. Cooling technology is the fastest-advancing subsegment, expanding at 15.1% CAGR as rack thermal envelopes pass 70 kW. The Indonesia hyperscale data center market size for cooling equipment therefore climbs faster than for power distribution, and vendors have begun localising manufacturing for CDU and cold-plate assemblies. Electrical backbone demand remains robust because Tier IV dual-bus topologies require symmetric UPS chains, yet power transformers are now specified with on-load tap-changing to match renewable PPA variability. Immersion experiments using virgin coconut oil highlight domestic R&D that seeks to reduce dielectric fluid import dependence.
Liquid-cooling adoption is further bolstered by water-extraction caps in Bekasi that restrict traditional evaporative tower use. Operators offset by deploying closed-loop refrigerant-based systems coupled with heat-reuse to adjacent industrial estates. Storage infrastructure growth also ticks upward as data-sovereignty rules oblige in-country retention, lifting demand for high-density NVMe arrays. Combined, these trends preserve IT hardware share leadership while allowing mechanical systems to narrow the value gap throughout the forecast period.
By Tier Standard: Tier III dominance challenged by Tier IV growth
Tier III rooms commanded 75% of installed power in 2024 because their 99.982% availability matches most enterprise SLAs at cost points 30% below Tier IV build standards. Yet BI-FAST real-time payments and critical government workloads are pushing Tier IV demand to a 14.9% CAGR. Dual power and cooling paths plus continuous maintenance capability differentiate Tier IV, and those features carry higher capex per MW and longer approvals. The Indonesia hyperscale data center market size for Tier IV facilities will therefore outpace aggregate growth even though the absolute base remains smaller. Bank Rakyat Indonesia’s TCOS Gold certification provides a national benchmark and catalyses peer adoption, especially among regulated BFSI players that now treat downtime as regulatory breach rather than operational risk.
Tier III will retain volume leadership because price-sensitive SMEs and content platforms often deem short maintenance windows acceptable. Operators are responding by bundling Tier III space with layered software availability zones, effectively simulating Tier IV outcomes at lower facility cost. Nonetheless, financial regulators are unlikely to substitute software redundancy for physical diversity, meaning Tier IV penetration will edge upward every year of the forecast.
By End-User Industry: Cloud and IT leadership faces AI disruption
Cloud and IT workloads held 41% revenue in 2024, rooted in enterprise migrations and government e-service consolidation. AI cloud providers form the fastest-growing slice at 15.3% CAGR as Bahasa-centric LLMs require local GPU clusters for latency and data-sovereignty compliance. Telco-aligned data center subsidiaries leverage nationwide optical rings to cross-sell interconnects and regional edges. Media and entertainment workloads grow in parallel with 4K streaming localisation and now account for a mid-single-digit share of the Indonesia hyperscale data center market. Government agencies consolidate isolated data closets into sovereign cloud pods, enlarging public-sector share.
BFSI institutions expand capacity driven by real-time risk analytics, while manufacturers deploy edge nodes for predictive maintenance sensors on factory floors aligned with “Making Indonesia 4.0”. E-commerce giants adopt AI-based recommendation engines, which in turn demand high-density GPU racks. Across sectors, consumption models are evolving from static colocation cages to elastic power commitments that flex within a 20–50% band, prompting operators to integrate AI-driven capacity-planning software inside their DCIM stacks.

By Data Center Size: Massive facilities dominate while mega scale emerges
Sites sized 25–60 MW controlled 57% of power deployments in 2024 because they optimise balance between economy of scale and grid-connection feasibility. Mega campuses above 60 MW, however, will clock a 17.0% CAGR as PLN’s 500 KV backbone extensions come online. These mega builds allow single-tenant blocks for hyperscalers craving contiguous hall layouts and room for immersion baths. Large facilities below 25 MW remain relevant for enterprises wanting dedicated space without hyperscale complexity. The Indonesia hyperscale data center market size for mega projects will remain constrained by grid access near Jakarta, nudging developers to adopt distributed-mega strategy—multiple 70 MW parks rather than one >150 MW complex—to sidestep MVA caps.
Massive facilities today standardise on 12 MW build phases, enabling capital recycling every nine months when utilisation crosses 80%. They also suit modular utility pods that can be constructed in parallel on-site. Mega plots offer land cost efficiencies but increase cooling water sourcing challenges. Consequently, operators overlay onsite solar and battery farms to shave peak grid draw, reinforcing sustainability credentials demanded by cloud tenants.
Geography Analysis
Greater Jakarta remains the gravitational center of the Indonesia hyperscale data center market thanks to the capital’s 32 million populace and concentration of financial headquarters. Thirty-five operational projects were live by 2024, mostly clustered along outer-ring toll roads where land is cheaper but still within 20 km-latency of CBD applications. Power-allocation scarcity above 200 MVA, however, is driving the next wave of builds outward, especially into Bekasi and Cikarang. NTT’s USD 500 million Jakarta 3 complex in Cikarang typifies this push: close enough for metro latency yet outside transmission bottlenecks.
West Java’s Bekasi-Cikarang corridor benefits from PLN substations engineered for 50 kW racks, making it the favoured spillover zone for AI-dense halls. DCI Indonesia’s solar-assisted Karawang park exemplifies integration of renewable generation with hyperscale loads. Nonetheless, stricter groundwater-extraction caps compel adoption of dry coolers or closed-loop liquid systems, elevating mechanical capex. Skilled industrial labour, cultivated by decades of manufacturing activity, lowers operational risk for complex facilities relative to greenfield regions.
Kalimantan’s new capital, Nusantara, features pre-provisioned AI edge zones that include a 160-petabyte sovereign data center scheduled for 2025 commissioning. Although initial capacity is modest versus Java, the political will to diversify economic activity positions Kalimantan as a secondary hub within the broader Indonesia hyperscale data center market. Elsewhere, Central Java and East Java host smaller edge builds serving local manufacturing belts, while Sumatra and Sulawesi see early-stage deployments tied to telecom backbone upgrades. Archipelagic geography means latency-sensitive services will ultimately require distributed nodes despite scale efficiencies of Java megacampuses.
Mordor Intelligence delivers a comprehensive view of the hyperscale data center market across all major regions such as Europe, North America, and Middle East, alongside country-level analysis for Philippines, Singapore, United Kingdom, Canada, Israel, and Japan, each offering a view of the local market realities.
Competitive Landscape
Market share is dispersed the largest operator controls <15% reflecting a moderate-fragmentation profile for the Indonesia hyperscale data center market. Local incumbents such as DCI Indonesia and Telkom’s NeutraDC leverage long-standing PLN relationships and government insight to lock in early power reservations. Global players like STT GDC and Princeton Digital Group import design templates and cheaper capital, accelerating build timelines. Secure grid allocations have emerged as the decisive barrier to entry, eclipsing land cost or construction prowess.
Strategic differentiation is tilting toward AI readiness. BDx is rolling out a 500 MW renewable-powered AI campus with 120 kW racks, while EdgeConneX tripled Jakarta capacity to 200 MW to host multi-tenant GPU clusters. Sustainability positioning further splits the field: operators who commit to 100% renewable PPAs win long-term hyperscaler anchor tenants. Modular construction using prefabricated skids cuts deployment cycles to 12 months, an advantage exploited by Microsoft’s regional USD 1.7 billion program earmarked partly for Indonesia.
Consolidation pressure is mounting because AI-ready builds now surpass USD 500 million per site. IOH’s USD 170 million asset sale to BDx in 2024 illustrates how smaller telcos monetise data center units to fund network expansions. Over the forecast horizon, private-equity backed roll-ups are likely as investors seek scale to achieve procurement discounts on GPUs and power equipment. The Indonesia hyperscale data center industry therefore pivots from real-estate focus to full-stack infrastructure provider model, emphasising design-build-operate capabilities.
Indonesia Hyperscale Data Center Industry Leaders
Amazon Web Services
PT DCI Indonesia Tbk.
Google Cloud
Microsoft Azure
Alibaba Cloud
- *Disclaimer: Major Players sorted in no particular order

Recent Industry Developments
- January 2025: Microsoft announced USD 80 billion global AI data-center plan, allocating part of its USD 1.7 billion Southeast Asia commitment to Indonesia
- January 2025: National Data Center in Cikarang targeted for March 2025 go-live with 160 PB storage
- December 2024: EdgeConneX expanded its Jakarta campus to 200 MW following a 45,000 m² land purchase.
- November 2024: Telkom Indonesia opened a Yogyakarta facility to extend reach beyond Java’s primary metro.


Research Methodology Framework and Report Scope
Market Definitions and Key Coverage
According to Mordor Intelligence, the Indonesia hyperscale data center market comprises all newly built or colocation facilities engineered to deliver >=4 MW of contiguous IT load, run on modular x86 server architecture, and equipped for high-density racks, advanced cooling, and multi-terabit connectivity. Values reflect annual gross revenue from hyperscale self-build campuses and wholesale colocation halls operating inside Indonesia's borders.
Scope exclusion: Edge, enterprise, micro, and overseas cloud POPs are outside this study.
Segmentation Overview
- By Data Center Type
- Hyperscale Self-build
- Hyperscale Colocation
- By Component
- IT Infrastructure
- Server Infrastructure
- Storage Infrastructure
- Network Infrastructure
- Electrical Infrastructure
- Power Distribution Units
- Transfer Switches and Switchgear
- UPS Systems
- Generators
- Other Electrical Infrastructure
- Mechanical Infrastructure
- Cooling Systems
- Racks
- Other Mechanical Infrastructure
- General Construction
- Core and Shell Development
- Installation and Commisioning Services
- Design Engineering
- Fire Detection, Suppression and Physical Security
- DCIM/BMS Solutions
- IT Infrastructure
- By Tier Standard
- Tier III
- Tier IV
- By End User Industry
- Cloud and IT
- Telecom
- Media and Entertainment
- Government
- BFSI
- Manufacturing
- E-Commerce
- Other End Users
- By Data Center Size
- Large (Less than equal to 25 MW)
- Massive (Greater than 25 MW and less than equal to 60 MW)
- Mega (Greater than 60 MW)
Detailed Research Methodology and Data Validation
Primary Research
Multiple touchpoints with facility designers, power-equipment OEMs, Jakarta-Bekasi campus operators, and cloud procurement leads helped us confirm achievable rack densities, current fill ratios, and typical lease rates. Interviews covered Java, Batam, and Kalimantan to capture regional cost swings and expansion triggers.
Desk Research
Our analysts screened open-access sources such as Indonesia's Ministry of Communication & Informatics, PLN power-capacity releases, Telkom regulatory filings, BKPM investment statistics, and industry group data from ACEN and PUEI. Trade lanes and shipment counts were cross-checked through Volza, while hyperscaler landbank news was validated in Dow Jones Factiva feeds. These references provided baseline capacity, tariff, and project timelines; they are illustrative, not exhaustive.
Market-Sizing & Forecasting
A top-down production and trade build assessed commissioned MW, capex per MW, and prevailing wholesale rates before translating into revenue. Results were then validated through selective bottom-up cross-checks, sampled hyperscaler lease contracts, and supplier roll-ups to fine-tune totals. Key variables include grid connection lead time, median price per kW per month, liquid-cooling penetration, renewable PPA adoption, AI rack share, and Jakarta rack absorption curves. Multivariate regression, informed by expert consensus on each driver, yields the 2025-2031 forecast. Where campus-level data were incomplete, modeled averages from similar Tier III/IV builds filled gaps.
Data Validation & Update Cycle
Outputs pass anomaly scans versus independent MW trackers, PLN substation permits, and currency movements. A second analyst reviews every variance before sign-off. Reports refresh annually, with interim updates if policy shifts, grid constraints, or hyperscaler M&A materially alter the outlook.
Why Mordor's Indonesia Hyperscale Data Center Baseline Stands Firm
Published estimates often diverge because firms pick different facility types, revenue bases, and start years. Our disciplined bottom-up corroboration ensures each MW, lease term, and escalation clause lines up with on-ground reality.
Key gap drivers include some publishers treating total investment spend as revenue, others folding enterprise and edge halls into the tally, and several freezing exchange rates at contract signing rather than billing. Mordor's cadence of yearly refreshes and IT-load-weighted ASP modeling minimizes these skews.
Benchmark comparison
| Market Size | Anonymized source | Primary gap driver |
|---|---|---|
| USD 3.49 B (2025) | Mordor Intelligence | - |
| USD 2.39 B (2024) | Regional Consultancy A | Measures capex flows, omits ongoing lease revenue |
| USD 2.80 B (2024) | Trade Journal B | Blends enterprise, edge, and hyperscale; narrower geography |
| USD 2.14 B (2024) | Industry Association C | Uses average rack price only; excludes self-build campuses |
The comparison shows that, by anchoring scope strictly to >=4 MW hyperscale halls, applying revenue not spend metrics, and updating currency and price inputs yearly, Mordor Intelligence delivers a balanced, transparent baseline decision-makers can rely on.


Key Questions Answered in the Report
What is the current value of the Indonesia hyperscale data center market?
The market is valued at USD 3.49 billion in 2025 and is on track to reach USD 7.96 billion by 2031.
Which data-center type dominates Indonesia?
Colocation leads with 66% revenue share in 2024, though self-build campuses are growing at 16.6% CAGR.
Why is Tier IV demand accelerating?
BI-FAST real-time payments and zero-downtime banking applications require active-active facilities, lifting Tier IV growth to 14.9% CAGR.
How are power constraints shaping location strategy?
Scarcity of >200 MVA grid connections in Jakarta is pushing development to Bekasi and Cikarang where dedicated substations are being installed.
Which end-user vertical is expanding fastest?
AI cloud providers lead with a 15.3% CAGR, driven by sovereign AI models and local language processing needs.
What cooling technologies are gaining ground?
Liquid and immersion cooling systems are advancing at 15.1% CAGR as rack densities exceed 70 kW and water-use limits tighten.
Page last updated on:


