Asia Pacific Hyperscale Data Center Market Size and Share
Market Overview
| Study Period | 2019 - 2031 |
|---|---|
| Forecast Data Period | 2025 - 2031 |
| Historical Data Period | 2019 - 2023 |
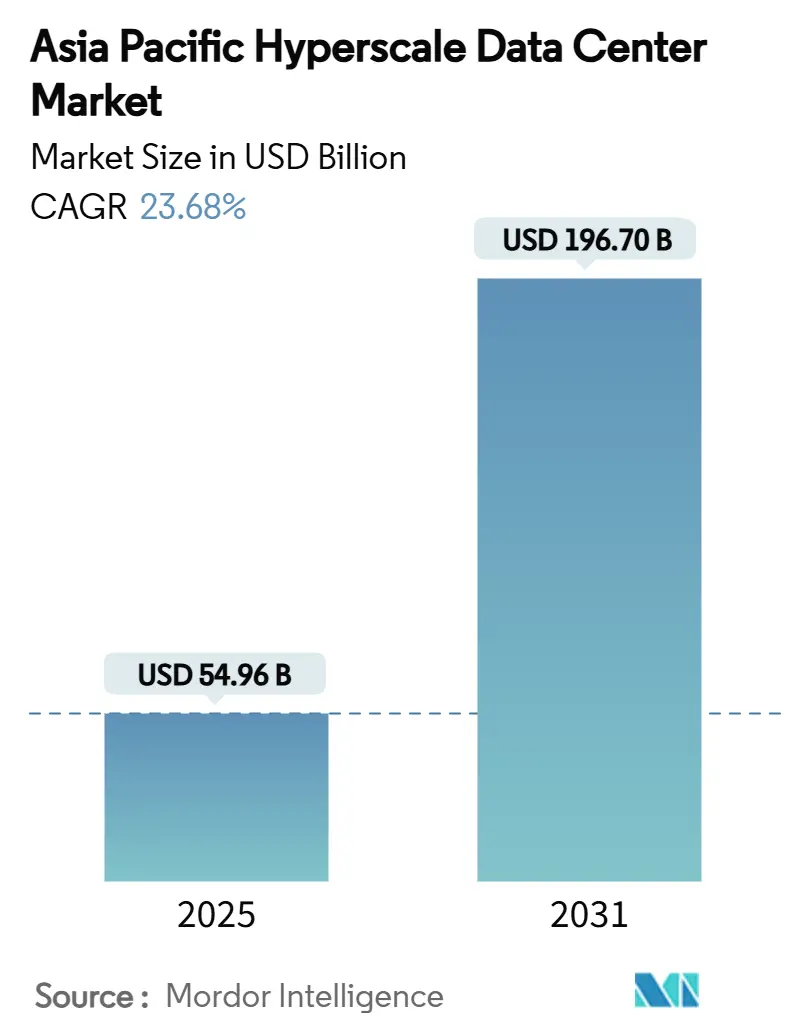
| Market Size (2025) | USD 54.96 Billion |
| Market Size (2030) | USD 196.70 Billion |
| Growth Rate (2025 - 2031) | 23.68% CAGR |
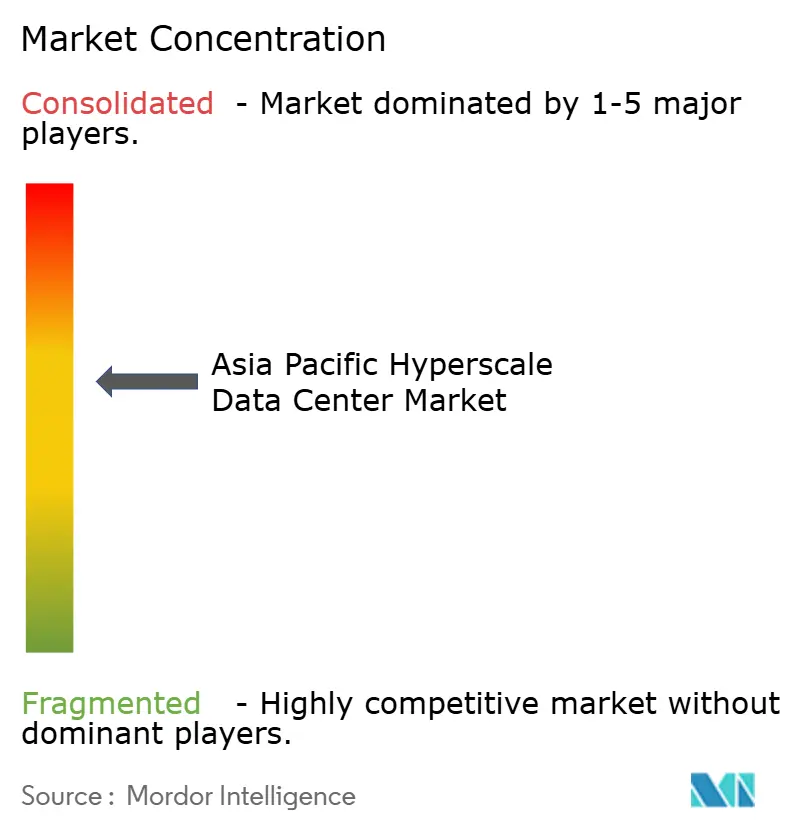
| Market Concentration | Medium |
Major Players *Disclaimer: Major Players sorted in no particular order Image © Mordor Intelligence. Reuse requires attribution under CC BY 4.0. | |
Asia Pacific Hyperscale Data Center Market Analysis by Mordor Intelligence
The Asia Pacific hyperscale data center market size stands at USD 54.96 billion in 2025 and is forecast to reach USD 196.70 billion by 2031, reflecting a 23.68% CAGR through the period. Capacity expands from 26,475.37 MW to 64,342.76 MW at a 15.95% CAGR, showing that operators pursue megawatt growth faster than revenue growth by reducing cost per megawatt through advanced power and cooling architectures. Rising sovereign-cloud mandates in India, Indonesia, and Malaysia, together with AI rack densities of 50–120 kW in China, Japan, and Australia, underpin sustained infrastructure investment. Grid connection constraints in Singapore and Tokyo redirect development toward secondary metros, while supply-chain bottlenecks for GPUs and 800 G optics extend build timelines, rewarding operators with secured component allocations. Liquid and immersion cooling adoption accelerates, and early pilots for small modular reactor (SMR) power purchase agreements emerge as competitive differentiators.
Key Report Takeaways
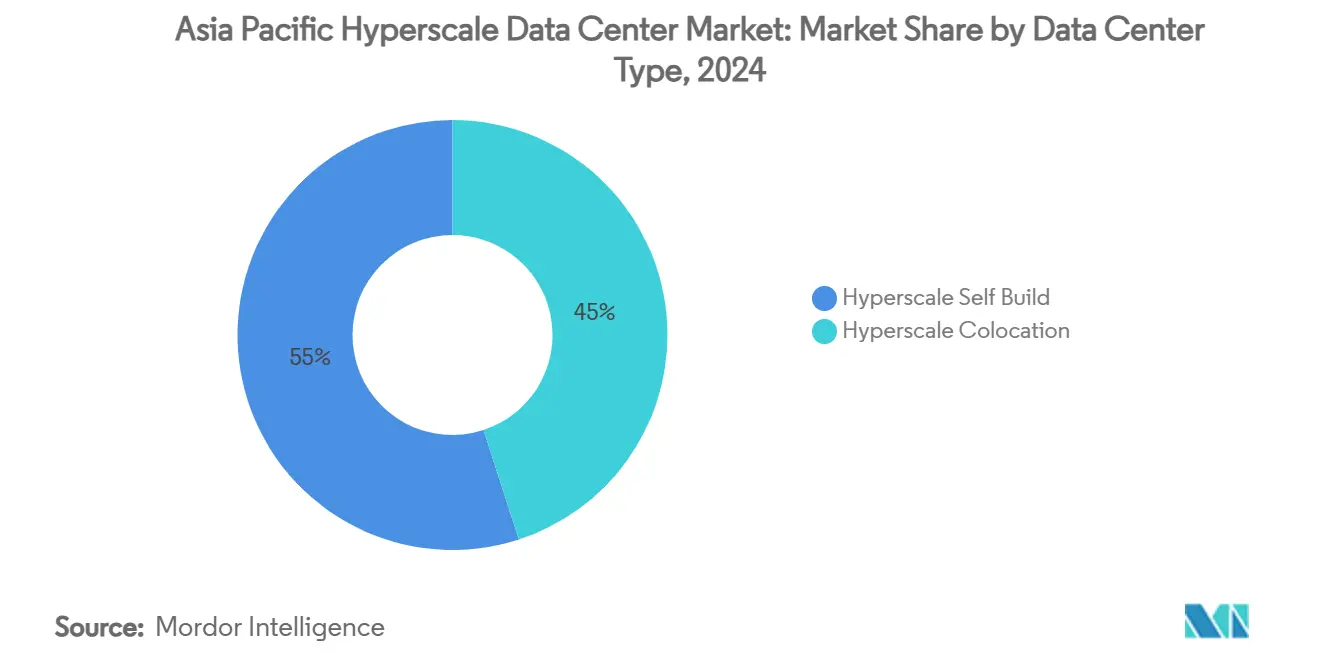
- By data center type, hyperscale self-build facilities held 55% revenue share in 2024, while hyperscale colocation is projected to grow at a 23.68% CAGR to 2030.
- By component, IT infrastructure accounted for 48% of the Asia Pacific hyperscale data center market share in 2024; mechanical infrastructure is advancing at a 24.80% CAGR through 2030.
- By tier standard, Tier III deployments represented 73% of the Asia Pacific hyperscale data center market size in 2024 and Tier IV is growing at a 25.00% CAGR through 2030.
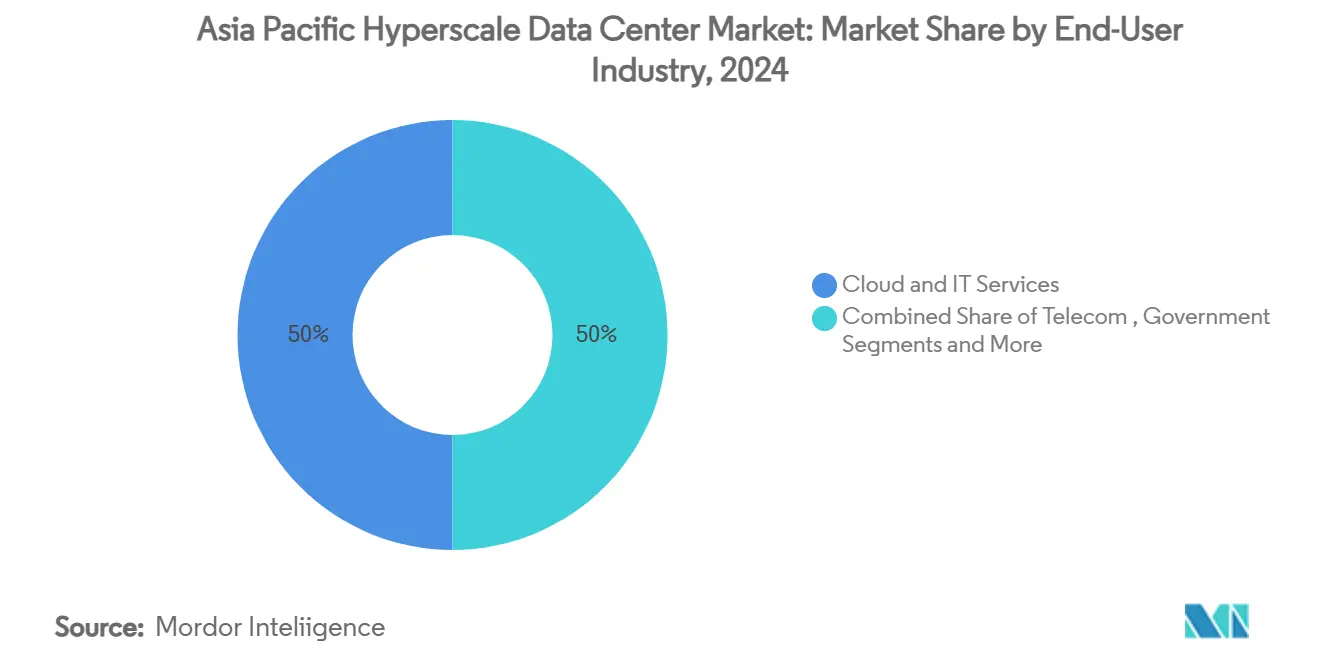
- By end-user industry, cloud and IT commanded 50% share of the Asia Pacific hyperscale data center market size in 2024, whereas e-commerce is expanding at a 24.60% CAGR through 2030.
- By data center size, massive facilities (25–60 MW) led with 45% of the Asia Pacific hyperscale data center market share in 2024, while mega campuses (>60 MW) are recording a 26.00% CAGR through 2030.
Country and region-specific signals from Asia align with patterns observed across other geographies. The global hyperscale data center market brings these into a unified structure.
Asia Pacific Hyperscale Data Center Market Trends and Insights
Drivers Impact Analysis*
| Driver | (~) % Impact on CAGR Forecast | Geographic Relevance | Impact Timeline |
|---|---|---|---|
| Cloud-AI power-density boom (50–120 kW racks) in China, Japan, Australia | +4.2% | China, Japan, Australia with spillover to South Korea | Medium term (2-4 years) |
| Sovereign-cloud mandates in India, Indonesia, Malaysia | +3.8% | India, Indonesia, Malaysia, with regulatory influence across ASEAN | Long term (≥ 4 years) |
| 5G edge-core consolidation spurring campus builds in Seoul and Bangkok | +2.1% | South Korea, Thailand, with expansion to Vietnam, Philippines | Short term (≤ 2 years) |
| Rapid shift to 400/800G optics lowering network $/bit | +1.9% | Global APAC with concentration in Singapore, Hong Kong hubs | Medium term (2-4 years) |
| Gen-AI inference campuses demanding liquid and immersion cooling | +3.5% | China, Japan, Australia, Singapore | Medium term (2-4 years) |
| Small-modular-reactor (SMR) pilot PPAs for hyperscalers | +1.2% | Australia, Japan, South Korea | Long term (≥ 4 years) |
| Source: Mordor Intelligence | |||
Cloud-AI Power-Density Boom Reshapes Infrastructure Economics
AI-optimized racks rising from 8–15 kW to 50–120 kW elevate power infrastructure from 25% to nearly 50% of capital expenditure, prompting liquid cooling adoption to reach 65% by 2027. SK Telecom and AWS are building a 100 MW AI facility in South Korea that exemplifies these economics.[1]Data Center Dynamics, “Building Hyperscale Data Centers in Asia,” datacenterdynamics.com Tencent’s Xingmai upgrade improved AI training efficiency by 20% while supporting 100,000 GPUs in single clusters. Operators with mature liquid and immersion cooling capture disproportionate demand as AI workloads proliferate. Mechanical system vendors benefit from the transition, and colocation providers lacking dense-rack capability risk losing market share.
Sovereign-Cloud Mandates Create Domestic Infrastructure Imperatives
India’s Digital Personal Data Protection Rules 2025, Indonesia’s localization regulations, and Malaysia’s investment incentives compel hyperscalers to build in-country facilities to comply with data sovereignty requirements.[2]Lexology, “Cross-Border Data Transfers Under India’s Proposed Data Protection Regime,” lexology.com AWS, Microsoft, and Google collectively committed billions to domestic campuses that anchor long-term demand. Vietnam’s decision to allow 100% foreign ownership accelerates similar dynamics across ASEAN, though operational frameworks still insist on local processing. These mandates increase capital intensity but secure steady revenue streams in each jurisdiction. Providers must navigate fragmented regulations and rising compliance costs while maintaining global service consistency.
5G Edge-Core Consolidation Drives Campus-Scale Deployments
The integration of 5G core functions with hyperscale compute lowers latency and supports real-time applications such as autonomous vehicles and industrial IoT. South Korea’s planned 3 GW data-center campus is structured around this convergence to serve metropolitan Seoul. In Thailand, STT GDC is expanding AI-enabled data centers to colocate edge clusters and cloud nodes within the same campus.[3]Bangkok Post, “STT GDC Ready for AI-Enabled Data Centre,” bangkokpost.com Government investment approvals totaling USD 2.7 billion reinforce confidence in the model. Operators that master integrated architectures gain competitive latency advantages, while pure core or pure edge strategies become less compelling.
Rapid 400 G/800 G Adoption Transforms Network Economics
Migration from 100 G to 400 G and 800 G Ethernet lifts per-rack throughput to 25.6 Tbps, slashing cost per bit and enabling larger AI clusters. Singapore’s submarine-cable hub status becomes strategically valuable as high-capacity optics aggregate regional traffic efficiently. Component shortages create delivery risk, but operators with secured optical inventory realize faster time-to-market. Advanced networking differentiates service performance and sets higher entry barriers for newcomers.
Restraints Impact Analysis*
| Restraint | (~) % Impact on CAGR Forecast | Geographic Relevance | Impact Timeline |
|---|---|---|---|
| Tight GPU/optics supply chain extending go-live cycles | -2.8% | Global APAC with severe impact in China, Japan, Australia | Short term (≤ 2 years) |
| Grid-connection moratoria in Singapore and Tokyo | -1.9% | Singapore, Tokyo with spillover effects to Hong Kong | Medium term (2-4 years) |
| Water-stress curbs on evaporative cooling in Northern China | -1.4% | Northern China with expansion to water-scarce regions | Long term (≥ 4 years) |
| Local "heat-tax" surcharges in Amsterdam-style zones of Sydney | -0.8% | Australia with potential expansion to urban centers | Medium term (2-4 years) |
| Source: Mordor Intelligence | |||
GPU Supply-Chain Bottlenecks Extend Project Timelines
TSMC’s CoWoS packaging constraints throttle NVIDIA H100/H200 supply, pushing Asia Pacific hyperscale data center market go-live schedules out by 6–12 months. Chinese operators reliant on domestically available chips optimize software to extract more performance, as illustrated by Tencent’s 60% network efficiency gain. Smaller providers lacking direct chip allocations face capital-cost overruns and may exit or merge, accelerating market consolidation. Early movers with secured GPU volume gain pricing power and tenant preference.
Grid-Connection Moratoria Force Distributed Architectures
Singapore capped new builds above 80 MW, and Tokyo imposed similar curbs, compelling operators to distribute capacity across Malaysia, Thailand, and Indonesia. Artificial scarcity inflates land and power premiums in mature hubs, while secondary markets enjoy inbound investment and job creation. Multi-region clusters increase network complexity and drive demand for 400 G backhaul links. Providers adopting modular designs can shift capacity faster than those with monolithic campus plans.
*Our forecasts treat driver/restraint impacts as directional, not additive. The impact forecasts reflect baseline growth, mix effects, and variable interactions.
Segment Analysis
By Data Center Type: Self-Build Retains Scale Advantage, Colocation Gains Momentum
Revenue leadership stays with self-build facilities, which commanded 55% of the Asia Pacific hyperscale data center market in 2024. Hyperscalers design bespoke power trains and cooling loops that align precisely with GPU rack densities, lowering long-run opex. AWS’s USD 13 billion Australian program illustrates the economic logic of vertical integration.
Hyperscale colocation, however, grows at 23.68% CAGR as smaller cloud providers and SaaS firms prefer faster deployment and lower upfront capital. The Asia Pacific hyperscale data center market size attributed to colocation is projected to exceed USD 70 billion by 2031, reflecting expanding tenant diversity. Digital Realty’s Jakarta and Tokyo expansions showcase the model’s appeal. Operators that provide dense power pods and low-latency cross-connects capture outsized demand


By Component: Mechanical Infrastructure Surges Ahead of IT Spend
IT infrastructure still contributed 48% of the Asia Pacific hyperscale data center market value in 2024, driven by GPU clusters priced at USD 10–15 million per rack. Server, storage, and network refresh cycles align with AI roadmap timelines, keeping spend elevated.
Mechanical infrastructure expands at a 24.80% CAGR because liquid and immersion cooling systems shift from pilot to mainstream, particularly in China and Japan. The Asia Pacific hyperscale data center market share for liquid cooling is expected to pass 30% by 2028, bringing chiller-less designs into the mainstream. Vendors offering closed-loop immersion tanks and rear-door heat-exchangers secure multi-year contracts, while electrical infrastructure maintains steady growth on the back of higher UPS redundancy levels.
By Tier Standard: Tier IV Gains as Critical Workloads Rise
Tier III configurations represented 73% of deployments in 2024, providing acceptable 99.982% uptime for most SaaS and e-commerce tasks. They remain cost-balanced solutions in numerous emerging markets.
Tier IV facilities post a 25.00% CAGR as financial services, government, and healthcare workloads move to cloud platforms. The Asia Pacific hyperscale data center market size earmarked for Tier IV is forecast to triple by 2030. DBS Bank’s migration to cloud illustrates rising appetite for zero-downtime architectures. Operators commit to 2N+1 redundant power chains, dramatically raising mechanical and electrical bill-of-materials.
By End-User Industry: E-Commerce Outpaces Cloud Baseline
Cloud and IT tenants held a 50% share of the Asia Pacific hyperscale data center market size in 2024. Hyperscalers continue to anchor anchor-tenant economics, leasing or building multiple-megawatt blocks.
E-commerce drives the fastest growth at 24.60% CAGR as Southeast Asia’s digital-commerce GMV scales. Alibaba Cloud’s regional expansion is orchestrated to serve cross-border merchants. BFSI accelerates cloud adoption for fraud analytics, while telecom carriers embed edge nodes for 5G slicing. Media-streaming growth supports GPU-based transcode clusters, widening tenant diversity.
By Data Center Size: Mega Campuses Command Investment Spotlight
Massive facilities between 25 MW and 60 MW owned 45% share of the Asia Pacific hyperscale data center market in 2024, balancing scale with deployment flexibility.
Mega campuses above 60 MW rise at 26.00% CAGR, reflecting operator preference for consolidated AI compute farms. The Asia Pacific hyperscale data center market size for mega campuses is set to surpass USD 90 billion by 2031. South Korea’s planned 3 GW complex exemplifies extreme consolidation. Edge-scale builds under 25 MW remain crucial for latency-sensitive workloads yet lose relative share as hyperscalers chase power economies.
Geography Analysia
China retained its lead share in the Asia Pacific hyperscale data center market during 2024 as Alibaba Cloud, Tencent Cloud, and Baidu scaled domestic infrastructure to serve the world’s largest internet base. National cloud spending reached USD 40 billion in 2024 and is set to grow 15% in 2025, propelled by manufacturing and government AI adoption. Water-stress restrictions in Northern provinces accelerate air and immersion cooling uptake, increasing capital costs yet stabilizing operational risk. China’s launch of AI-enabled satellites hints at off-planet compute alternatives that could relieve terrestrial grid pressure.
India delivers the fastest CAGR through 2030 as sovereign-cloud mandates force domestic builds. AWS’s USD 4.4 billion commitment and Microsoft’s facility pipeline underline appetite for capacity. IBM’s new AI software lab in Lucknow feeds a talent pool that further reduces operational cost. Infrastructure challenges remain around grid reliability, but central and state incentives support power and land acquisition.
Singapore stays the interconnection nucleus despite a moratorium on large projects. Existing sites command premium pricing, and vertical designs such as Meta’s 150 MW tower maximize constrained footprints. Guidelines issued by IMDA enhance cybersecurity and continuity standards, reinforcing confidence. Capacity spillovers fuel investment booms in Malaysia, Thailand, and Vietnam, where land and power remain abundant.
Competitive Landscape
The Asia Pacific hyperscale data center market remains moderately consolidated: the ten largest operators control roughly 60% of deployed capacity. AWS, Microsoft, and Google leverage deep capital reserves, advanced AI service stacks, and global procurement reach to sustain leadership. Regional specialists such as NTT GDC, STT GDC, and AirTrunk exploit local relationships and regulatory fluency to win government and enterprise workloads. Operators increasingly differentiate through technology rather than sheer footprint, prioritizing liquid cooling, renewable PPAs, and SMR pilots.
White-space potential emerges in secondary metros where power grids possess idle capacity. Digital Edge DC pursues this avenue, securing land in Indonesia and the Philippines to pre-empt hyperscaler demand. Chinese colocation firms eye overseas expansion as domestic constraints tighten, while niche AI-infrastructure startups design GPU-dense modular blocks for inference workloads. Oracle’s network-optimized architecture wins AI cloud contracts, evidencing that targeted performance advantages can upend scale hierarchies.
Supply-chain shocks favor incumbents holding long-term GPU and optics allocations. Smaller players struggle with 6-12-month lead-time variability and may accept higher leasing costs or mergers. The Asia Pacific hyperscale data center market therefore trends toward higher concentration, but regulatory diversity and rapid demand growth leave room for agile challengers that master specialized niches.
Asia Pacific Hyperscale Data Center Industry Leaders
Amazon Web Services Inc.
Microsoft Corporation
Google LLC
Alibaba Cloud
Equinix Inc.
- *Disclaimer: Major Players sorted in no particular order

Recent Industry Developments
- July 2025: Meta announced a multi-gigawatt AI data-center strategy, starting with a 1 GW Prometheus campus and a 5 GW Hyperion build-out.
- July 2025: Vietnam’s CMC secured approval for a USD 250 million hyperscale data center.
- June 2025: China launched 12 AI-enabled satellites forming the “Three-Body Computing Constellation.”
- March 2025: Thailand approved USD 2.7 billion in data-center and cloud investments, including a 300 MW facility by Haoyang Cloud and Data.


Research Methodology Framework and Report Scope
Market Definitions and Key Coverage
Our study treats the Asia-Pacific hyperscale data center market as all purpose-built or colocation facilities that provision at least 10 MW of critical IT load and exceed roughly 500 racks, covering both self-build and leased hyperscale halls plus the full stack of IT, electrical, mechanical, and general construction spend captured in US dollar terms.
Scope Exclusion: Edge or enterprise data centers below 10 MW and pure cloud software revenues are outside this scope.
Segmentation Overview
- By Data Centre Type
- Hyperscale Self-build
- Hyperscale Colocation
- By Component
- IT Infrastructure
- Server Infrastructure
- Storage Infrastructure
- Network Infrastructure
- Electrical Infrastructure
- Power Distribution Units
- Transfer Switches and Switchgear
- UPS Systems
- Generators
- Other Electrical Infrastructure
- Mechanical Infrastructure
- Cooling Systems
- Racks
- Other Mechanical Infrastructure
- General Construction
- Core and Shell Development
- Installation and Commissioning
- Design Engineering
- Fire, Security and HSE Systems
- DCIM / BMS Solutions
- IT Infrastructure
- By Tier Standard
- Tier III
- Tier IV
- By End-user Industry
- Cloud and IT
- Telecom
- Media and Entertainment
- Government
- BFSI
- Manufacturing
- E-Commerce
- Other End Users
- By Data Centre Size
- Large ( Less than or equal to 25 MW)
- Massive (Greater than 25 MW and Less than equal to 60 MW)
- Mega (Greater than 60 MW)
- By Geography
- China
- India
- Singapore
- Japan
- Australia
- South Korea
- Indonesia
- Malaysia
- Thailand
- Vietnam
- Philippines
- Rest of Asia Pacific
Detailed Research Methodology and Data Validation
Primary Research
Mordor analysts held structured calls with data-center developers, utility consultants, cloud architects, and regional construction contractors across China, India, Japan, and Southeast Asia. Insights on average build cost per MW, ramp-up lags, and occupancy triggers informed the calibrations and reconciled secondary discrepancies.
Desk Research
We began with telecom regulator capacity filings, customs shipment tallies for servers and PDUs (Volza), and national statistics from the ITU, World Bank, and Singapore's IMDA, which together framed installed base and power connectivity. Policy white papers from China's MIIT and Australia's Digital Economy Strategy clarified pipeline incentives, while DataCenterMap listings and patent counts (Questel) helped map operator footprints. D&B Hoovers and Dow Jones Factiva contributed company revenue splits to benchmark colocation versus self-build ratios. These sources are illustrative; many additional references were reviewed for gap closing and validation.
Market-Sizing & Forecasting
A top-down capacity-to-value model anchors the baseline. Regional installed MW and announced hyperscale pipelines are multiplied by averaged build plus IT equipment cost curves, then adjusted for utilization and phased commissioning. Select bottom-up checks, sampled supplier roll-ups and rack-level ASP × volume audits, temper outliers before totals are locked. Key drivers in the model include grid power tariffs, cloud service penetration, 5G subscriber additions, average rack density (kW), renewable-energy mandates, and land acquisition timelines. Forecasts to 2031 apply multivariate regression blended with scenario analysis, using these variables' consensus trajectories from both desk data and expert panels. Where bottom-up evidence is thin, confidence bands guide proportional weighting rather than force-fitted estimates.
Data Validation & Update Cycle
Outputs face deviation flags against independent capacity trackers and quarterly capex disclosures; material variances prompt reruns. Every report is refreshed annually, with interim updates when large-scale deals or regulatory shifts break prior assumptions, and a final pre-publication audit ensures clients receive the newest view.
Why Mordor's Asia Pacific Hyperscale Data Center Baseline Earns Trust
Published numbers differ because firms mix revenue versus capex scopes, roll in edge sites, or stretch global splits across regions.
By anchoring on commissioned MW, verified build costs, and a frequent refresh cadence, Mordor minimizes these skews.
Benchmark comparison
| Market Size | Anonymized source | Primary gap driver |
|---|---|---|
| USD 54.96 B (2025) | Mordor Intelligence | - |
| USD 5.43 B (2024) | Regional Consultancy A | Hardware revenue only; omits construction and emerging markets, limited forecast horizon |
| USD 106.7 B (2025) | Trade Journal B | Blends hyperscale with broader cloud infrastructure, unclear double-count adjustments, scope not country-specific |
The comparison shows how varying scope, input depth, and refresh frequency can swing totals by an order of magnitude. Mordor's disciplined capacity-linked model offers a balanced, transparent baseline clients can replicate and trust.


Key Questions Answered in the Report
What is the projected size of the Asia Pacific hyperscale data center market by 2031?
The market is expected to reach USD 196,707.54 million by 2031 at a 23.68% CAGR.
Which data-center type is growing fastest in the region?
Hyperscale colocation is expanding at a 23.68% CAGR through 2030 as smaller cloud providers seek quick, capital-light deployments.
Why are liquid and immersion cooling systems gaining traction?
AI rack densities of 50–120 kW make traditional air cooling insufficient, pushing liquid and immersion solutions that improve thermal efficiency and reduce operating costs.
How do sovereign-cloud mandates influence market growth?
Data localization laws in India, Indonesia, and Malaysia compel hyperscalers to build domestic facilities, creating captive demand and driving new investment.
What challenges do operators face in mature hubs like Singapore?
Grid-connection caps and land scarcity limit new large-scale builds, prompting distributed architectures and driving up costs for remaining capacity.
Which industry vertical shows the fastest capacity demand?
E-commerce workloads lead with a 24.60% CAGR through 2030, fueled by Southeast Asia’s rapid digital-commerce expansion.
Page last updated on:


