Thailand Data Center Market Size and Share
Market Overview
| Study Period | 2020 - 2031 |
|---|---|
| Forecast Data Period | 2026 - 2031 |
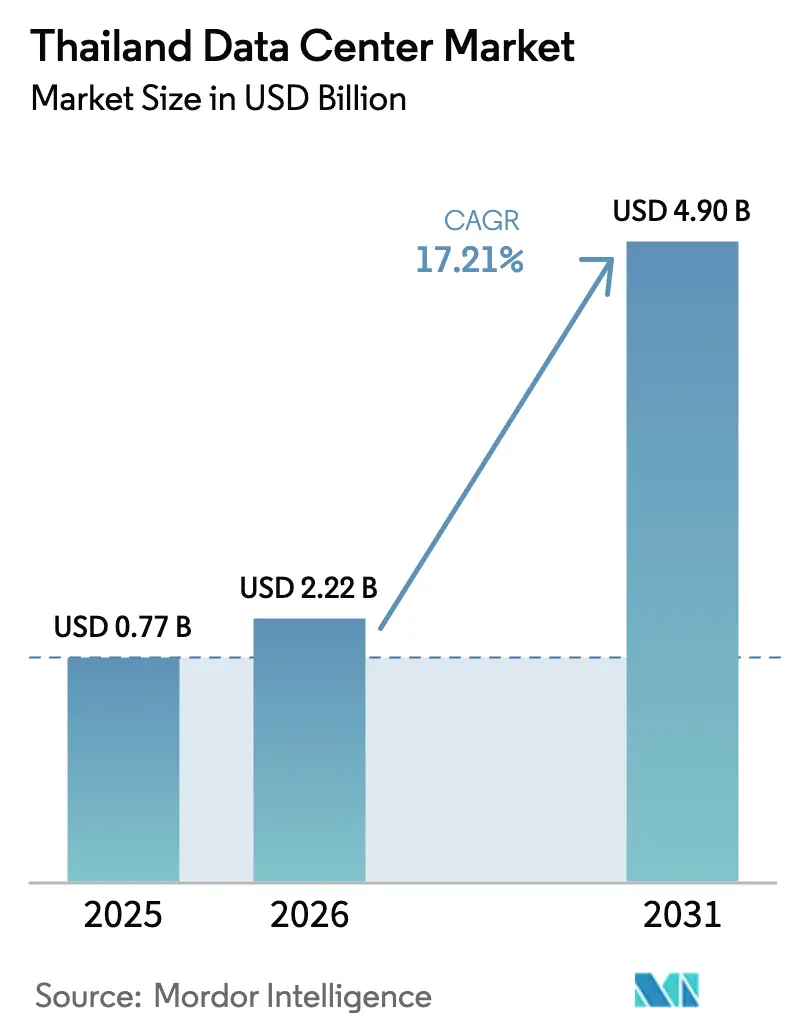
| Base Year Market Size (2025) | USD 0.77 Billion |
| Market Size (2026) | USD 2.22 Billion |
| Market Size (2031) | USD 4.9 Billion |
| Growth Rate (2026 - 2031) | 17.21% CAGR |
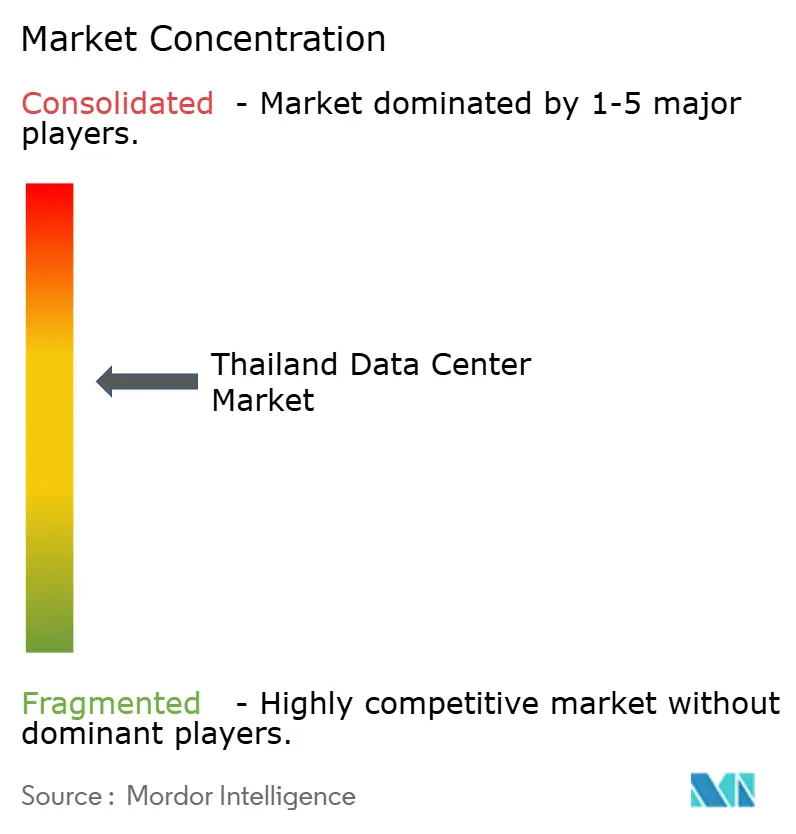
| Market Concentration | Medium |
Major Players*Disclaimer: Major Players sorted in no particular order Image © Mordor Intelligence. Reuse requires attribution under CC BY 4.0. | |
Thailand Data Center Market Analysis by Mordor Intelligence
The Thailand Data Center Market size was valued at USD 1.89 billion in 2025 and estimated to grow from USD 2.22 billion in 2026 to reach USD 4.9 billion by 2031, at a CAGR of 17.21% during the forecast period (2026-2031). In terms of market size, the market is expected to grow from 0.77 thousand megawatt in 2025 to 2.93 thousand megawatt by 2030, at a CAGR of 30.60% during the forecast period (2025-2030). The market segment shares and estimates are calculated and reported in terms of MW. Hyperscaler capital commitments, Thailand 4.0 policy incentives, and aggressive submarine-cable builds underpin the expansion, while grid modernization and progressive renewable-energy purchase rules sustain operator confidence. Enterprise cloud migration accelerated AI adoption, and edge buildouts in the Eastern Economic Corridor (EEC) further strengthen demand. Competition intensifies as global platforms enter, spurring facility upgrades in rack density, liquid cooling, and carrier-neutral interconnection.[1]ST Telemedia Global Data Centres, “ST Telemedia Global Data Centres Announces Availability of AI-Ready Data Centres Across Southeast Asia,” sttelemediagdc.com
Key Report Takeaways
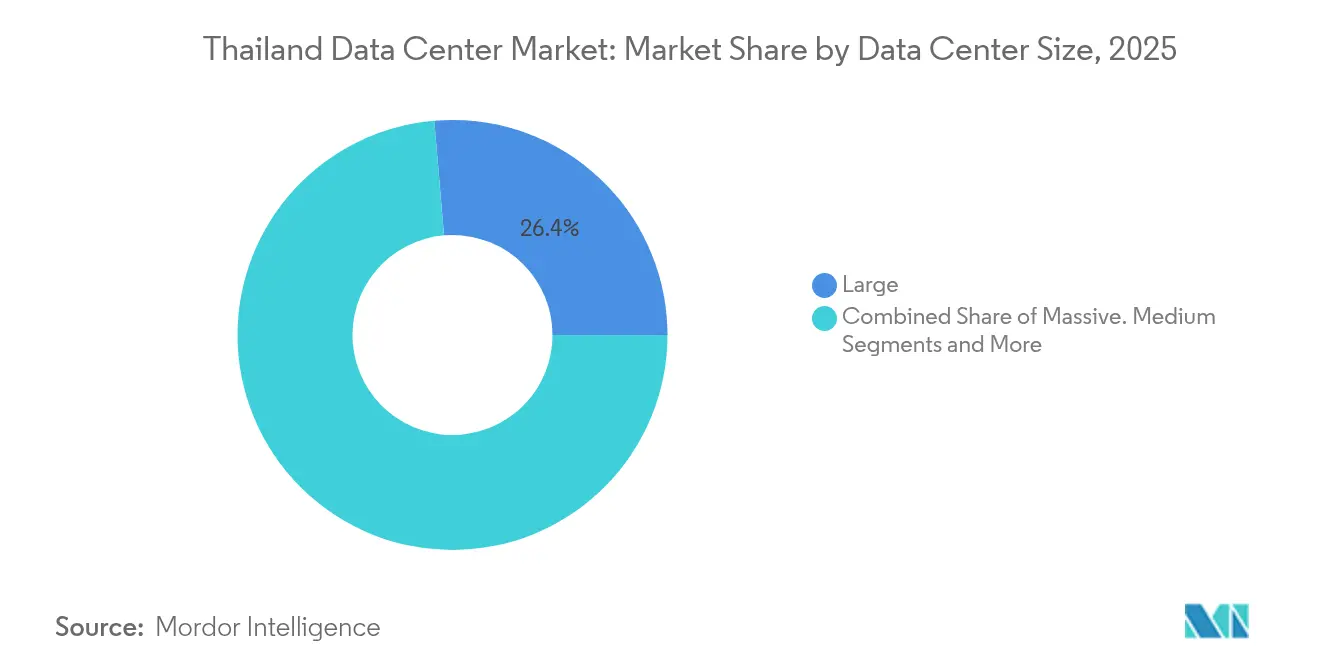
- By data center size, large facilities held 26.35% share in 2025; medium facilities are projected to expand at 17.95% CAGR through 2031.
- By tier type, Tier 3 commanded 85.62% of the Thailand data center market share in 2025 and is advancing at 18.88% CAGR to 2031.
- By data center type, colocation controlled 44.12% share in 2025, while hyperscale and self-built sites are set to post an 17.84% CAGR by 2031.
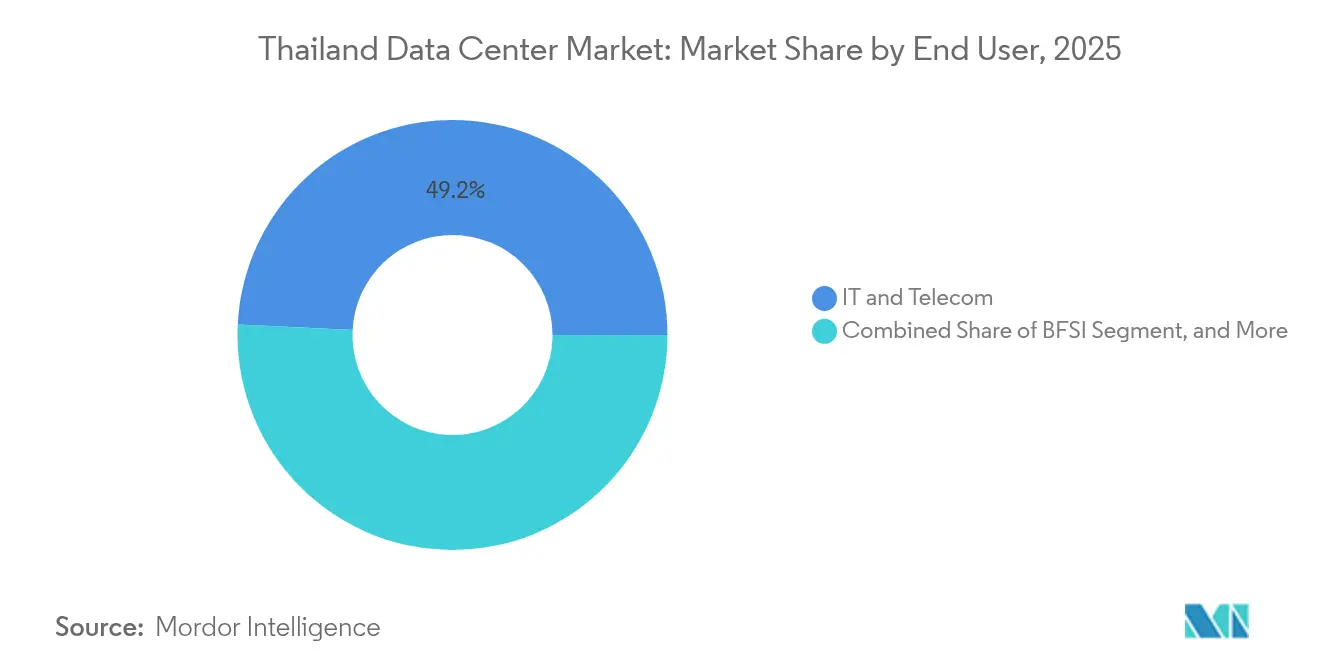
- By end user, IT and telecom accounted for 49.22% of the market in 2025; BFSI is poised to grow fastest at 17.92% CAGR through 2031.
- By hotspot, Bangkok dominated with 70.25% share in 2025 and is forecast to expand at 18.02% CAGR to 2031.
Note: Market size and forecast figures in this report are generated using Mordor Intelligence’s proprietary estimation framework, updated with the latest available data and insights as of 2026.
Thailand Data Center Market Trends and Insights
Drivers Impact Analysis*
| Driver | (~) % Impact on CAGR Forecast | Geographic Relevance | Impact Timeline |
|---|---|---|---|
| Rising cloud-first digital transformation mandates among Thai enterprises | +4.20% | National, concentrated in Bangkok and EEC | Medium term (2-4 years) |
| Aggressive submarine cable investments enhancing international connectivity | +3.80% | National, with primary landing points in Bangkok and coastal areas | Long term (≥ 4 years) |
| Government incentives under Thailand 4.0 driving data localization | +3.50% | National, with enhanced benefits in EEC and special economic zones | Long term (≥ 4 years) |
| Surge in AI and high-density computing workloads requiring hyperscale capacity | +4.10% | Bangkok and EEC, with spillover to secondary cities | Short term (≤ 2 years) |
| Edge deployments for Industry 4.0 corridors in Eastern Economic Corridor | +2.70% | Eastern Economic Corridor, with expansion to industrial clusters | Medium term (2-4 years) |
| Lucrative green-energy tariffs encouraging sustainable data center builds | +2.90% | National, with premium benefits in renewable energy zones | Medium term (2-4 years) |
| Source: Mordor Intelligence | |||


Rising Cloud-First Digital Transformation Mandates Among Thai Enterprises
Continuous state-backed digital policies now oblige corporations to host regulated workloads in-country. The Board of Investment grants up to 13-year income-tax holidays on projects above THB 750 million (USD 21.7 million) that add local compute, lowering the effective total cost of ownership. Manufacturers such as Midea run 5G-enabled smart factories in the EEC that depend on proximate edge nodes for real-time quality control.[2]Huawei, “How Midea Operates in Thailand a 5G Fully Connected Factory,” huawei.com Mergers in fixed broadband, notably AIS-3BB, lift access speeds and hasten enterprise cloud adoption. Carrier-neutral sites with dense on-ramps therefore secure long-term contracts despite premium pricing.
Aggressive Submarine-Cable Investments Enhancing International Connectivity
New trans-Asian systems shorten round-trip latency to Singapore, Hong Kong, and Tokyo below 10 milliseconds, enabling content, fintech, and SaaS firms to anchor regional workloads inside Bangkok. Hyperscalers cite bandwidth gains as the precondition for launching sovereign cloud regions, which cascade demand into wholesale colocation halls requiring triple-path fiber and dark-fiber diversity. Better throughput also lets Thai operators serve neighbouring Mekong markets from domestic hubs, opening wholesale revenue streams.
Government Incentives Under Thailand 4.0 Driving Data Localization
Thailand 4.0 expands tax relief, land-ownership relaxations, and duty-free import of critical IT gear. Foreign-owned operators now hold up to 20 rai (32,000 m²) for employee housing inside promoted zones, unlocking campus-style developments once constrained by real-estate rules. Financial inducements align with stricter residency clauses for public-sector and BFSI data, ensuring a captive demand base for new vault-grade, in-country capacity.
Surge in AI and High-Density Computing Workloads Requiring Hyperscale Capacity
GPU clusters for generative AI training drive rack power envelopes from 15 kW to 50 kW and above. STT GDC Thailand’s liquid-cooling upgrade supports 150 kW racks, making it one of the few facilities in Southeast Asia validated for turnkey AI colocation. Early-mover advantage attracts chip-design, fintech inference, and content-personalization workloads. Secondary cities gain spillover GPU demand for latency-critical inference at industrial sites.
Restraints Impact Analysis*
| Restraint | (~) % Impact on CAGR Forecast | Geographic Relevance | Impact Timeline |
|---|---|---|---|
| Land scarcity and soaring Bangkok real-estate costs | -2.80% | Bangkok metropolitan area, with spillover effects to surrounding provinces | Short term (≤ 2 years) |
| Chronic grid stability issues outside primary metro areas | -3.20% | Regional areas outside Bangkok, particularly affecting EEC expansion | Medium term (2-4 years) |
| Lengthy permitting and environmental approval cycles | -2.10% | National, with more severe impacts in environmentally sensitive areas | Medium term (2-4 years) |
| Intensifying competition compressing colocation pricing margins | -1.90% | Bangkok and major metropolitan areas with high operator concentration | Short term (≤ 2 years) |
| Source: Mordor Intelligence | |||
Land Scarcity and Soaring Bangkok Real-Estate Costs
Prime plots inside Bangkok’s carrier hotels and CBD corridors command record premiums that squeeze multi-tenant operators on expansion budgets. Hyperscalers leverage deeper balance sheets to pre-empt entire industrial parks, leaving colocators to retrofit vertical extensions or migrate capacity to outer provinces. Resultant site hunts add months to project lead-times and compel higher rack-density strategies to lift revenue per square meter.
Chronic Grid Stability Issues Outside Primary Metro Areas
Voltage-swing incidents and feeder outages in secondary provinces oblige operators to over-spec diesel reserves and flywheel UPS, adding 15-25% to initial build cost. Renewable PPAs remain attractive yet require grid strengthening to guarantee quality of supply, delaying faster green-energy adoption. Consequently, Bangkok retains volume despite cost escalation, while edge campuses favour modular, micro-grid architectures to mitigate reliability gaps.
*Our forecasts treat driver/restraint impacts as directional, not additive. The impact forecasts reflect baseline growth, mix effects, and variable interactions.
Segment Analysis
By Data Center Size: Medium Facilities Drive Distributed Architecture
Medium facilities accounted for a notable slice of the Thailand data center market size, growing at 17.95% CAGR as enterprises and telecom carriers prioritize low-latency zones closer to users. Large campuses hold economies of scale and captured 26.35% of Thailand data center market share in 2025, but their downtown land constraints limit additional expansion.
Operators replicate standardized 6-12 MW blueprints in provincial industrial estates, aligning with 5G edge computing rollouts by Advanced Info Service that anchor private network cores near manufacturing clusters. The pattern lowers transport latency for factory automation and drives diverse demand beyond Bangkok.


By Tier Type: Tier 3 Dominance Reflects Cost-Performance Balance
Tier 3 specifications represented 85.62% of Thailand data center market share in 2025, demonstrating enterprise comfort with 99.982% uptime at more practical price points than Tier 4. Upgrades to support high-density AI racks fuel a 18.88% CAGR for Tier 3 builds over 2026-2031.
Colocation providers enhance redundancy via modular power trains and hot-swap chillers rather than shifting to full Tier 4, preserving capex discipline. STT GDC’s Frost and Sullivan award spotlights operational excellence inside Tier 3 footprints optimized for liquid immersion cooling demand.
By Data Center Type: Hyperscale Expansion Challenges Colocation Leadership
Colocation retained 44.12% share in 2025, yet hyperscale and self-built capacity is set for 17.84% CAGR as global clouds open sovereign regions. Capital inflows exceed USD 7 billion across 2024-2025 funding rounds, headlined by Digital Edge’s USD 1.6 billion raise earmarked for Thai campuses.
Hybrid operators that bundle retail colocation suites alongside wholesale halls meet both enterprise and hyperscaler needs, cushioning price pressure. Interconnection marketplaces inside carrier-neutral halls remain critical even for cloud majors seeking dark-fiber diversity into their sovereign zones.
By End User: BFSI Leads Digital Transformation Acceleration
IT and telecom clients drove 49.22% of 2025 demand, sustaining baseline growth as 5G overlays widen. However, BFSI workloads will post the top 17.92% CAGR as digital asset trading rules mandate domestic hosting for blockchain nodes and low-latency exchange engines.
Banks deploy active-active architectures across two or more Bangkok halls to contain systemic risk, helping medium facilities fill high-density zones quickly. Regulatory audits further lock workloads in-country, tempering any offshore shift.
By Hotspot: Bangkok Maintains Dominance Despite Regional Growth
Bangkok contributed 70.25% of 2025 capacity and is forecast to log an 18.02% CAGR to 2031. Dense carrier fabric, submarine-cable landings, and enterprise headquarters reinforce its primacy.
Peripheral plots in Greater Bangkok unlock fresh megawatt blocks yet require hefty power-train reinforcements. The EEC ranks second with edge-driven builds tied to Industry 4.0 corridors, but grid and fiber depth remain the gating factors.
Geography Analysis
Bangkok’s scale advantage positions it as Southeast Asia’s low-latency hub between Singapore and Ho Chi Minh City. Three availability zones from a global hyperscaler trigger multiplier effect for cloud on-ramps, object storage, and backup vaults, translating into sustained rack absorption. Legacy buildings undergo power-density retrofits rather than relocation due to irreplaceable metro fiber rings.
Secondary markets in Chonburi, Rayong, and Chachoengsao leverage EEC tax holidays, though operators embed extra redundancy to offset grid volatility. Early projects adopt modular blocks under 6 MW to match phased manufacturing builds, keeping utilization above 70% even at launch. Local governments fast-track permits to lure digital infrastructure, but skilled workforce shortages require operators to rotate Bangkok engineering crews until regional talent matures.
Border provinces with new submarine-cable spurs eye content-delivery and blockchain-validation niches. Cross-border data flows into Laos and Myanmar spur small retail suites anchored by telecom wholesalers. Long-term success hinges on last-mile fiber densification funded by Universal Service Obligations and village broadband programs referenced in public policy papers.
Competitive Landscape
Thailand hosts a mid-concentrated field where the top five operators control an estimated 55-60% of installed IT load. True IDC leans on parent CP Group’s enterprise network, while STT GDC scales liquid-cooling bays to capture AI clusters. Digital Edge and Global Infrastructure Partners inject fresh capital and global design-build standards, accelerating greenfield pipelines.
Joint ventures emerge as preferred market-entry vehicles, balancing land-title constraints and local relationship needs. International energy majors court data center partners to offtake renewable PPAs, exchanging green electrons for long-term hosting contracts.
Technology differentiation, especially immersion and rear-door heat-exchangers, replaces raw floor space as the winning metric. Operators that certify to ISO 27001, PCI-DSS, and gain sovereign cloud stamps capture regulated sectors. Support services around remote hands, DCIM analytics, and compliance reporting round out margin-accretive offerings.[4]Digital Edge, “Digital Edge Raises Over US$1.6 Billion in New Equity and Debt Capital,” digitaledgedc.com
Thailand Data Center Industry Leaders
CS LOXINFO PUBLIC COMPANY LIMITED
NTT Ltd
STT GDC Pte Ltd
True Internet Data Center Co. Ltd
United Information Highway Co. Ltd
- *Disclaimer: Major Players sorted in no particular order

Recent Industry Developments
- October 2025: Google announced USD 1 billion investment to build digital infrastructure in Thailand, including a new data center in Chonburi and cloud region in Bangkok, with projected USD 4 billion GDP impact by 2029 and 14,000 job creation between 2025-2029.
- May 2025: Global Infrastructure Partners announced a strategic partnership with CP Group and True IDC to accelerate Thailand's digital infrastructure growth, combining international capital with local market expertise and operational capabilities to expand data center capacity across key metropolitan and industrial zones.
- January 2025: Digital Edge raised over USD 1.6 billion in new equity and debt capital to fund continued platform expansion across Asia Pacific, with specific Thailand projects referenced in subsequent company announcements targeting Eastern Economic Corridor development.
- January 2025: AWS announced general availability of the AWS Asia Pacific (Thailand) Region, comprising three Availability Zones, marking the first AWS infrastructure region in Thailand with a projected USD 10 billion GDP contribution over 15 years and support for 11,000 annual jobs.


Thailand Data Center Market Report Scope
Bangkok are covered as segments by Hotspot. Large, Massive, Medium, Mega, Small are covered as segments by Data Center Size. Tier 1 and 2, Tier 3, Tier 4 are covered as segments by Tier Type. Non-Utilized, Utilized are covered as segments by Absorption.| Large |
| Massive |
| Medium |
| Mega |
| Small |
| Tier 1 and 2 |
| Tier 3 |
| Tier 4 |
| Hyperscale/Self-built | ||
| Enterprise/Edge | ||
| Colocation | Non-Utilized | |
| Utilized | Retail Colocation | |
| Wholesale Colocation | ||
| BFSI |
| IT and ITES |
| E-Commerce |
| Government |
| Manufacturing |
| Media and Entertainment |
| Telecom |
| Other End Users |
| Bangkok |
| Rest of Thailand |
| By Data Center Size | Large | ||
| Massive | |||
| Medium | |||
| Mega | |||
| Small | |||
| By Tier Type | Tier 1 and 2 | ||
| Tier 3 | |||
| Tier 4 | |||
| By Data Center Type | Hyperscale/Self-built | ||
| Enterprise/Edge | |||
| Colocation | Non-Utilized | ||
| Utilized | Retail Colocation | ||
| Wholesale Colocation | |||
| By End User | BFSI | ||
| IT and ITES | |||
| E-Commerce | |||
| Government | |||
| Manufacturing | |||
| Media and Entertainment | |||
| Telecom | |||
| Other End Users | |||
| By Hotspot | Bangkok | ||
| Rest of Thailand | |||


Market Definition
- IT LOAD CAPACITY - The IT load capacity or installed capacity, refers to the amount of energy consumed by servers and network equipments placed in a rack installed. It is measured in megawatt (MW).
- ABSORPTION RATE - It denotes the extend to which the data center capacity has been leased out. For instance, a 100 MW DC has leased out 75 MW, then absorption rate would be 75%. It is also referred as utilization rate and leased-out capacity.
- RAISED FLOOR SPACE - It is an elevated space build over the floor. This gap between the original floor and the elevated floor is used to accommodate wiring, cooling, and other data center equipment. This arrangement assist in having proper wiring and cooling infrastructure. It is measured in square feet (ft^2).
- DATA CENTER SIZE - Data Center Size is segmented based on the raised floor space allocated to the data center facilities. Mega DC - # of Racks must be more than 9000 or RFS (raised floor space) must be more than 225001 Sq. ft; Massive DC - # of Racks must be in between 9000 and 3001 or RFS must be in between 225000 Sq. ft and 75001 Sq. ft; Large DC - # of Racks must be in between 3000 and 801 or RFS must be in between 75000 Sq. ft and 20001 Sq. ft; Medium DC # of Racks must be in between 800 and 201 or RFS must be in between 20000 Sq. ft and 5001 Sq. ft; Small DC - # of Racks must be less than 200 or RFS must be less than 5000 Sq. ft.
- TIER TYPE - According to Uptime Institute the data centers are classified into four tiers based on the proficiencies of redundant equipment of the data center infrastructure. In this segment the data center are segmented as Tier 1,Tier 2, Tier 3 and Tier 4.
- COLOCATION TYPE - The segment is segregated into 3 categories namely Retail, Wholesale and Hyperscale Colocation service. The categorization is done based on the amount of IT load leased out to potential customers. Retail colocation service has leased capacity less than 250 kW; Wholesale colocation services has leased capacity between 251 kW and 4 MW and Hyperscale colocation services has leased capacity more than 4 MW.
- END CONSUMERS - The Data Center Market operates on a B2B basis. BFSI, Government, Cloud Operators, Media and Entertainment, E-Commerce, Telecom and Manufacturing are the major end-consumers in the market studied. The scope only includes colocation service operators catering to the increasing digitalization of the end-user industries.
| Keyword | Definition |
|---|---|
| Rack Unit | Generally referred as U or RU, it is the unit of measurement for the server unit housed in the racks in the data center. 1U is equal to 1.75 inches. |
| Rack Density | It defines the amount of power consumed by the equipment and server housed in a rack. It is measured in kilowatt (kW). This factor plays a critical role in data center design and, cooling and power planning. |
| IT Load Capacity | The IT load capacity or installed capacity, refers to the amount of energy consumed by servers and network equipment placed in a rack installed. It is measured in megawatt (MW). |
| Absorption Rate | It denotes how much of the data center capacity has been leased out. For instance, if a 100 MW DC has leased out 75 MW, then the absorption rate would be 75%. It is also referred to as utilization rate and leased-out capacity. |
| Raised Floor Space | It is an elevated space built over the floor. This gap between the original floor and the elevated floor is used to accommodate wiring, cooling, and other data center equipment. This arrangement assists in having proper wiring and cooling infrastructure. It is measured in square feet/meter. |
| Computer Room Air Conditioner (CRAC) | It is a device used to monitor and maintain the temperature, air circulation, and humidity inside the server room in the data center. |
| Aisle | It is the open space between the rows of racks. This open space is critical for maintaining the optimal temperature (20-25 °C) in the server room. There are primarily two aisles inside the server room, a hot aisle and a cold aisle. |
| Cold Aisle | It is the aisle wherein the front of the rack faces the aisle. Here, chilled air is directed into the aisle so that it can enter the front of the racks and maintain the temperature. |
| Hot Aisle | It is the aisle where the back of the racks faces the aisle. Here, the heat dissipated from the equipment’s in the rack is directed to the outlet vent of the CRAC. |
| Critical Load | It includes the servers and other computer equipment whose uptime is critical for data center operation. |
| Power Usage Effectiveness (PUE) | It is a metric which defines the efficiency of a data center. It is calculated by: (𝑇𝑜𝑡𝑎𝑙 𝐷𝑎𝑡𝑎 𝐶𝑒𝑛𝑡𝑒𝑟 𝐸𝑛𝑒𝑟𝑔𝑦 𝐶𝑜𝑛𝑠𝑢𝑚𝑝𝑡𝑖𝑜𝑛)/(𝑇𝑜𝑡𝑎𝑙 𝐼𝑇 𝐸𝑞𝑢𝑖𝑝𝑚𝑒𝑛𝑡 𝐸𝑛𝑒𝑟𝑔𝑦 𝐶𝑜𝑛𝑠𝑢𝑚𝑝𝑡𝑖𝑜𝑛). Further, a data center with a PUE of 1.2-1.5 is considered highly efficient, whereas, a data center with a PUE >2 is considered highly inefficient. |
| Redundancy | It is defined as a system design wherein additional component (UPS, generators, CRAC) is added so that in case of power outage, equipment failure, the IT equipment should not be affected. |
| Uninterruptible Power Supply (UPS) | It is a device that is connected in series with the utility power supply, storing energy in batteries such that the supply from UPS is continuous to IT equipment even during utility power is snapped. The UPS primarily supports the IT equipment only. |
| Generators | Just like UPS, generators are placed in the data center to ensure an uninterrupted power supply, avoiding downtime. Data center facilities have diesel generators and commonly, 48-hour diesel is stored in the facility to prevent disruption. |
| N | It denotes the tools and equipment required for a data center to function at full load. Only "N" indicates that there is no backup to the equipment in the event of any failure. |
| N+1 | Referred to as 'Need plus one', it denotes the additional equipment setup available to avoid downtime in case of failure. A data center is considered N+1 when there is one additional unit for every 4 components. For instance, if a data center has 4 UPS systems, then for to achieve N+1, an additional UPS system would be required. |
| 2N | It refers to fully redundant design wherein two independent power distribution system is deployed. Therefore, in the event of a complete failure of one distribution system, the other system will still supply power to the data center. |
| In-Row Cooling | It is the cooling design system installed between racks in a row where it draws warm air from the hot aisle and supplies cool air to the cold aisle, thereby maintaining the temperature. |
| Tier 1 | Tier classification determines the preparedness of a data center facility to sustain data center operation. A data center is classified as Tier 1 data center when it has a non-redundant (N) power component (UPS, generators), cooling components, and power distribution system (from utility power grids). The Tier 1 data center has an uptime of 99.67% and an annual downtime of <28.8 hours. |
| Tier 2 | A data center is classified as Tier 2 data center when it has a redundant power and cooling components (N+1) and a single non-redundant distribution system. Redundant components include extra generators, UPS, chillers, heat rejection equipment, and fuel tanks. The Tier 2 data center has an uptime of 99.74% and an annual downtime of <22 hours. |
| Tier 3 | A data center having redundant power and cooling components and multiple power distribution systems is referred to as a Tier 3 data center. The facility is resistant to planned (facility maintenance) and unplanned (power outage, cooling failure) disruption. The Tier 3 data center has an uptime of 99.98% and an annual downtime of <1.6 hours. |
| Tier 4 | It is the most tolerant type of data center. A Tier 4 data center has multiple, independent redundant power and cooling components and multiple power distribution paths. All IT equipment are dual powered, making them fault tolerant in case of any disruption, thereby ensuring interrupted operation. The Tier 4 data center has an uptime of 99.74% and an annual downtime of <26.3 minutes. |
| Small Data Center | Data center that has floor space area of ≤ 5,000 Sq. ft or the number of racks that can be installed is ≤ 200 is classified as a small data center. |
| Medium Data Center | Data center which has floor space area between 5,001-20,000 Sq. ft, or the number of racks that can be installed is between 201-800, is classified as a medium data center. |
| Large Data Center | Data center which has floor space area between 20,001-75,000 Sq. ft, or the number of racks that can be installed is between 801-3,000, is classified as a large data center. |
| Massive Data Center | Data center which has floor space area between 75,001-225,000 Sq. ft, or the number of racks that can be installed is between 3001-9,000, is classified as a massive data center. |
| Mega Data Center | Data center that has a floor space area of ≥ 225,001 Sq. ft or the number of racks that can be installed is ≥ 9001 is classified as a mega data center. |
| Retail Colocation | It refers to those customers who have a capacity requirement of 250 kW or less. These services are majorly opted by small and medium enterprises (SMEs). |
| Wholesale Colocation | It refers to those customers who have a capacity requirement between 250 kW to 4 MW. These services are majorly opted by medium to large enterprises. |
| Hyperscale Colocation | It refers to those customers who have a capacity requirement greater than 4 MW. The hyperscale demand primarily originates from large-scale cloud players, IT companies, BFSI, and OTT players (like Netflix, Hulu, and HBO+). |
| Mobile Data Speed | It is the mobile internet speed a user experiences via their smartphones. This speed is primarily dependent on the carrier technology being used in the smartphone. The carrier technologies available in the market are 2G, 3G, 4G, and 5G, where 2G provides the slowest speed while 5G is the fastest. |
| Fiber Connectivity Network | It is a network of optical fiber cables deployed across the country, connecting rural and urban regions with high-speed internet connection. It is measured in kilometer (km). |
| Data Traffic per Smartphone | It is a measure of average data consumption by a smartphone user in a month. It is measured in gigabyte (GB). |
| Broadband Data Speed | It is the internet speed that is supplied over the fixed cable connection. Commonly, copper cable and optic fiber cable are used in both residential and commercial use. Here, optic cable fiber provides faster internet speed than copper cable. |
| Submarine Cable | A submarine cable is a fiber optic cable laid down at two or more landing points. Through this cable, communication and internet connectivity between countries across the globe is established. These cables can transmit 100-200 terabits per second (Tbps) from one point to another. |
| Carbon Footprint | It is the measure of carbon dioxide generated during the regular operation of a data center. Since, coal, and oil & gas are the primary source of power generation, consumption of this power contributes to carbon emissions. Data center operators are incorporating renewable energy sources to curb the carbon footprint emerging in their facilities. |


Research Methodology
Mordor Intelligence follows a four-step methodology in all our reports.
- Step-1: Identify Key Variables: In order to build a robust forecasting methodology, the variables and factors identified in Step-1 are tested against available historical market numbers. Through an iterative process, the variables required for market forecast are set and the model is built on the basis of these variables.
- Step-2: Build a Market Model: Market-size estimations for the forecast years are in nominal terms. Inflation is not a part of the pricing, and the average selling price (ASP) is kept constant throughout the forecast period for each country.
- Step-3: Validate and Finalize: In this important step, all market numbers, variables and analyst calls are validated through an extensive network of primary research experts from the market studied. The respondents are selected across levels and functions to generate a holistic picture of the market studied.
- Step-4: Research Outputs: Syndicated Reports, Custom Consulting Assignments, Databases & Subscription Platforms


