South Korea Hyperscale Data Center Market Size and Share
Market Overview
| Study Period | 2019 - 2030 |
|---|---|
| Forecast Data Period | 2025 - 2030 |
| Historical Data Period | 2019 - 2023 |
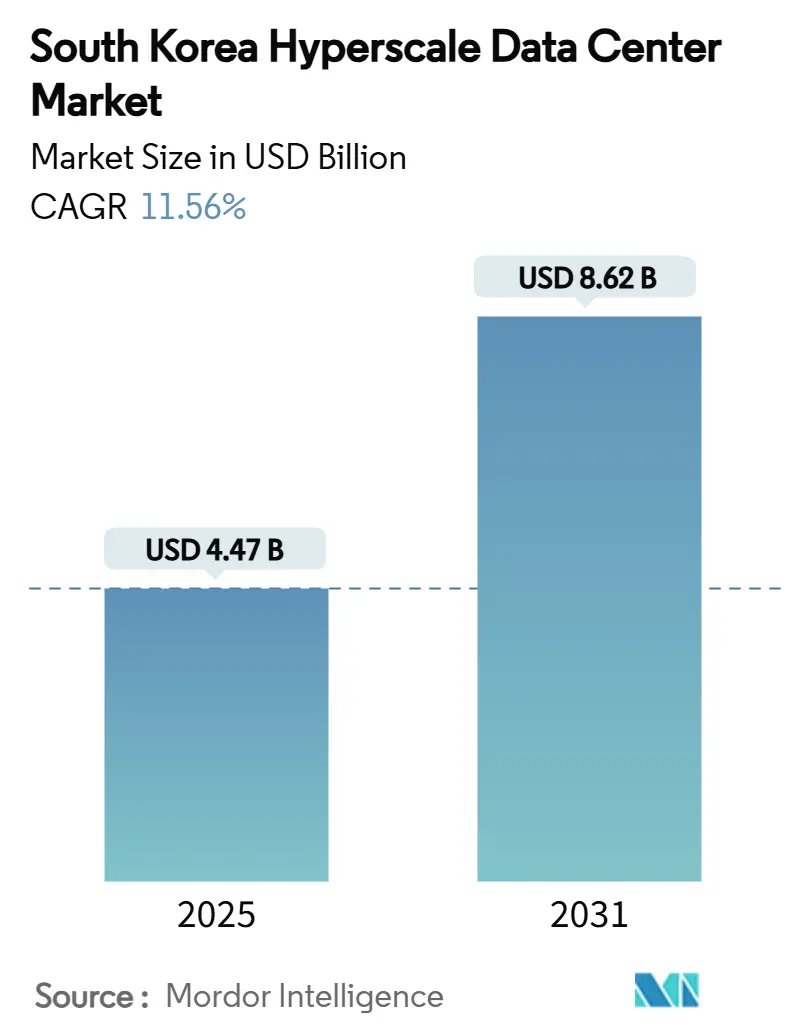
| Market Size (2025) | USD 4.47 Billion |
| Market Size (2031) | USD 8.62 Billion |
| Growth Rate (2025 - 2031) | 11.56% CAGR |
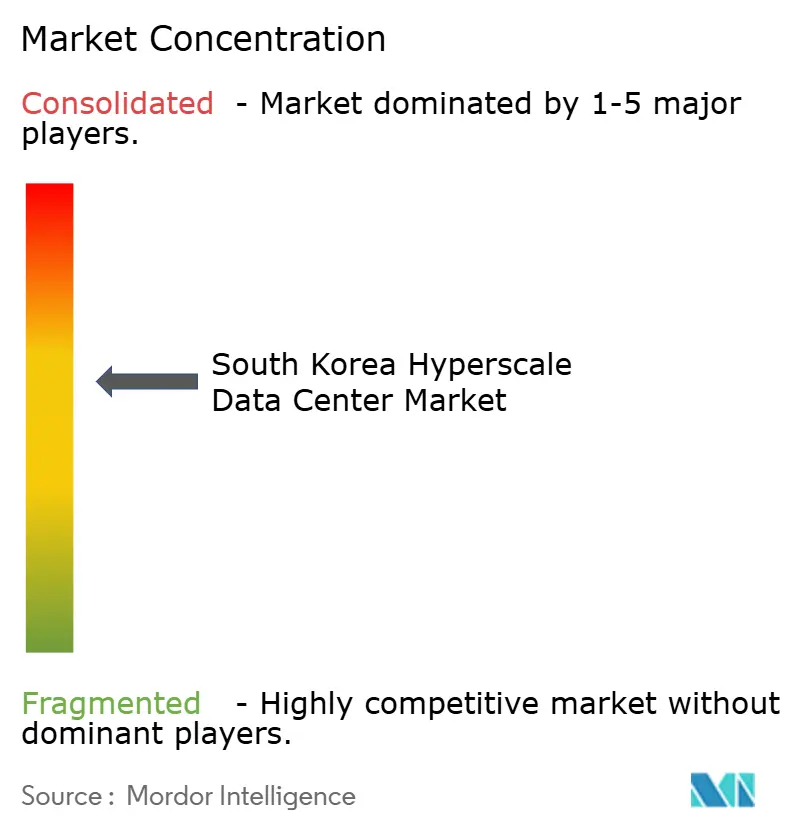
| Market Concentration | Medium |
Major Players *Disclaimer: Major Players sorted in no particular order Image © Mordor Intelligence. Reuse requires attribution under CC BY 4.0. | |
South Korea Hyperscale Data Center Market Analysis by Mordor Intelligence
The South Korea hyperscale data center market size stands at USD 4.47 billion in 2025 and is forecast to reach USD 8.62 billion by 2031, expanding at an 11.56% CAGR. Installed IT load grows from 1,863.97 MW in 2025 to 3,750.27 MW by 2031, a 12.36% CAGR, underlining the infrastructure-intensive nature of AI-optimized facilities that consume three to four times more power per rack than traditional enterprise deployments. AI workload proliferation, government digital-sovereignty mandates, and generous tax incentives combine to accelerate local build-outs as operators pivot from regional hubs such as Singapore and Tokyo. Competitive intensity rises as global cloud providers, domestic telcos, and new AI-focused specialists compete on density, cooling, and time-to-market advantages. Land scarcity and grid congestion around Seoul redirect new capacity toward Chungcheong and southern coastal provinces where renewable-energy potential and permitting lead-times are more favorable.
Key Report Takeaways
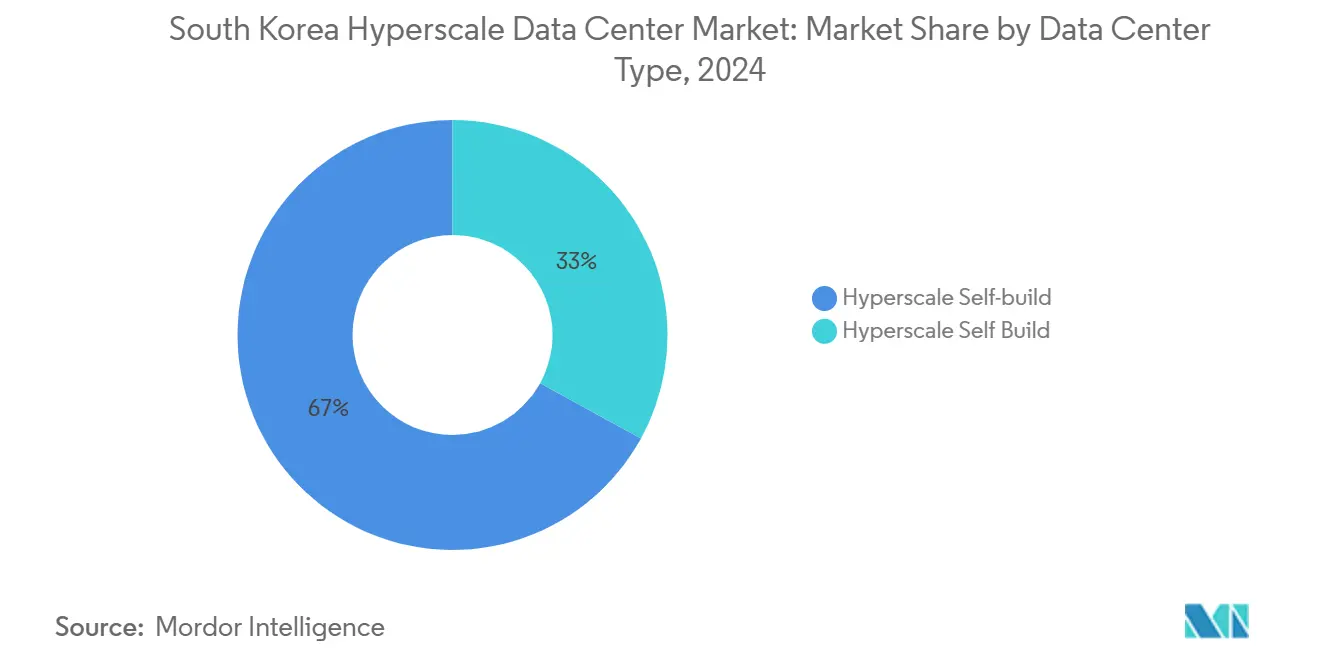
- By data center type, Hyperscale self-build facilities led with 67% of the South Korea hyperscale data center market share in 2024, while hyperscale colocation recorded the fastest projected CAGR at 11.6% through 2030.
- By component, Mechanical infrastructure accounted for 45% of the South Korea hyperscale data center market size in 2024 and is advancing at a 12.06% CAGR to 2030.
- By tier standard, Tier IV deployments are projected to expand at a 13.01% CAGR, outpacing Tier III’s dominant but slower trajectory through the forecast period.
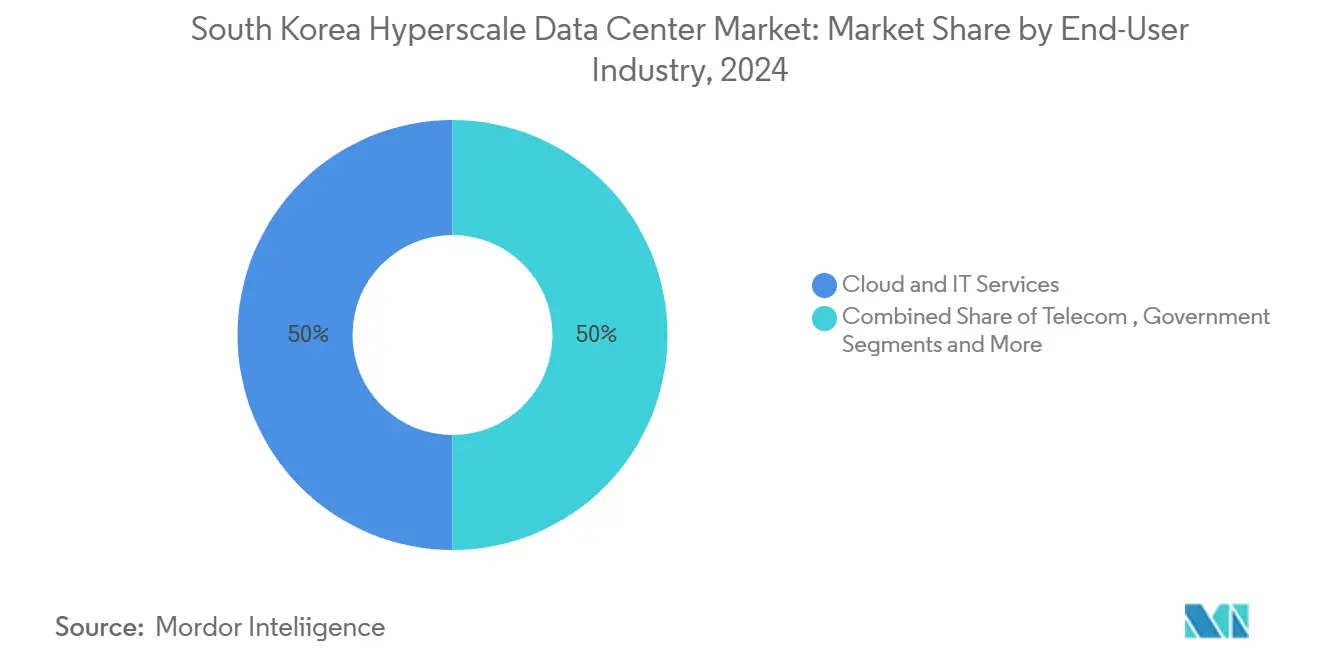
- By end-user industry, BFSI captured 12.9% CAGR, the highest growth among verticals, driven by domestic-hosting mandates for regulated data.
- By data center size, Mega facilities (greater than 60 MW) posted the strongest growth outlook at 14% CAGR, while massive facilities (greater than 25 MW – less than or equal to 60 MW) retained a 50% revenue share in 2024.
Viewed independently, South korea offers depth on local conditions but not full coverage of the overall global system. Mordor Intelligence's coverage on the hyperscale data center market brings the wider geographic picture into focus.
South Korea Hyperscale Data Center Market Trends and Insights
Drivers Impact Analysis*
| Driver | (~) % Impact on CAGR Forecast | Geographic Relevance | Impact Timeline |
|---|---|---|---|
| Exploding GPU-centric AI/ML workloads from global and domestic cloud providers | +2.8% | Seoul Capital Area, Chungcheong | Short term (≤ 2 years) |
| Government "Digital New Deal" incentives and tax credits for hyperscale builds | +2.1% | National, with early gains in Seoul, Incheon, Sejong | Medium term (2-4 years) |
| Mandatory local-cloud hosting of regulated financial data (FSC guidelines) | +1.4% | Seoul Capital Area, Yeongnam | Medium term (2-4 years) |
| Surging 5G and OTT traffic concentrating capacity around the Seoul capital area | +1.7% | Seoul Capital Area, spill-over to Chungcheong | Short term (≤ 2 years) |
| Offshore-wind PPAs unlocking greater than 100 MW green campuses | +1.2% | Jeolla, Gyeongsang coastal regions | Long term (≥ 4 years) |
| Sub-sea cable hub positioning Korea as DR site for Japanese hyperscalers | +0.9% | Seoul Capital Area, Yeongnam | Long term (≥ 4 years) |
| Source: Mordor Intelligence | |||
Exploding GPU-centric AI/ML workloads from global and domestic cloud providers
GPU servers grew from 26.2% to 45% of Korea’s total server market in 2024, generating KRW 5.1 trillion in revenue, a 72.7% surge that mirrors generative-AI adoption. SK Telecom and AWS plan 60,000 GPUs at a 103 MW Ulsan campus, underscoring power densities exceeding 20 kW per rack.[1]Josh Smith, “South Korea says SK and Amazon to invest $5 billion in country's biggest data centre,” Reuters, reuters.com Facilities retrofit power and cooling to sustain AI clusters while the national AI Computing Center targets 15,000 GPUs by 2025, elevating Korea as a regional training hub. Financial institutions mirror the trend; KakaoBank’s AI lab at Digital Realty’s ICN10 facility exploits liquid-to-chip cooling for generative risk models. Demand cascades across suppliers of high-density racks, immersion cooling, and GPU-optimized network fabrics.
Government “Digital New Deal” incentives and tax credits for hyperscale builds
Korea raised foreign-investment cash subsidies to 75% and lengthened tax exemptions to seven years, lifting returns on USD 1 billion-plus campuses.[2]BusinessKorea editorial, “Korea Raises Cash Subsidies for Foreign Investors to 75%, Extends Tax Exemptions to 7 Years,” BusinessKorea, businesskorea.co.krA KRW 3.5 trillion AI-sector funding program combines low-interest loans and direct equity to support cloud and data-center ventures. Incentives weigh heavily in internal rate-of-return models for multi-gigawatt projects, particularly outside metropolitan Seoul where land and grid access improve margins. Regulatory preference for non-metropolitan development channels new construction into Chungcheong and coastal provinces, easing congestion in the capital. The policy mix crystallizes sovereign-cloud objectives while catalyzing inward FDI among U.S., Japanese, and European operators.
Mandatory local-cloud hosting of regulated financial data (FSC guidelines)
Financial Services Commission rules dictate domestic storage and disaster-recovery of regulated data, generating captive demand equal to 15-20% of national hyperscale capacity. BFSI workloads therefore exhibit 12.9% CAGR as banks modernize core systems and embed AI-driven fraud analytics that require low-latency, on-shore compute. Compliance spans dual-site redundancy, compelling global cloud providers to deploy paired facilities inside Korea’s borders. KakaoBank’s choice of Digital Realty’s compliance-ready halls typifies how institutions prioritize audited power, cooling, and connectivity envelopes over generic cloud footprints.[3]Digital Realty newsroom, “Digital Realty Unveils Advanced High-Density Deployment Support for Liquid-to-Chip Cooling,” Digital Realty, digitalrealty.com Future FSC guidance on cloud-native banking will further raise baseline capacity requirements.
Surging 5G and OTT traffic concentrating capacity around Seoul
Forty-eight private 5G networks licensed by 2023 intensify edge-compute needs for AR, autonomous-mobility, and smart-manufacturing workloads. Half of the population lives in the Seoul Capital Area, magnifying traffic peaks and motivating CDN nodes at hyperscale campuses. KISTI’s 600 G research backbone showcases optical throughput that underpins AI inference at the edge. Operators combine metro-cores with regional edge zones to meet latency budgets under 10 milliseconds for immersive media. The traffic tidal effect bolsters near-capex for Seoul sites yet nudges incremental builds to outer rings such as Chungcheong.
Restraints Impact Analysis*
| Restraint | (~) % Impact on CAGR Forecast | Geographic Relevance | Impact Timeline |
|---|---|---|---|
| Grid-connection bottlenecks and permitting delays in Seoul/Incheon | -1.8% | Seoul Capital Area, Incheon | Short term (≤ 2 years) |
| Rising land and construction costs in prime tech corridors (Pangyo, Sangam) | -1.2% | Seoul Capital Area | Medium term (2-4 years) |
| Water-use limits on evaporative cooling during drought periods | -0.9% | National, acute in Seoul Capital Area | Medium term (2-4 years) |
| Seismic-grade construction standards along southern coast increase CAPEX | -0.7% | Yeongnam, Honam coastal regions | Long term (≥ 4 years) |
| Source: Mordor Intelligence | |||
Grid-connection bottlenecks and permitting delays in Seoul/Incheon
KEPCO’s debt surpassing KRW 206 trillion hampers transmission-upgrade budgets, causing 12-18-month delays for 100 MW + interconnections. AI-tuned halls intensify demand, tripling per-rack draw relative to conventional clouds. GE Vernova’s 500 kV HVDC project will relieve congestion, yet completion stretches to 2028. Developers increasingly select Chungcheong or Gangwon for near-term builds, trading proximity for power availability—a dynamic that tempers the South Korea hyperscale data center market’s near-term growth.
Rising land and construction costs in prime tech corridors
Pangyo and Sangam land prices rose double-digits in 2024, inflating project CAPEX and compressing NPV for multi-story stacks. Tier IV designs further amplify steel and concrete demand due to dual-path redundancy. Operators counter by pursuing vertical campuses on reclaimed industrial estates or shifting site selection to Sejong and Cheonan where land cost discounts exceed 30%. The cost escalation trims 1.2 percentage-points from forecast CAGR yet propels design innovation around prefabricated modules that shorten build cycles.
*Our forecasts treat driver/restraint impacts as directional, not additive. The impact forecasts reflect baseline growth, mix effects, and variable interactions.
Segment Analysis
By Data Center Type: Self-build Dominance Challenged by Colocation Growth
Self-build facilities captured 67% of the South Korea hyperscale data center market share in 2024 as cloud majors sought bespoke architectures for AI model training. The segment’s scale facilitates end-to-end optimization across power, cooling, and orchestration yet ties up balance sheets for years. Hyperscale colocation realizes an 11.6% CAGR as operators favor speed-to-capacity; contract builds allow GPU clusters to come online within 12 months.
Colocation specialists differentiate through high-density halls, immersion cooling, and 400 G fabric readiness. Digital Realty’s liquid-to-chip innovation supports 20 kW + racks, slashing TCO for AI tenants. Partnerships such as SK Telecom’s USD 200 million investment in SMART Global Holdings exemplify hybrid strategies that blend telco fiber assets with third-party design expertise. The South Korea hyperscale data center market therefore balances ownership economics against execution velocity.


By Component: Mechanical Infrastructure Drives Cooling Innovation
IT Infrastructure retained 45% of spending in 2024, reflecting surging GPU adoption and next-generation network cards. Mechanical infrastructure posted a forecast-beating 12.06% CAGR through 2030 as liquid and hybrid cooling became mandatory for 20 kW racks. Electrical upgrades, including busway power distribution and modular UPS, underpin AI cluster reliability, while DCIM tools provide telemetry for workload orchestration.
Samsung CandT’s underwater cooling feasibility study signals a paradigm shift toward seawater heat-exchange for waterfront campuses. Digital Edge and Donghwa ES advance super-capacitor storage that operates at 65 °C, reducing cooling dependency and eliminating lithium-ion fire risk. As AI densities climb, mechanical systems anchor value creation within the South Korea hyperscale data center market size.
By Tier Standard: Tier IV Growth Reflects AI Reliability Requirements
Tier III accounted for 72% of 2024 capacity, yet Tier IV facilities clock a 13.01% CAGR to 2030 as training clusters cannot tolerate unscheduled outages. Operators justify the redundancy premium by benchmarking downtime risk against lost GPU cycles that can exceed USD 3 million per multi-week training run.
Compliance with seismic and fire protection codes increases capex, but multi-tenanted AI tenants demand certified fault tolerance. Design automation for fire-protection systems and liquefaction GIS mapping streamline permit approvals, accelerating Tier IV adoption in Chungcheong green-field sites. These shifts elevate the South Korea hyperscale data center market toward mission-critical specifications.
By End-User Industry: BFSI Acceleration Driven by Regulatory Compliance
Cloud and IT entities held 50% revenue in 2024, yet BFSI logs a 12.9% CAGR via data-residency mandates and AI-powered risk scoring. Telecom operators expand 5G core and mobile-edge workloads, while media and entertainment scale transcoding pipelines for UHD streaming.
Manufacturers digitize smart-factory lines; LG Electronics targets KRW 1 trillion smart-factory revenue by 2030. Government agencies migrate 10,000 systems to cloud-native stacks under the Digital Platform initiative, sustaining sovereign demand for the South Korea hyperscale data center industry.

By Data Center Size: Mega Facilities Lead AI Infrastructure Scale
Massive sites represented half of 2024 capacity, yet mega complexes (greater than 60 MW) project a 14% CAGR to 2030. SK Telecom and AWS’s Ulsan build starts at 103 MW with a roadmap to 1 GW, illustrating scale draw. Fir Hills’ 3 GW Jeollanam-do approval confirms investor appetite for gigawatt campuses. Large facilities (≤ 25 MW) still meet edge and disaster-recovery niches but cede volume to mega farms optimized for AI economics.
Geography Analysis
Seoul Capital Area commanded roughly 60% of 2024 investment due to enterprise clustering and submarine-cable landings. However, grid congestion and escalating real-estate prices trigger a 1.8% CAGR drag on new builds, pushing spill-over to adjacent regions. KEPCO connection delays extend go-live timelines, prompting developers to pre-reserve transformer capacity years in advance.
Chungcheong records the fastest growth as land costs remain 30-40% lower and sub-stations possess spare capacity. Naver’s 270 MW GAK Sejong campus illustrates how operators leverage proximity to Seoul while sidestepping permitting gridlock. Local governments in Cheonan and Asan provide tax abatements and expedited zoning, amplifying attractiveness for second-wave builds. The region’s tempered seismic profile also reduces structural-reinforcement premiums, further buoying returns for Tier IV aspirants within the South Korea hyperscale data center market.
Yeongnam and Honam coastal corridors attract mega-facility proposals anchored to offshore-wind PPAs. Ulsan offers LNG-peaking plants for firm power, and Busan’s cable density supports trans-Pacific redundancy. Yet seismic-grade mandates and higher typhoon exposure inflate CAPEX. Gangwon leverages cooler ambient-air temperatures, cutting chiller costs by up to 10%, while Jeju’s geographic isolation appeals to disaster-recovery workloads despite limited grid tie-in.
Mordor Intelligence evaluates the hyperscale data center market across all key regional markets, including North America, Middle East, and Africa, with deeper country-level insights covering India, Indonesia, United States, Saudi Arabia, South Africa, and Chile.
Competitive Landscape
The South Korea hyperscale data center market features moderate concentration: the top six operators controlled approximately 45% of installed MW in 2024. Domestic telcos SK Telecom, KT, and LG Uplus capitalize on fiber backbones and 5G edge traffic, while global clouds AWS, Microsoft, and Google focus on sovereign-AI assurances. Naver Cloud and Kakao elevate competitive stakes using Korean-language LLMs and government contracts.
Strategically, SK Telecom’s equity in SMART Global Holdings and cooperation with SK Hynix signify vertical integration from chips to racks, reducing supply-chain risk. Digital Realty and Equinix counter by rolling out immersion-ready halls and sovereign-cloud cages that bypass U.S. export-control hurdles. AI-specialist entrants pitch super-hot aisle and direct-to-chip immersion cooling that surpass 80 kW per cabinet, staking claims in next-generation clusters.
White-space exists in regional edge nodes, compliance-ready colocation for BFSI, and heat-recovery micro-grids that supply district heating. Operators adopting closed-loop water systems and hybrid super-capacitor storage secure ESG-credentialed tenants and public-sector contracts. Consequently, rivalry centers on technology differentiation rather than price alone, sustaining margins despite rapid capacity additions.
South Korea Hyperscale Data Center Industry Leaders
Amazon Web Services, Inc.
Google LLC
Microsoft Corporation
NEXTDC Ltd.
AirTrunk Operating Pty Ltd.
- *Disclaimer: Major Players sorted in no particular order

Recent Industry Developments
- July 2025: South Korea launched a USD 1.1 billion GPU program targeting 15,000 GPUs for national AI computing capabilities, with Naver and Kakao competing for slots DIGITIMES.COM.
- June 2025: SK Group and AWS announced a USD 6.5 billion partnership to build Korea’s largest AI data center in Ulsan featuring 60,000 GPUs and 103 MW capacity REUTERS.COM.
- May 2025: Digital Realty unveiled liquid-to-chip cooling support enabling racks above 20 kW for AI workloads DIGITALREALTY.COM.
- March 2025: SoftBank began constructing a next-generation submarine cable linking Asia and the U.S. SOFTBANK.JP.


Research Methodology Framework and Report Scope
Market Definitions and Key Coverage
Our study defines the South Korea hyperscale data center market as all newly built or leased facilities in the country that provide a minimum contiguous IT load of 4 MW, support thousands of servers, and deploy cloud-grade automation, high-density (≥20 kW-per-rack) cooling, and multi-feed power to meet the scalability needs of global cloud and AI workloads. According to Mordor Intelligence, revenue generated from both self-build campuses and hyperscale-class colocation halls is counted; ancillary enterprise, on-premise, and edge facilities are intentionally left out.
Scope exclusion: Edge micro-sites below 4 MW and traditional enterprise data centers are out of scope.
Segmentation Overview
- By Data Center Type
- Hyperscale Self-build
- Hyperscale Colocation
- By Component
- IT Infrastructure
- Server Infrastructure
- Storage Infrastructure
- Network Infrastructure
- Electrical Infrastructure
- Power Distribution Units
- Transfer Switches and Switchgears
- UPS Systems
- Generators
- Other Electrical Infrastructure
- Mechanical Infrastructure
- Cooling Systems
- Racks
- Other Mechanical Infrastructure
- General Construction
- Core and Shell Development
- Installation and Commissioning Services
- Design Engineering
- Fire Detection, Suppression and Physical Security
- DCIM / BMS Solutions
- IT Infrastructure
- By Tier Standard
- Tier III
- Tier IV
- By End-User Industry
- Cloud and IT
- Telecom
- Media and Entertainment
- Government
- BFSI
- Manufacturing
- E-Commerce
- Other End-users
- By Data Center Size
- Large (Less than or equal to 25 MW)
- Massive (Greater than 25 MW and Less than equal to 60 MW)
- Mega (Greater than 60 MW)
Detailed Research Methodology and Data Validation
Primary Research
Mordor analysts interviewed facility engineers in Seoul and Chungcheong, cloud procurement heads, real-estate brokers brokering hyperscale plots, and power-equipment vendors. These conversations helped us test utilization assumptions, confirm average contract prices, and understand delivery timelines that secondary material could not capture.
Desk Research
We began by mapping the installed and planned IT load using public filings from the Korea Data Center Council, grid-connection approvals released by Korea Electric Power Corporation, and Digital New Deal budget documents from the Ministry of Science and ICT. Trade statistics on chilled-water modules and generators from the Korea Customs Service, academic papers in the Korean Journal of Electrical Engineering covering rack-level power density, and company financials accessed through D&B Hoovers supplemented facility-level benchmarks. Additional context came from reputable press releases and investor presentations that disclosed campus-scale capex. The sources cited above are illustrative; many other open-source publications contributed to data gathering, validation, and clarification.
Market-Sizing & Forecasting
A top-down model converts national hyperscale IT-load capacity into revenue by applying weighted average service-level pricing, which is then corroborated with selective bottom-up roll-ups of disclosed campus capex and sampled US$/kW lease rates. Key variables like annual grid-connected megawatts, average rack density, Seoul land-cost index, electricity tariff trends, announced AI-GPU cluster sizes, and hyperscale capex commitments feed a multivariate regression that projects demand through 2031. Missing bottom-up inputs are bridged using capacity-weighted ASP proxies validated during primary research.
Data Validation & Update Cycle
Outputs pass variance checks against third-party installation tallies, energy-consumption norms, and historical currency averages. Senior analysts review anomalies before sign-off. Reports refresh annually, and interim updates follow major capacity announcements or regulatory changes, ensuring clients always receive an up-to-date view.
Why Mordor's South Korea Hyperscale Data Center Baseline Commands Reliability
Published estimates often diverge because firms slice the market differently, convert currencies on dissimilar dates, or refresh data at uneven intervals. By selecting a consistent hyperscale threshold, using live KRW-USD rates, and revisiting capacity pipelines every quarter, Mordor Intelligence minimizes such noise.
Key gap drivers stem from scope breadth, price-escalation logic, and refresh cadence. Some publishers exclude colocation-based hyperscale halls or apply flat power-price escalators, while others blend enterprise-class sites into totals; both approaches distort today's AI-driven densification reality.
Benchmark comparison
| Market Size | Anonymized source | Primary gap driver |
|---|---|---|
| USD 4.47 B (2025) | Mordor Intelligence | |
| USD 1.03 B (2024) | Global Consultancy A | Counts only cloud-owned campuses and omits colocation hyperscale halls, ignoring the current lease-driven expansion wave |
| USD 3.93 B (2024) | Regional Consultancy B | Mixes large enterprise sites with hyperscale, applies uniform 8% ASP uplift, and uses annual-average FX instead of spot rates |
These comparisons show that our disciplined scope definition, variable-level modeling, and frequent refresh cycle deliver a balanced, transparent baseline that decision-makers can trace to verifiable capacity metrics and repeatable steps.


Key Questions Answered in the Report
How big is the South Korea hyperscale data center market in 2025?
The market is valued at USD 4.47 billion in 2025 with installed IT load of 1,863.97 MW.
What is the projected CAGR for the South Korea hyperscale data center market through 2031?
The compound annual growth rate is forecast at 11.56%, lifting market value to USD 8.62 billion by 2031.
Which segment grows the fastest in terms of deployment model?
Hyperscale colocation shows the highest growth at 11.6% CAGR as operators favor rapid GPU capacity roll-outs.
Why is BFSI the fastest-growing vertical?
Financial-data residency mandates and AI-driven risk-analytics adoption push BFSI workloads at a 12.9% CAGR.
Which region offers the most attractive growth prospects?
Chungcheong leads future growth due to land availability, supportive zoning, and proximity to Seoul without grid congestion.
What technological shift most influences mechanical-infrastructure spending?
The transition from air to liquid-to-chip cooling for 20 kW + racks propels mechanical-infrastructure growth at 12.06% CAGR.
Page last updated on:


