Philippines Hyperscale Data Center Market Size and Share
Market Overview
| Study Period | 2019 - 2031 |
|---|---|
| Forecast Data Period | 2025 - 2031 |
| Historical Data Period | 2019 - 2023 |
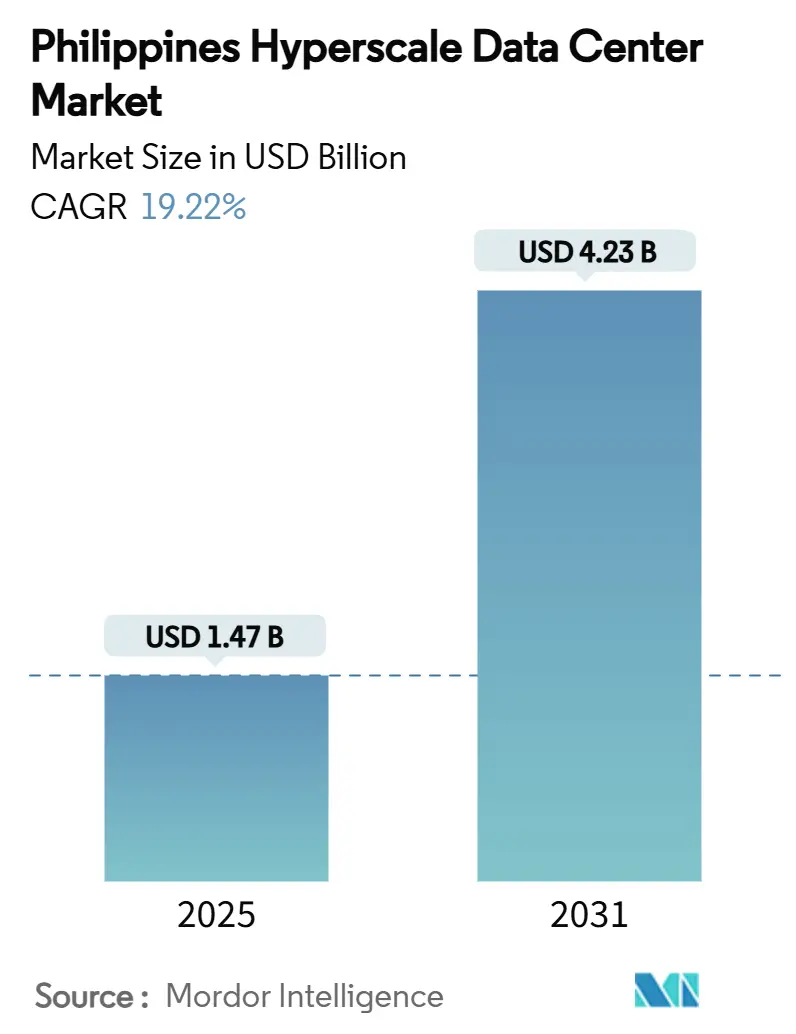
| Market Size (2025) | USD 1.47 Billion |
| Market Size (2031) | USD 4.23 Billion |
| Growth Rate (2025 - 2031) | 19.22% CAGR |
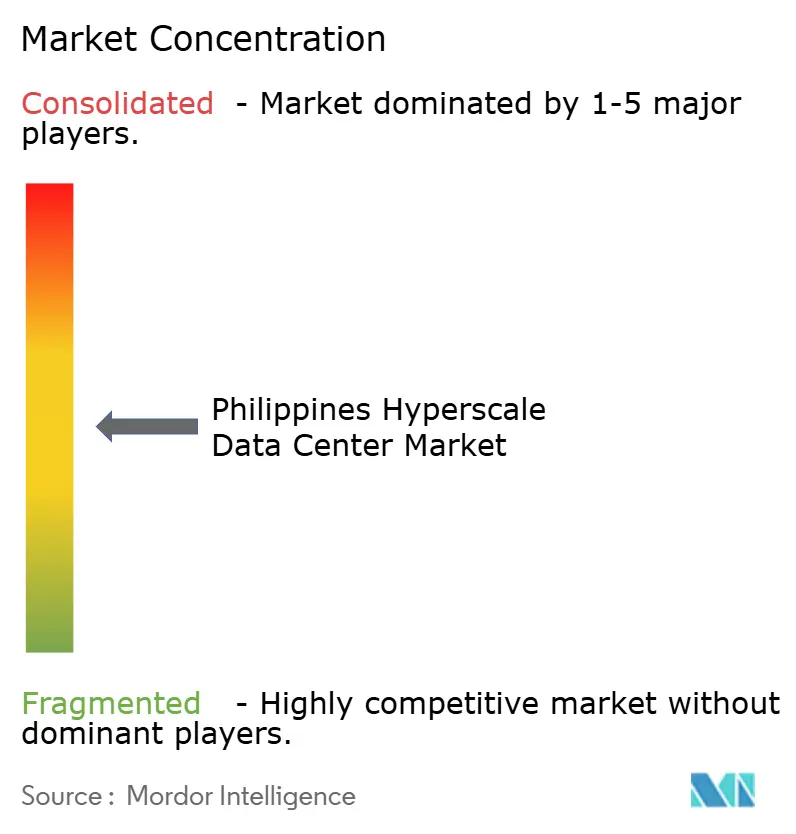
| Market Concentration | Medium |
Major Players *Disclaimer: Major Players sorted in no particular order Image © Mordor Intelligence. Reuse requires attribution under CC BY 4.0. | |
Philippines Hyperscale Data Center Market Analysis by Mordor Intelligence
The Philippines hyperscale data center market size stood at USD 1.473 billion in 2025 and is projected to reach USD 4.233 billion by 2031, registering a 19.22% CAGR over the forecast period. Installed IT load is forecast to rise from 520.80 MW in 2025 to 1,680.95 MW by 2031, expanding at a 21.57% CAGR and underscoring the sector’s capital-intensity and power dependence. This growth trajectory is propelled by government digitalization mandates, new trans-Pacific subsea cables, and foreign direct investment that collectively position the archipelago as Southeast Asia’s next hyperscale hub. Commodity colocation revenues are beginning to lag volume expansion, indicating a maturing service stack in which premium, AI-ready halls carry significantly higher margins. Metro Manila remains the prime hub, yet the January 2024 Mindanao-Visayas Interconnection Project (MVIP) now enables distributed capacity planning across a unified national grid, lowering disaster-recovery latency while unlocking renewable power purchase agreements in Visayas and Mindanao.
Key Report Takeaways
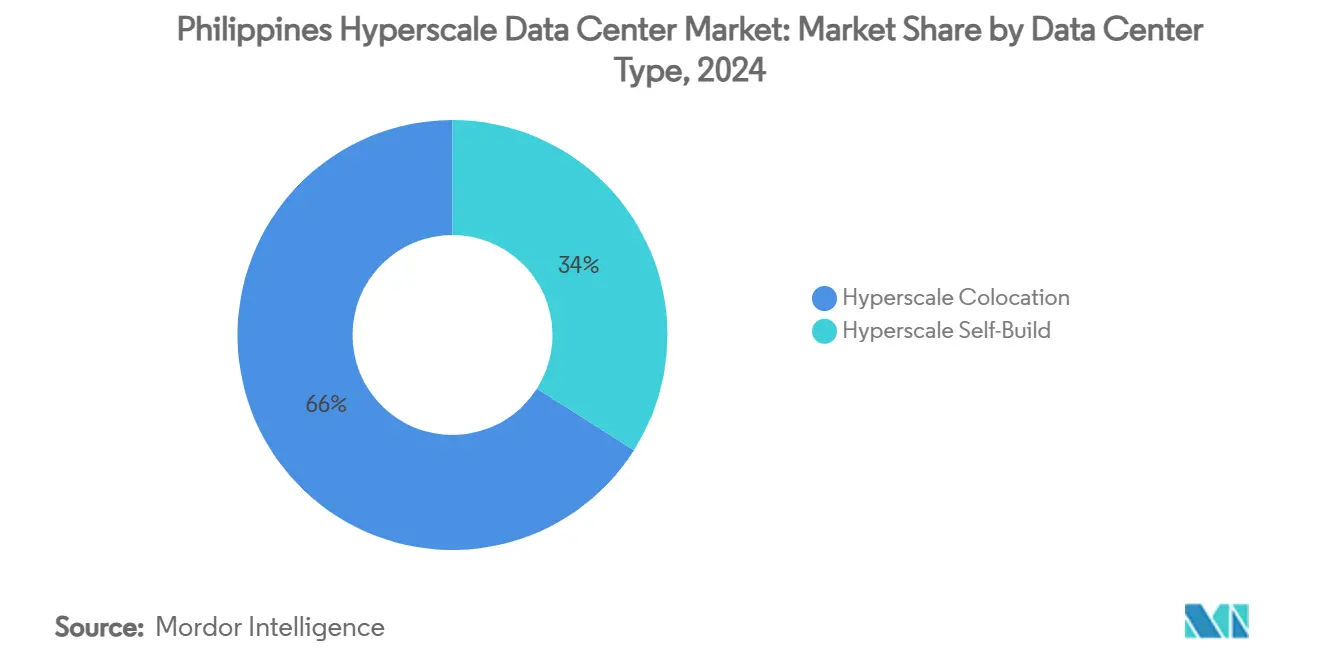
- By data center type, hyperscale colocation held 66% of the Philippines hyperscale data center market share in 2024, while self-build projects are forecast to deliver the fastest 19.5% CAGR through 2030.
- By component, electrical systems captured 36.1% of 2024 spending, whereas mechanical systems anchored by liquid cooling are projected to expand at 19.2% CAGR to 2030.
- By tier standard, Tier III sites accounted for 83.05% of capacity in 2024; Tier IV is expected to post a 21.5% CAGR on the back of AI and high-frequency trading workloads.
- By end-user industry, cloud and IT services commanded 44% of 2024 demand, yet e-commerce workloads are on track for a 20% CAGR, driven by platforms that need low-latency edge nodes.
- By data center size, massive facilities represented 45% of installed capacity in 2024, whereas mega campuses should accelerate at 19.8% CAGR through 2030.
Philippines contributes to an international system whose character is defined by the collective interaction of multi-country, multi-region parts. Our global hyperscale data center market report represents that combined structure.
Philippines Hyperscale Data Center Market Trends and Insights
Drivers Impact Analysis*
| Driver | (~) % Impact on CAGR Forecast | Geographic Relevance | Impact Timeline |
|---|---|---|---|
| Cloud-native adoption surge among Philippine enterprises | +4.2% | National, early gains in Metro Manila, Cebu, Davao | Medium term (2-4 years) |
| Rapid growth in video streaming and gaming traffic | +3.8% | National, urban clusters | Short term (≤2 years) |
| Government data-localization and DICT digitalization incentives | +3.1% | National, BFSI compliance | Long term (≥4 years) |
| Trans-Pacific subsea cable landings catalyzing hyperscaler footprints | +2.9% | Luzon coasts, spillover to Visayas | Medium term (2-4 years) |
| Visayas–Mindanao grid tie-up enabling renewable PPAs | +2.2% | Visayas and Mindanao | Long term (≥4 years) |
| Brown-field mall-to-DC conversions lowering land-acquisition costs | +1.6% | Metro Manila suburbs | Short term (≤2 years) |
| Source: Mordor Intelligence | |||
Cloud-native adoption surge among Philippine enterprises
Enterprises are shifting from lift-and-shift migration toward cloud-native architectures that demand hyperscale elasticity, as highlighted by UnionBank’s 100% digital banking pivot that lifted revenue twelve-fold while raising data-quality metrics from 35% to 100%.[1]Informatica, “Union Bank of the Philippines,” informatica.com Bangko Sentral’s cloud-first guidance, coupled with Asia United Bank’s 20% power-draw reduction after deploying hyper-converged infrastructure, illustrates how efficiency gains justify premium rack rates. Enterprise ICT spending is forecast to climb 10.9% annually to USD 34.9 billion by 2028, forming a demand floor for new hyperscale halls.
Rapid growth in video streaming and gaming traffic
Filipinos average 10 hours of daily internet use, spiking during evening peaks that overwhelm legacy capacity. Subscription data show 82.22% of 6.4 million streaming users hold active accounts on platforms such as Netflix and HBO GO, underlining the need for large-footprint content-delivery nodes. Globe Telecom had to activate 1,300 new cell sites to manage a 12% holiday traffic surge, demonstrating how consumer behavior directly triggers core-network and data-center capex. These content dynamics explain why facilities in the 25-60 MW class captured the largest slice of 2024 capacity.
Government data-localization and DICT digitalization incentives
DICT’s Digital National ID system has issued 85 million IDs and enabled 100 million transactions, anchoring sovereign-data rules that require hyperscale-grade domestic hosting. The National Cybersecurity Plan 2023-2028 compels state contractors to maintain Tier III certifications, while BSP Circular 982 sets compliance triggers that favor professionally managed hyperscale colocation. These mandates reinforce premium pricing for compliant facilities.
Trans-Pacific subsea cable landings catalyzing hyperscaler footprints
PLDT’s USD 75 million Asia Direct Cable, Google’s TPU link, and Facebook-backed Luzon Bypass systems collectively add hundreds of terabits of capacity that shorten latency to North America and North Asia.[2]PLDT, “PLDT builds $75 M PH link of Asia Direct Cable,” pldtenterprise.com Each new landing enhances Luzon’s investment gravity, fostering network effects that pull additional hyperscale builds.
Restraints Impact Analysis*
| RESTRAINTS | (~) % IMPACT ON CAGR FORECAST | GEOGRAPHIC RELEVANCE | IMPACT TIMELINE |
|---|---|---|---|
| Grid power-availability constraints in Metro Manila | −2.8% | Metro Manila and nearby provinces | Short term (≤2 years) |
| Typhoon and flooding exposure elevating DR/BCP costs | −1.9% | National, high in Luzon and Visayas | Medium term (2-4 years) |
| Bureau of Fire Protection delays for lithium-ion UPS clearance | −1.2% | National | Short term (≤2 years) |
| Scarcity of liquid-cooling–skilled workforce | −0.8% | National, technical roles | Long term (≥4 years) |
| Source: Mordor Intelligence | |||
Grid power-availability constraints in Metro Manila
National Grid Corporation warnings of intensifying peak-load deficits illustrate a structural shortfall that leaves little headroom for hyperscale infill. First Gen is negotiating 180 MW of supply agreements yet currently serves only 17.4 MW across 11 facilities, revealing a demand-capacity gap that limits campus sizing and inflates PPA premiums.[3]Kris Crismundo, “First Gen eyes 180 MW data center power deals,” Philippine News Agency, pna.gov.ph Operators therefore cap design loads at 25-60 MW blocks to fit within local sub-station ratings.
Typhoon and flooding exposure elevating DR/BCP costs
Average annual typhoon counts compel dual-region or tri-region redundancy, increasing both capex and opex. Vertiv and STT GDC promote liquid-cooling suites that remain operational despite ambient-temperature spikes, yet such systems raise engineering-talent requirements and up-front costs. The MVIP grid tie-up offers partial resilience by enabling load transfers but does not fully mitigate transmission-line exposure.
*Our forecasts treat driver/restraint impacts as directional, not additive. The impact forecasts reflect baseline growth, mix effects, and variable interactions.
Segment Analysis
By Data Center Type: Self-Build Momentum Accelerates
Self-build projects are forecast to post a 19.5% CAGR as hyperscalers customize high-density AI halls that legacy colocation designs struggle to accommodate. ENDECGROUP’s USD 2.7 billion Narra Technology Park, a 300 MW campus in Tarlac, typifies this direction with 100% renewable commitments and a 2026 go-live date. Although colocation retains 66% of the Philippines hyperscale data center market share today, global cloud providers increasingly anchor ecosystems with proprietary builds and then lease edge nodes from local operators, creating a symbiotic rather than zero-sum relationship. The Philippines hyperscale data center market therefore splits into bespoke core campuses and multi-tenant edge sites positioned close to consumer clusters.
Colocation resiliency persists because domestic enterprises lack capital for self-builds and prefer outsourcing power-price risk, compliance, and 24 × 7 staffing. PLDT’s 50 MW VITRO Sta. Rosa launch lifted its nationwide capacity above 100 MW and showcased value-add services around inter-metro fiber rings that hyperscalers alone cannot replicate. The Philippines hyperscale data center market size for colocation is thus forecast to remain above USD 2 billion by 2031, even as the self-build cohort grows faster.


By Component: Electrical Infrastructure Drives Current Spending
Electrical systems absorbed 36.1% of 2024 outlays as operators raced to secure dual-fed substations, static-switch PDUs, and lithium-ion UPS strings certified by the Bureau of Fire Protection. Each incremental megawatt of critical IT load requires up to 1.9 MW of delivered utility power once losses and redundancy are included, elevating the strategic value of switchgear and generator sets in budget allocations. The Philippines hyperscale data center market size tied to electrical packages exceeded USD 530 million in 2024 and should keep pace with capacity additions through 2031.
Mechanical systems will outpace at 19.2% CAGR because direct-to-chip liquid cooling and rear-door heat exchangers enable rack densities above 50 kW, which are indispensable for AI training clusters. STT GDC’s Makati showroom shows Dell PowerEdge nodes rejecting up to 80% of heat through coolant loops, cutting PUE targets to 1.15 in tropical conditions. This shift realigns skill-sets toward fluid-dynamics engineers and chemical-treatment specialists, a mismatch that underpins the −0.8% restraint score on labor scarcity.
By Tier Standard: Tier IV Gains Premium Positioning
Tier III remains the baseline with an 83.05% share, driven by multi-tenant halls serving enterprise disaster-recovery workloads that can tolerate limited downtime. Nonetheless, financial-services latency requirements and AI model-training SLA penalties are catalyzing a 21.5% CAGR in Tier IV footprints. STT Fairview 1, slated for a Q2 2025 opening, couples 124 MW of capacity with 2N+1 redundancy and dark-fiber paths along separate rights-of-way, appealing to algorithmic trading desks and GPU farms.
The Philippines hyperscale data center market size attached to Tier IV halls is projected to cross USD 1.1 billion by 2031 as banks, payment processors, and maritime-satellite operators upgrade to 99.995% availability thresholds. Tier III will still dominate campus counts but will shift toward edge nodes where cost efficiency trumps micro-reliability gains.
By End-User Industry: E-Commerce Disrupts Traditional Patterns
Cloud and IT workloads generated 44% of 2024 demand, reflecting persistent SaaS adoption and domestic IaaS launches. Shopee-backed SPX Express now processes 3 million parcels daily at its Calamba automation hub, requiring micro-second inventory updates and hence regional edge zones with sub-20 ms round-trip latency. E-commerce therefore exhibits a 20% CAGR, the fastest among tracked verticals.
The banking sector deepens digital engagement through UnionBank’s open banking APIs and BPI’s containerized workloads, locking hyperscale tenancy into BSP-regulated SLA tiers. Manufacturing take-up accelerates via Industry 4.0 pilots that rely on real-time analytics and machine-vision quality control, further diversifying demand. Collectively these shifts ensure the Philippines hyperscale data center market continues to diversify beyond its cloud-centric origins without diluting average rack-power draw.


By Data Center Size: Mega Facilities Target Hyperscaler Demand
Massive blocks between 25 MW and 60 MW make optimal use of Metro Manila sub-station quotas, translating into 45% of installed capacity in 2024. Operators deploy these builds in modular 5-MW increments to sync with permit cycles and pare capex risk. Conversely, mega campuses above 60 MW—such as the 300 MW Narra Technology Park—are forecast to show the fastest 19.8% CAGR as greenfield energy corridors in Central Luzon and Mindanao unlock scale economics.
The Philippines hyperscale data center market share for mega sites will climb as soon as grid-connection lead times fall below 36 months and renewable PPAs reach price parity with coal-fired supply. Until then, massive sites will dominate Luzon, while mega growth will favor low-cost provinces with direct access to hydro or solar clusters.
Geography Analysis
Luzon anchors the Philippines hyperscale data center market with multiple cable landing stations, the nation’s densest enterprise base, and ready access to skilled labor. PLDT’s Asia Direct Cable and Google’s TPU link give the region low-latency North-Asian paths, prompting both Equinix and Digital Edge to choose Luzon for initial footprints. STT GDC situates its 124 MW flagship in Quezon City to balance metro proximity and suburban land pricing, demonstrating how operators navigate zoning constraints while chasing customer aggregation. Yet endemic brownouts and typhoon risk elevate operating expenses, nudging incremental capacity to suburbs like Laguna and Cavite where power-firmed industrial parks offer tiered redundancy.
Visayas is rising as the nation’s secondary cluster following MVIP completion. Converge ICT’s Cebu facility, with 300 racks and an integrated customer-service hub, addresses mounting regional demand from manufacturing exporters and the BPO sector. Renewable projects totaling 1,982 MW—38.37% solar and 26.01% wind—create tariff-hedging options, positioning Visayas as a green-power alternative for sustainability-driven hyperscalers. Improved grid redundancy now allows load shifts from Metro Cebu to Panay during brownouts, cooling investor concerns over single-island dependence.
Mindanao is the frontier, combining abundant hydroelectric generation and land costs up to 60% lower than Metro Manila. PLDT recently laid 300 km of underground fiber that raised regional loop capacity to 400 Gbps, neutralizing historical connectivity deficits. Cagayan de Oro is forecast to become the fourth-largest metro by 2025, offering a vanguard location for edge campuses serving agri-processing and logistics exporters. As MVIP scales toward 900 MW, Mindanao can back-feed Luzon during peak summer loads, granting it a strategic role in national disaster-recovery architectures.
The hyperscale data center market is analyzed by Mordor Intelligence across multiple other geographies, with in-depth regional assessments available for Middle East, Africa, and South America. This is complemented by country-specific insights for Vietnam, Japan, Israel, South Africa, Brazil, and Canada, reflecting various localized market behavior and policy environments' coverage.
Competitive Landscape
The Philippines hyperscale data center market remains moderately fragmented. PLDT’s VITRO network leads with an aggregate 100 MW footprint that leverages extensive terrestrial and subsea fiber rings to cross-sell transport and edge caching. Globe Telecom counters through a joint venture with STT GDC and Ayala, merging carrier assets with the latter’s property banking to lower land-assembly hurdles.
International specialists pursue buy-versus-build strategies: Equinix entered via a USD 41.1 million takeover of three Total Information Management sites, instantly plugging its global IBX platform into Philippine networks. Digital Edge and SpaceDC plan mega campuses designed around 100% renewables and high-density liquid cooling to pre-position for AI workloads.
Differentiation pivots on advanced thermal management, sovereign-cloud compliance, and renewable PPA structures. Operators showcasing liquid-cooling ecosystems—such as STT GDC’s Makati showroom—signal readiness for >50 kW racks and attract early-stage AI tenants. Meanwhile, brown-field mall conversions entice domestic mid-caps by offering shorter lead times and lower lease-rates, creating a two-tier market in which large foreign hyperscalers gravitate to purpose-built campuses while local enterprises opt for re-purposed urban shells.
Philippines Hyperscale Data Center Industry Leaders
ST Telemedia GDC Philippines
Digital Edge Philippines
Equinix Philippines
Globe Telecom / Innove
PLDT (VITRO Data Centers)
- *Disclaimer: Major Players sorted in no particular order

Recent Industry Developments
- May 2025: STT GDC Philippines launched the country’s first Liquid Cooling Technology Showroom in Makati City, partnering with Vertiv, Dell Technologies, and Novare to demo direct-to-chip cooling that removes up to 80% of server heat.
- May 2025: PLDT inaugurated its 50 MW VITRO Sta. Rosa campus, raising group capacity past 100 MW and targeting global cloud tenants.
- May 2025: ENDECGROUP secured a 50-year lease for its USD 2.7 billion, 300 MW Narra Technology Park in New Clark City, slated for Q4 2026 operation.
- March 2025: Beeinfotech PH opened its HIVE Hybrid Data Center in Manila, delivering 3,600 racks at Tier 3+ resiliency for AI and colocation clients.


Research Methodology Framework and Report Scope
Market Definitions and Key Coverage
Our study defines the Philippines hyperscale data center market as all newly built or expanded facilities in the country that provide a minimum contiguous IT load of four megawatts and above, engineered for large-scale cloud, AI, and content workloads. Capacity and revenue from multi-tenant colocation halls leased wholesale to hyperscalers are counted once they cross the same four-megawatt threshold.
Scope exclusion: enterprise, edge, and retail colocation sites below four megawatts are outside this market.
Segmentation Overview
- By Data Center Type
- Hyperscale Self-build
- Hyperscale Colocation
- By Component
- IT Infrastructure
- Server Infrastructure
- Storage Infrastructure
- Network Infrastructure
- Electrical Infrastructure
- Power Distribution Units
- Transfer Switches and Switchgears
- UPS Systems
- Generators
- Other Electrical Infrastructure
- Mechanical Infrastructure
- Cooling Systems
- Racks
- Other Mechanical Infrastructure
- General Construction
- Core and Shell Development
- Installation and Commissioning Services
- Design and Engineering
- Fire Detection, Suppression and Physical Security
- DCIM/BMS Solutions
- IT Infrastructure
- By Tier Standard
- Tier III
- Tier IV
- By End-User Industry
- Cloud and IT
- Telecom
- Media and Entertainment
- Government
- BFSI
- Manufacturing
- E-Commerce
- Other End Users
- By Data Center Size
- Large ( Less than or equal to 25 MW)
- Massive (Greater than 25 MW and Less than equal to 60 MW)
- Mega (Greater than 60 MW)
Detailed Research Methodology and Data Validation
Primary Research
Mordor analysts interviewed facility engineers, design-build contractors, and cloud procurement leads across Luzon, Visayas, and Mindanao to cross-check utilization ramps, benchmark achievable PUE, and validate land plus power costs that rarely appear in documents. Insights from these calls resolved conflicting rack-density assumptions and refined our base price per installed kilowatt.
Desk Research
We began with public domain datasets such as the Department of Information and Communications Technology (DICT) capacity pipeline tracker, National Grid power alert logs, Bureau of Customs generator imports, and Bangko Sentral quarterly foreign direct investment filings. Trade bodies like the Asia Cloud Computing Association and the Philippine Statistics Authority supplied cloud adoption, bandwidth, and e-commerce indicators. Company 10-Ks, environmental disclosures, and press releases enriched price and construction timelines, while paid access to D&B Hoovers and Dow Jones Factiva helped us verify operator financials and project milestones. The sources listed are illustrative only; many additional references informed our work.
Market-Sizing & Forecasting
A top-down capacity-reconstruct model converts announced megawatts into revenue using weighted average ramp curves, service mixes, and achievable price per kilowatt; it is then corroborated with sampled bottom-up checks on supplier shipments. Key variables include submarine-cable ready-for-service dates, hyperscaler lease take-up, renewable power tariffs, import duty shifts, average sellable rack density, and lithium-ion UPS penetration. Forecasts employ multivariate regression against GDP-linked cloud spending, 5G traffic, and data-localization mandates, producing annual values from 2025 to 2031. Gaps in operator disclosures are filled by applying region-specific cost-per-MW benchmarks normalized for currency and inflation.
Data Validation & Update Cycle
Outputs pass variance checks against historical IT load additions, are peer-reviewed by a second analyst, and are revisited whenever material events, grid alerts, new CREATE MORE incentives, or hyperscaler campus announcements occur. Reports refresh every twelve months, with interim snapshots issued if a larger than two-percent swing is detected.
Why Our Philippines Hyperscale Data Center Baseline Commands Reliability
Published estimates frequently diverge because firms mix edge, enterprise, or even storage hardware sales into what they label "hyperscale," apply different currency years, or rely on untested pricing curves.
Key gap drivers include varying segment inclusion, treatment of self-build depreciation, and refresh cadence. Mordor Intelligence fixes scope first, models only four-megawatt-plus sites, rolls foreign contracts into constant-year pesos before converting to U.S. dollars, and updates the model each year, which keeps our 2025 baseline clear and current.
Benchmark comparison
| Market Size | Anonymized source | Primary gap driver |
|---|---|---|
| USD 1.47 B (2025) | Mordor Intelligence | - |
| USD 0.63 B (2024) | Regional Consultancy A | Counts investment spend only and omits service revenue streams |
| USD 1.00 B (2024) | Trade Journal B | Blends enterprise, edge, and hyperscale without capacity threshold |
| USD 4.73 B (2024) | Global Consultancy C | Aggregates all data-center classes plus power gear value; optimistic ASP escalation |
The comparison shows that once like-for-like scope and pricing rules are applied, Mordor's disciplined approach yields a balanced, transparent baseline clients can track and reproduce confidently.


Key Questions Answered in the Report
What is the forecast revenue for the Philippines hyperscale data center market by 2031?
The sector is projected to reach USD 4.233 billion by 2031, growing at a 19.22% CAGR.
How fast is installed IT load expected to increase?
Capacity is set to climb from 520.80 MW in 2025 to 1,680.95 MW by 2031, marking a 21.57% CAGR
Which component segment is expanding the quickest?
Mechanical infrastructure, driven by liquid-cooling rollouts, is forecast to post a 19.2% CAGR to 2030.
Why are Tier IV facilities gaining traction?
AI training and high-frequency trading require 99.995% uptime, pushing Tier IV capacity to a 21.5% CAGR.
How does the MVIP influence regional data-center growth?
The interconnection unlocks 450 MW of transferable power, enabling distributed builds in Visayas and Mindanao while improving disaster resilience.
Which end-user vertical shows the fastest demand growth?
E-commerce workloads are on pace for a 20% CAGR as parcel volumes and edge-computing needs surge.
Page last updated on:


