Telecom Equipment Market Size and Share
Market Overview
| Study Period | 2020 - 2031 |
|---|---|
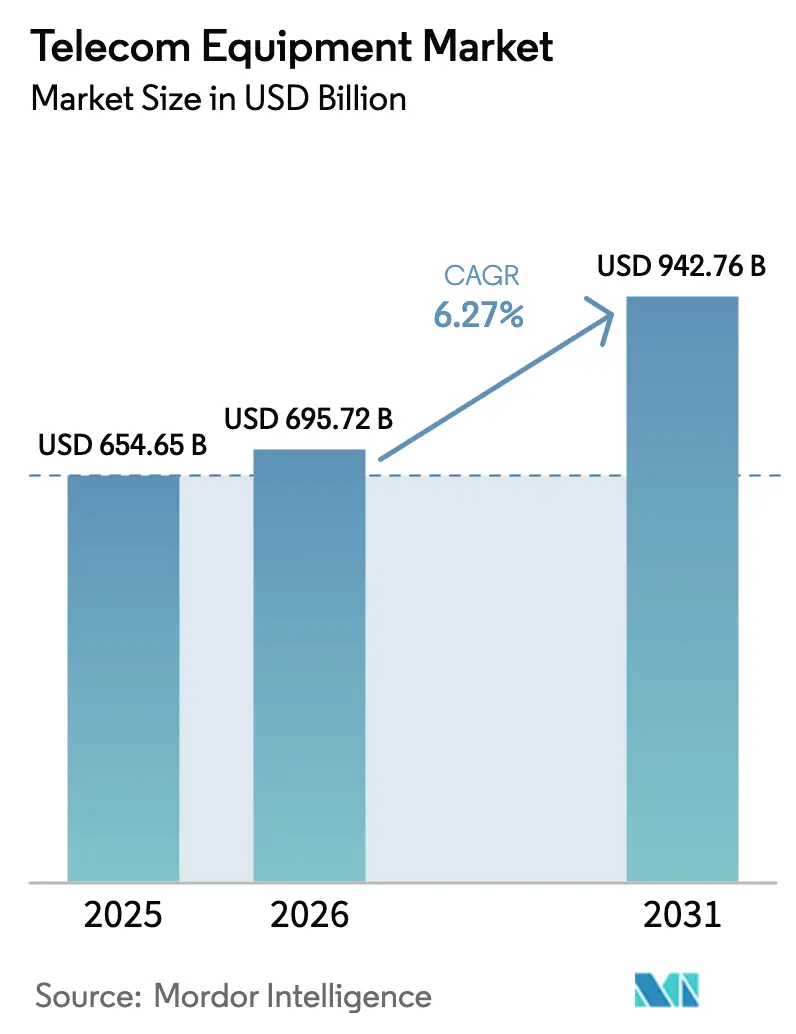
| Market Size (2026) | USD 695.72 Billion |
| Market Size (2031) | USD 942.76 Billion |
| Growth Rate (2026 - 2031) | 6.27% CAGR |
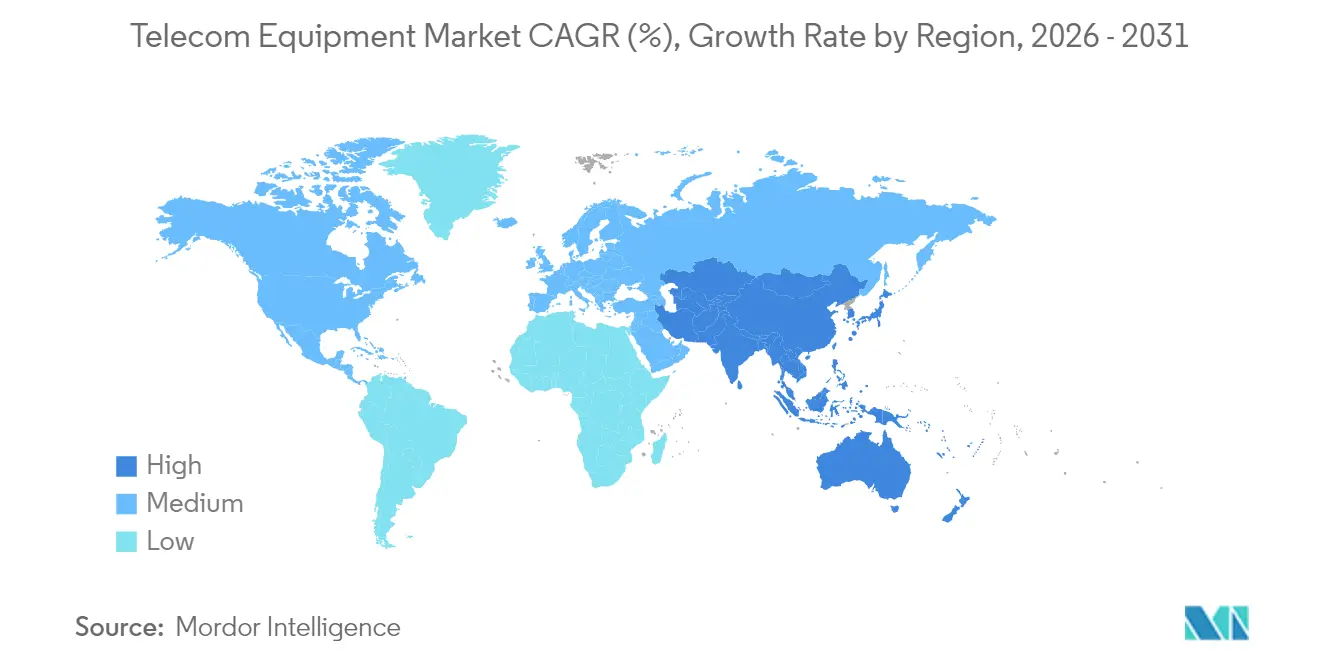
| Fastest Growing Market | Asia Pacific |
| Largest Market | North America |
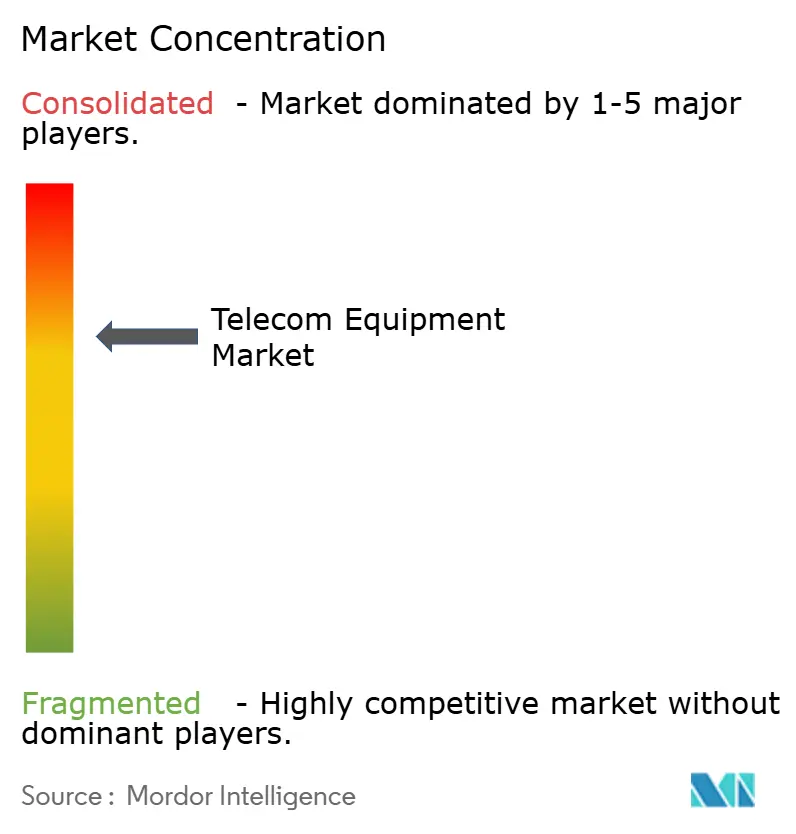
| Market Concentration | Medium |
Major Players *Disclaimer: Major Players sorted in no particular order Image © Mordor Intelligence. Reuse requires attribution under CC BY 4.0. | |
Telecom Equipment Market Analysis by Mordor Intelligence
The Telecom Equipment market size is expected to grow from USD 654.65 billion in 2025 to USD 695.72 billion in 2026 and is forecast to reach USD 942.76 billion by 2031 at 6.27% CAGR over 2026-2031.
Operators are accelerating migration from legacy 4G networks toward fully-fledged 5G standalone (SA) deployments, while governments inject sizeable broadband stimulus—USD 65 billion in the United States alone—to extend coverage and spur domestic manufacturing. Investments in coherent optical transport, cloud-native cores and Open RAN architectures intensify as data-center traffic, AI workloads and enterprise automation heighten bandwidth and latency demands. Concurrently, geopolitical vendor restrictions in Europe and North America re-shape supply chains, creating premium pricing power for Nordic and South Korean suppliers. The services component grows the fastest as carriers pursue managed deployment models that offset scarce engineering talent and complex multi-domain integration.
Key Report Takeaways
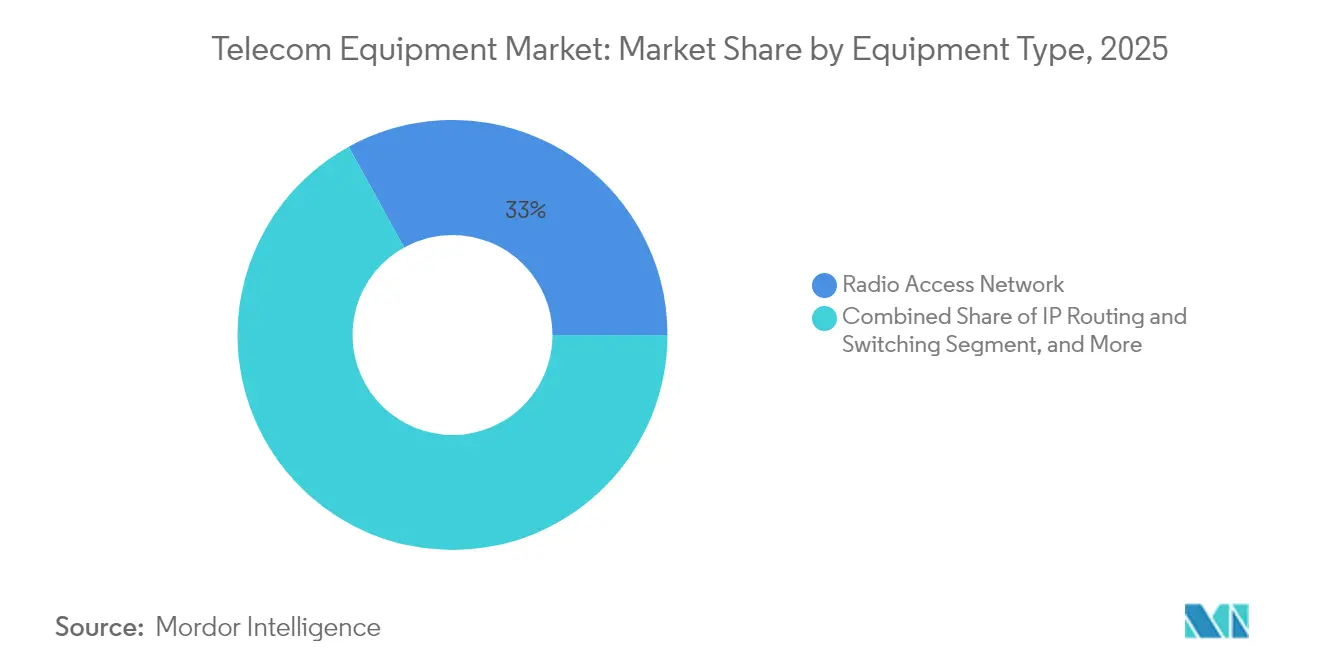
- By equipment type, Radio Access Network led with 33.02% revenue share in 2025; coherent optical transport is forecast to expand at a 9.32% CAGR through 2031.
- By technology generation, 4G/LTE accounted for 46.55% of the telecom equipment market share in 2025, while 5G SA equipment is advancing at a 20.35% CAGR through 2031.
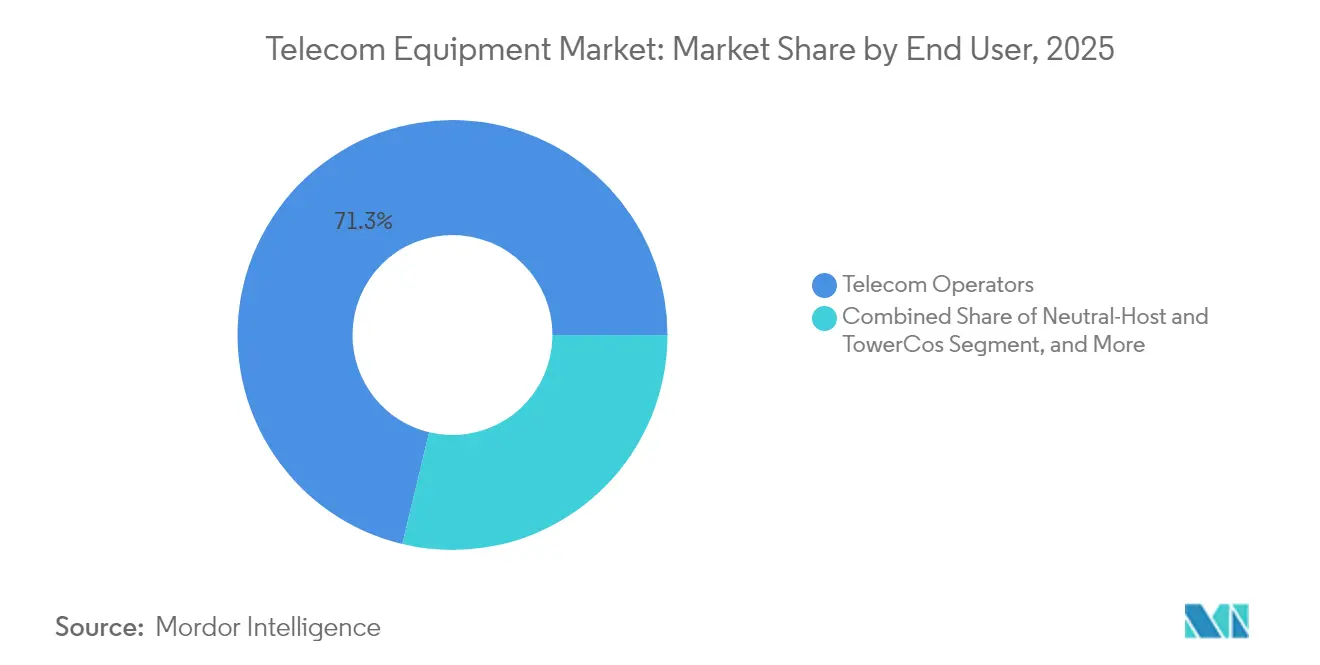
- By end-user, telecom operators held 71.25% share of the telecom equipment market size in 2025; private 5G enterprises are projected to grow at a 14.62% CAGR between 2026-2031.
- By component, software captured a 65.10% share of the telecom equipment market size in 2025, whereas services exhibit the highest CAGR at 19.35% through 2031.
- By geography, North America led with 38.45% revenue share in 2025; Asia-Pacific is poised to register a 20.25% CAGR to 2031.
Note: Market size and forecast figures in this report are generated using Mordor Intelligence’s proprietary estimation framework, updated with the latest available data and insights as of 2026.
Global Telecom Equipment Market Trends and Insights
Drivers Impact Analysis*
| Driver | (~) % Impact on CAGR Forecast | Geographic Relevance | Impact Timeline |
|---|---|---|---|
| Accelerated 5G Standalone roll-outs | +1.8% | Global, with APAC leading adoption | Medium term (2-4 years) |
| Growing data-traffic fuelled optical transport demand | +1.2% | North America and EU core, expanding to APAC | Long term (≥ 4 years) |
| Cloud-native network transformation (SDN / NFV) | +0.9% | Global, with enterprise focus in developed markets | Medium term (2-4 years) |
| Government-funded broadband stimulus projects | +0.7% | North America, EU, selective APAC markets | Short term (≤ 2 years) |
| Early Open RAN commercialisation | +0.6% | Europe and North America, pilot projects in APAC | Long term (≥ 4 years) |
| AI-driven network automation and self-optimisation | +0.5% | Global, concentrated in Tier-1 operator networks | Medium term (2-4 years) |
| Source: Mordor Intelligence | |||
Accelerated 5G Standalone Roll-outs Drive Infrastructure Refresh
Operators transitioning from 5G NSA to SA architectures must replace the entire core network, triggering comprehensive refresh cycles spanning radio, transport and packet-core domains [1]CMS Law, “5G Regulation and Law in South Korea,” cms.law. SK Telecom and Samsung validated SA Option 4 interworking that matches NSA performance, convincing carriers to prioritise SA for network slicing and ultra-low-latency services netmanias.com. Core equipment commands 30-40% price premiums over 4G nodes, lifting vendor average selling prices. Integrated equipment suites create vendor lock-in, favouring suppliers that deliver radio, core and orchestration in one stack. As SA coverage widens, multivendor trials shrink, consolidating demand around a narrower group of full-portfolio players.
Growing Data-Traffic Fueled Optical Transport Demand
Hyperscale data centers and 5G backhaul require 400G-800G coherent optics for links beyond 80 km, expanding the addressable transport market well beyond traditional metro applications. Cloud providers deploy vertically integrated solutions, and component shortages in coherent DSPs shift bargaining power to vendors with in-house silicon. Optical platforms enjoy 7-10 year lifecycles, smoothing revenue compared with RAN refresh rhythms. The segment also benefits from AI workload placement at regional data hubs, demanding low-latency, high-capacity interconnects. Together, these trends underpin the 9.5% CAGR for coherent systems through 2030.
Cloud-Native Network Transformation Reshapes Deployment Models
Software-defined networking and NFV let carriers decouple functions from proprietary hardware, reducing service launch times by 40% as evidenced by BT’s Network Cloud program. Telefónica’s multi-national cloud-native core underscores the scalability of virtual functions versus appliance-based solutions. Consumption-based pricing aligns vendor revenue with actual utilisation, shifting emphasis to recurring software licences and lifecycle services. Traditional hardware vendors respond with Kubernetes-ready network stacks, yet they must avoid cannibalising legacy appliance margins. For enterprises, cloud-native architectures allow on-premises, public-cloud or hybrid deployment, broadening addressable demand beyond telecom operators.
Government-Funded Broadband Stimulus Accelerates Rural Deployment
The USD 42.5 billion BEAD program mandates high-speed rural connectivity, fuelling orders for fibre PON OLTs, coherent transport, and fixed-wireless CPE [2]NTIA, “Broadband Equity Access and Deployment (BEAD) Program,” ntia.gov . Buy-America clauses benefit vendors with U.S. manufacturing, such as Ciena’s partnership with Flex for pluggable optics. Similar subsidies across the EU and Japan boost FTTH roll-outs that favour premium technology over legacy copper. Stimulus milestones run to 2027, concentrating demand in the next two budget cycles. Vendors with government contracting expertise gain an early-mover edge, reinforcing the positive 0.7% CAGR contribution.
Restraints Impact Analysis*
| Restraint | (~) % Impact on CAGR Forecast | Geographic Relevance | Impact Timeline |
|---|---|---|---|
| Geopolitical trade and vendor restrictions | -1.1% | Global, with concentrated impact in Europe and North America | Long term (≥ 4 years) |
| Semiconductor supply-chain volatility | -0.8% | Global, with acute impact on manufacturing hubs | Short term (≤ 2 years) |
| Rising 5G network TCO and energy costs | -0.6% | Global, with higher impact in energy-intensive markets | Medium term (2-4 years) |
| Secondary market for refurbished equipment | -0.4% | Emerging markets primarily, selective developed market segments | Long term (≥ 4 years) |
| Source: Mordor Intelligence | |||
Geopolitical Trade Restrictions Reshape Vendor Landscape
Germany and other EU states mandate phased removal of Huawei and ZTE gear by 2029, forcing operators to dual-source replacement RAN and transport equipment. Transition delays stretch to 24 months, depressing near-term revenue but opening premium opportunities for Nokia, Ericsson and Samsung. Component-level bans extend to sub-assemblies, compelling redesigns and alternative silicon qualification. Supply fragmentation erodes economies of scale and raises costs for smaller vendors once reliant on Chinese manufacturing. Net effect is a 1.1% negative pull on forecast CAGR.
Semiconductor Supply-Chain Volatility
Radio units and coherent optics rely on advanced radio-frequency and photonic ICs fabricated in limited foundries, leaving production vulnerable to geopolitical shocks and natural disasters [3]VIAVI Solutions, “5G Network Energy Consumption White Paper,” viavisolutions.com . Shortages trigger 4-6 month lead-time extensions, compelling operators to hold buffer inventory or delay roll-outs. Vendors diversify sourcing but second-source silicon often lags by one tech node, dampening performance gains. The resulting mismatch between hardware availability and build-out schedules subtracts 0.8% from projected CAGR, particularly in the short term before new fabs come online.
*Our forecasts treat driver/restraint impacts as directional, not additive. The impact forecasts reflect baseline growth, mix effects, and variable interactions.
Segment Analysis
By Equipment Type: RAN Dominance Faces Optical Transport Challenge
Market revenue remained anchored in RAN, which delivered USD 216.18 billion and 33.02% telecom equipment market share in 2025. Widespread macro and small-cell deployment under U.S. BEAD and Chinese rural programs sustains volume, although price erosion tempers growth. Coherent optical platforms amassed USD 57.6 billion, representing the fastest trajectory at 9.32% CAGR on the back of data-center interconnect and 5G xHaul demand.
Radio portfolios now bundle Massive MIMO, integrated antennas and AI-based energy management, differentiating suppliers on spectral efficiency and power usage. Optical vendors pivot to vertically integrated DSPs and pluggable modules that fit router slots, collapsing network layers and cutting operator capex. Core network equipment maintains mid-single-digit momentum as 5G SA conversion climbs, whereas IP routing commoditises under white-box pressure. Customer-premises equipment benefits from gigabit fibre roll-outs, and test-and-measurement firms enjoy upside from millimetre-wave validation.


By Technology Generation: 4G Legacy Transitions to 5G Innovation
4G/LTE platforms generated USD 304.68 billion and 46.55% of telecom equipment market size in 2025, reflecting persistent deployments in Africa and parts of Southeast Asia. Spend on LTE will contract as spectrum is re-farmed for 5G, yet maintenance revenues continue. 5G SA hardware, by contrast, is accelerating at 20.35% CAGR with USD 105.2 billion revenue slated for 2031.
5G NSA shipments already peaked, redirecting budgets to SA upgrades that unlock slicing and URLLC services. 2G/3G sunset programs free 700 MHz and 2100 MHz bands for rural 5G, while 6G prototypes emerge in Korea’s public-private trials targeting commercial readiness by 2028. Vendors offering evolutionary hardware that accommodates 5G Advanced and migration to 6G without site visits will capture replacement cycles.
By End-User: Private Networks Drive Enterprise Transformation
Telcos remained the anchor buyers, absorbing USD 466.71 billion and 71.25% telecom equipment market share in 2025. Yet enterprise and industrial buyers propel an emerging private-network segment, forecast to grow 14.62% CAGR to exceed USD 51.3 billion by 2031.
Automotive OEMs such as BMW achieve 99.9% uptime for autonomous guided vehicles with private 5G, validating the ROI for dedicated spectrum. Healthcare groups deploy 5G for remote surgery and asset tracking, while ports and mines capitalise on ultra-reliable low-latency links. Neutral-host and tower-company models escalate as carriers offload passive assets, pivoting capital to core and software upgrades. Governments remain niche but steady buyers of secure mission-critical networks.
By Component: Services Growth Outpaces Hardware
Software revenue hit USD 426.28 billion with 65.10% share of telecom equipment market size in 2025. Demand for containerised network functions, orchestration and analytics underpins resilience even when hardware cycles soften. Services, though smaller at USD 176.85 billion, are the fastest-rising component at 19.35% CAGR as carriers outsource design, integration and lifecycle operations.
Vendor strategies pivot to three-year managed-service contracts that embed AI-driven assurance and energy optimisation, creating stickier relationships and predictable revenue. Hardware remains essential for spectrum-specific radios and high-performance optics, but margin pools tilt toward software and services. White-box hardware penetration in aggregation layers reinforces the pivot away from proprietary appliances, compelling legacy suppliers to monetise intellectual property through licences and subscriptions.
Geography Analysis
North America retained leadership with 38.45% revenue share in 2025, buoyed by BEAD-funded fibre builds and domestic manufacturing mandates that channel spend to local plants in Texas and New York. U.S. operators advance SA upgrades while Canada densifies urban 5G, jointly underpinning a stable, security-centric procurement environment.
Asia-Pacific is the locomotive, set to log 20.25% CAGR and account for nearly half of incremental revenue through 2031. China already hosts 3.6 million 5G base stations and extends coverage to villages, while South Korea’s penetration reached 65.4% with average 1 Gbps user speeds. Japan nurtures enterprise sub-6 GHz and mmWave pilots, and India’s production-linked incentives lure component makers, accelerating local supply chain depth.
Europe experiences moderate, mixed-vendor growth as operators replace Huawei radio units and trial Open RAN with Vodafone and Telefónica. Regulatory strictness elevates costs yet grants share gains to Nokia and Ericsson. Middle East carriers push early 5G SA and private-network proofs for energy and ports, whereas Africa prioritises LTE coverage but earmarks spectrum for future 5G.

Competitive Landscape
The top five vendors capture about 60% of global revenue, indicating moderate concentration. Nordic giants Ericsson and Nokia surge in North America and Europe after Chinese exclusions, while Samsung consolidates as a credible third option for both carriers and enterprises.
Open RAN disrupts incumbents by decoupling hardware and software layers, empowering specialists such as Mavenir and Rakuten Symphony to compete on virtualised RAN controllers. Nonetheless, large operators still prefer end-to-end portfolios to streamline testing and operations, sustaining incumbent influence.
Differentiation shifts toward AI-enhanced orchestration: Ericsson’s energy-smart features cut radio power consumption by 15% without compromising throughput. Strategic moves include Ciena’s U.S. optics factory, Nokia’s cloud-native core acquisitions and Samsung’s alliances for private 5G kits. In enterprise, Cisco and HPE target edge-cloud convergence, intensifying cross-sector rivalry.
Telecom Equipment Industry Leaders
Huawei Technologies
Ericsson
Nokia
ZTE Corporation
Cisco Systems
- *Disclaimer: Major Players sorted in no particular order

Recent Industry Developments
- January 2025: Ciena Corporation and Flex launch domestic production of pluggable optical terminals for BEAD projects, aligning with Buy America rules.
- January 2025: Orbic Electronics completes USD 110 million reshoring investment in Long Island to build 5 million 4G/5G devices annually.
- December 2024: KT Corporation showcases AI-optimised 5G network supporting urban air mobility in Seoul.
- July 2024: Germany enforces stricter controls on Chinese 5G components, setting 2029 removal deadline.


Global Telecom Equipment Market Report Scope
| Radio Access Network (Macro, Small-Cell, Open RAN) |
| Optical Transport (WDM, Coherent, OTN) |
| Core Network (Packet, IMS, Policy, 5G SA) |
| IP Routing and Switching |
| Customer-Premises Equipment (CPE) |
| Test and Measurement Equipment |
| 2G/3G |
| 4G/LTE |
| 5G NSA |
| 5G SA and 5G-Advanced |
| 6G (Exploratory) |
| Telecom Operators (MNO/FMC) |
| Neutral-Host and TowerCos |
| Enterprises and Private Networks |
| Government and Public Safety |
| Hardware |
| Software (OSS/BSS, Orchestration) |
| Services (Deployment, Managed, Consulting) |
| North America | United States | |
| Canada | ||
| Mexico | ||
| South America | Brazil | |
| Argentina | ||
| Chile | ||
| Europe | Germany | |
| United Kingdom | ||
| France | ||
| Russia | ||
| Asia-Pacific | China | |
| Japan | ||
| India | ||
| South Korea | ||
| Middle East and Africa | Middle East | Saudi Arabia |
| United Arab Emirates | ||
| Bahrain | ||
| Africa | South Africa | |
| Democratic Republic of the Congo | ||
| Nigeria | ||
| Niger | ||
| By Equipment Type | Radio Access Network (Macro, Small-Cell, Open RAN) | ||
| Optical Transport (WDM, Coherent, OTN) | |||
| Core Network (Packet, IMS, Policy, 5G SA) | |||
| IP Routing and Switching | |||
| Customer-Premises Equipment (CPE) | |||
| Test and Measurement Equipment | |||
| By Technology Generation | 2G/3G | ||
| 4G/LTE | |||
| 5G NSA | |||
| 5G SA and 5G-Advanced | |||
| 6G (Exploratory) | |||
| By End-user | Telecom Operators (MNO/FMC) | ||
| Neutral-Host and TowerCos | |||
| Enterprises and Private Networks | |||
| Government and Public Safety | |||
| By Component | Hardware | ||
| Software (OSS/BSS, Orchestration) | |||
| Services (Deployment, Managed, Consulting) | |||
| By Geography | North America | United States | |
| Canada | |||
| Mexico | |||
| South America | Brazil | ||
| Argentina | |||
| Chile | |||
| Europe | Germany | ||
| United Kingdom | |||
| France | |||
| Russia | |||
| Asia-Pacific | China | ||
| Japan | |||
| India | |||
| South Korea | |||
| Middle East and Africa | Middle East | Saudi Arabia | |
| United Arab Emirates | |||
| Bahrain | |||
| Africa | South Africa | ||
| Democratic Republic of the Congo | |||
| Nigeria | |||
| Niger | |||


Key Questions Answered in the Report
What explains the 20.35% CAGR for 5G SA hardware when overall market growth is 6.27%?
5G SA requires fresh core, radio and transport gear, enabling network slicing and ultra-low-latency services that command higher prices, thereby elevating demand far above the blended market average.
Why is services revenue rising faster than hardware despite a smaller base?
5G SA integration, network slicing and AI-based assurance are complex, prompting carriers to outsource operations under multiyear managed-service contracts that grow 19.35% annually.
Why is services revenue rising faster than hardware despite a smaller base?
AI data-center interconnect traffic and 5G backhaul require 400G-800G coherent optics for distances beyond 80 km, broadening use cases and lifting long-haul upgrade cycles.
How will private 5G networks reshape vendor strategies?
Direct enterprise sales dilute operator dominance, compelling vendors to build channel partnerships and vertical-specific product variants to capture manufacturing, healthcare and logistics demand.
Page last updated on:


