In Building Wireless Market Size and Share
Market Overview
| Study Period | 2020 - 2031 |
|---|---|
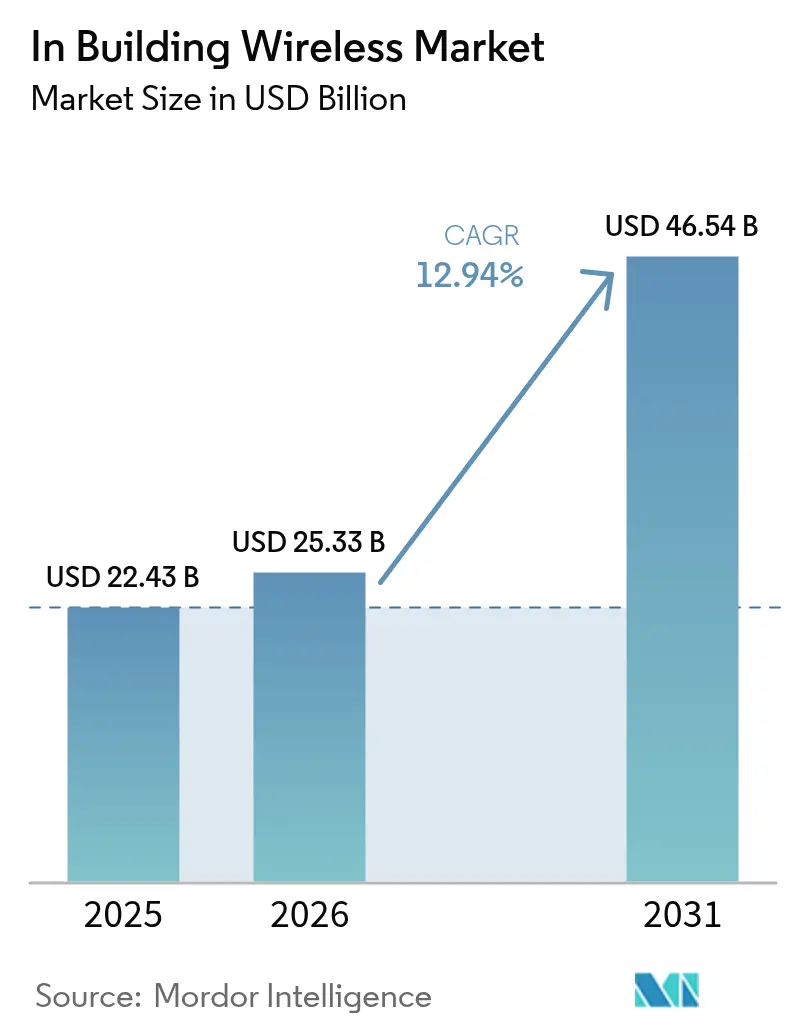
| Market Size (2026) | USD 25.33 Billion |
| Market Size (2031) | USD 46.54 Billion |
| Growth Rate (2026 - 2031) | 12.94% CAGR |
| Fastest Growing Market | Asia-Pacific |
| Largest Market | North America |
| Market Concentration | Medium |
Major Players *Disclaimer: Major Players sorted in no particular order Image © Mordor Intelligence. Reuse requires attribution under CC BY 4.0. | |
In Building Wireless Market Analysis by Mordor Intelligence
The In Building Wireless market size is expected to grow from USD 22.43 billion in 2025 to USD 25.33 billion in 2026 and is forecast to reach USD 46.54 billion by 2031 at 12.94% CAGR over 2026-2031.
Sustained demand for always-available indoor connectivity, the transition to 5G-ready buildings, and rising smart-facility mandates are driving this momentum. Enterprises now treat indoor coverage as core infrastructure, investing in cellular-first architectures that pair private 5G with next-generation Wi-Fi to guarantee application uptime. Supply-chain inflation has nudged deployment costs higher, yet cost pressures are partially offset by neutral-host designs and AI-based optimisation that lower life-cycle expenses. Vendor consolidation is reshaping the In-Building Wireless market as equipment makers pursue end-to-end solution portfolios capable of spanning radio, transport, and cloud management layers.
Key Report Takeaways
- By component type, Distributed Antenna Systems led with 37.45% revenue share in 2025, while Private-5G small cells are projected to expand at a 13.52% CAGR to 2031.
- By technology, 4G/LTE held 64.20% of the In-Building Wireless market share in 2025, and 5G NR is the fastest-growing segment at a 14.10% CAGR through 2031.
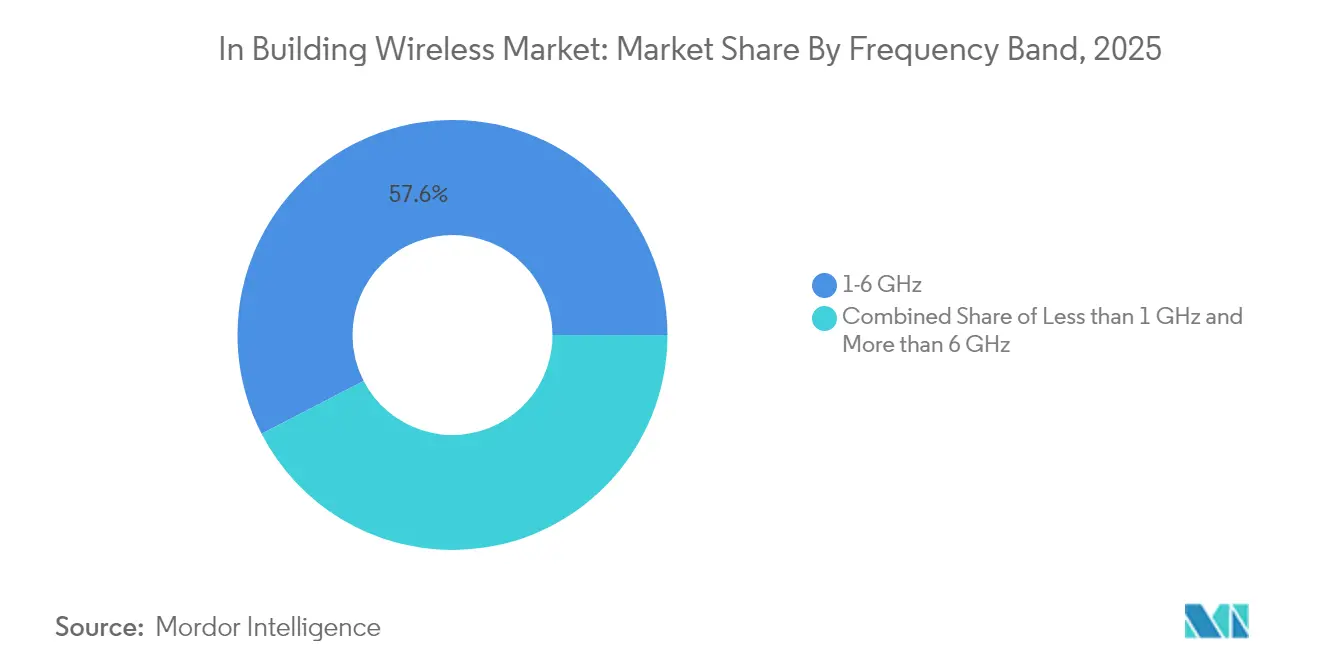
- By frequency band, mid-band spectrum accounted for 57.60% share of the In-Building Wireless market size in 2025; mmWave is advancing at a 14.18% CAGR through 2031.
- By end-user industry, commercial facilities captured 44.55% revenue share in 2025, whereas industrial deployments are forecast to grow at a 13.05% CAGR through 2031.
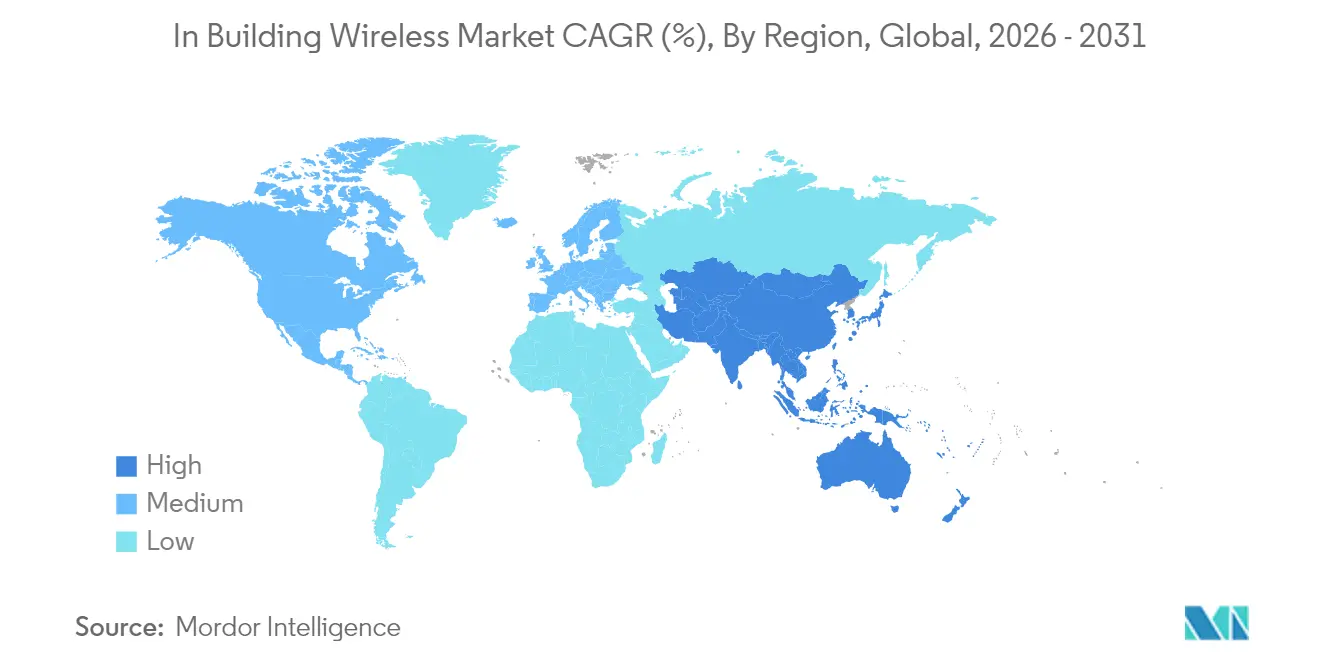
- By geography, North America commanded a 33.60% share in 2025; Asia-Pacific is the fastest-growing region at a 14.12% CAGR through 2031.
Note: Market size and forecast figures in this report are generated using Mordor Intelligence’s proprietary estimation framework, updated with the latest available data and insights as of 2026.
Global In Building Wireless Market Trends and Insights
Drivers Impact Analysis*
| Driver | (~) % Impact on CAGR Forecast | Geographic Relevance | Impact Timeline |
|---|---|---|---|
| Rising mobile-data consumption indoors | 2.80% | Global; highest in North America & Asia-Pacific | Medium term (2–4 years) |
| 5G spectrum allocations for indoor use | 2.10% | North America, Europe, Asia-Pacific | Long term (≥4 years) |
| Demand for uninterrupted enterprise connectivity | 1.90% | Global; concentrated in developed markets | Short term (≤2 years) |
| Smart-building mandates for gigabit-grade Wi-Fi | 1.40% | North America & EU; expanding to APAC urban centres | Medium term (2–4 years) |
| Source: Mordor Intelligence | |||
Rising mobile-data consumption indoors
Roughly 80% of all mobile traffic now originates inside buildings, overwhelming legacy Wi-Fi whenever video, AR training, or high-density IoT workloads spike. Retail chains such as Tractor Supply adopted 5G across more than 2,000 outlets after Wi-Fi could not support real-time inventory and customer-engagement applications. In healthcare, a single children’s hospital installed 900 tri-radio APs to safeguard tele-medicine and imaging traffic without patient disruption, underscoring the capacity gap that indoor 5G plus Wi-Fi 6E is filling. Growing video collaboration and edge analytics workloads will intensify the demand curve, reinforcing the revenue outlook for the In-Building Wireless market.
5G spectrum allocations for indoor use
Regulators are carving out dedicated indoor spectrum, shifting enterprise design from outdoor-to-indoor overlay to private cellular from day one. In the United States, the CBRS auction channelled USD 4.6 billion into 3.5 GHz licences aimed at enterprise and venue deployments, with one Tier-1 carrier alone spending USD 1.89 billion[1]Federal Communications Commission, “CBRS Auction Results,” fcc.gov. Europe authorised 480-500 MHz in the 6 GHz band, enabling 320 MHz-wide channels critical for stadiums, airports, and universities. China Mobile earmarked USD 416 million for 5G-Advanced rollouts across 300 cities to accelerate factory automation at scale. Such allocations ensure long-term spectrum certainty, lifting confidence and capex commitment across the In-Building Wireless market.
Demand for uninterrupted enterprise connectivity
Digital-first operations demand carrier-grade resilience. Automotive plants replaced Wi-Fi with private 5G to guarantee connectivity for automated guided vehicles and real-time quality control, as shown by Toyota Material Handling’s engagement with Ericsson. Semiconductor fabs validate every wireless node against strict uptime and latency tolerances to protect high-value processes. Hospitals upgrading to WPA3-certified access points illustrate how mission-critical networks must also satisfy evolving security baselines. Service-level agreements now reference 99.9% uptime for wireless segments, making redundancy and automated failover central to new indoor architectures.
Smart-building mandates for gigabit Wi-Fi
Sustainability and occupancy-efficiency schemes push property owners to embed multi-gigabit wireless that supports energy dashboards, smart HVAC, and AI-driven space utilisation. A full-service resort in California rebuilt its campus network around a 1 Gb minimum throughput target to serve guests and IoT workloads seamlessly. Wi-Fi 7 access points from Cisco feature 320 MHz channels and multi-link operation that together exceed 40 Gbps theoretical speeds, laying the foundation for immersive services. Certification frameworks such as LEED now factor connectivity, forcing developers to specify robust In-Building Wireless solutions during the design phase.
Restraints Impact Analysis*
| Restraint | (~) % Impact on CAGR Forecast | Geographic Relevance | Impact Timeline |
|---|---|---|---|
| Data-privacy & cybersecurity concerns | -1.80% | EU, North America, APAC | Short term (≤2 years) |
| High capex of multi-operator DAS deployments | -2.30% | Global; most acute in emerging markets | Medium term (2–4 years) |
| Source: Mordor Intelligence | |||
Data-privacy and cybersecurity concerns
Enterprises remain cautious about exposing operational traffic to broader cellular ecosystems. GDPR compliance elevates scrutiny of location-tracking functions in Europe, prolonging procurement cycles for smart-office projects. Healthcare providers mandate Protected Management Frames and advanced encryption before approving new radios because patient data moves over the same air interface. The US “rip-and-replace” rules for insecure equipment add unexpected swap-out costs but ultimately harden the security posture of the In-Building Wireless market.
High capex of multi-operator DAS deployments
Traditional neutral-host systems can cost USD 18.25 per underground foot of fibre, and labour still equals 60-80% of the bill of materials. Economic returns are therefore thin outside marquee venues, causing some tower operators to cancel thousands of nodes. Semiconductor shortages extend lead times for mmWave and Wi-Fi 7 chipsets, deferring revenue recognition for integrators. Enterprises counter these economics by adopting small-cell and private-network models that shift spend from shared DAS to targeted cellular footprints capable of supporting multiple tenants on a single RAN instance.
*Our forecasts treat driver/restraint impacts as directional, not additive. The impact forecasts reflect baseline growth, mix effects, and variable interactions.
Segment Analysis
By Component Type: DAS dominance faces Private-5G disruption
Distributed Antenna Systems held 37.45% of 2025 revenue, anchoring the In-Building Wireless market through deep penetration in stadiums, airports, and Class-A offices. Private-5G small cells, however, are advancing at a 13.52% CAGR, signaling a pivot toward agile cellular networks that enterprises can own and manage. Rising fibre and coax prices push integrators to favour active DAS or small-cell architectures that minimise cabling runs and facilitate remote software upgrades.
Antenna innovation now prioritises multi-band, multi-operator designs that collapse Wi-Fi and cellular coverage into one form factor, trimming roof-space requirements. Repeater use is declining as small-cell clusters deliver stronger uplinks without RF noise penalties. Vendor consolidation, illustrated by Amphenol’s USD 2.1 billion acquisition of CommScope’s mobility assets, bundles cabling, connectors, and radio components to streamline procurement. As neutral-host demand grows, single backbone infrastructures capable of carrying public and private slices simultaneously will reshape capital-allocation patterns across the In-Building Wireless market.


By Technology: 5G NR acceleration challenges 4G/LTE incumbency
4G/LTE retained 64.20% share in 2025, underpinned by a mature device ecosystem and proven stability for voice and data. Yet 5G NR is expanding at a 14.10% CAGR, driven by industrial automation projects that need deterministic latency below 10 ms. Wi-Fi 6E is also scaling, but Wi-Fi 7 introduces 320 MHz channels, multi-link operation, and 4K-QAM, giving enterprises a non-cellular path to ultra-high throughput.
Hybrid deployments blending 5G and Wi-Fi 7 are emerging as the reference architecture in hospitals, smart factories, and higher-education campuses. Manufacturing plants use 5G for mobile robotics and safety-critical telemetry, while Wi-Fi handles bulk data offload for tablets and laptops. China’s 5G-Advanced roll-out validates the technology’s readiness for indoor broadband, fuelling component demand from active DAS and small-cell vendors. With each additional private licence granted, the In-Building Wireless market deepens its shift from operator-led to enterprise-controlled networks.
By Frequency Band: Mid-band dominance amid mmWave emergence
Mid-band spectrum between 1 GHz and 6 GHz supplied 57.60% of 2025 revenue, balancing penetration and capacity for multi-floor buildings. The CBRS band stands out, converting shared spectrum rules into fast-tracked private-network pilots at Fortune 500 campuses. In contrast, mmWave is growing 14.18% annually as airports, arenas, and convention centres embrace 24 GHz+ channels to support 8K video streaming and XR experiences in dense crowds.
Regulators in Europe released 6 GHz for Wi-Fi, enabling 320 MHz channels that greatly boost per-user throughput. Japan combines Sub-6 for blanket coverage with mmWave overlays to lift uplink capacity for machine-vision cameras on production lines. Power-level debates within the FCC could raise indoor CBRS output, further blurring lines between mid-band and low-power macro coverage. These moves collectively sustain frequency diversity, ensuring the In-Building Wireless market can match performance tiers to each application.
By End-User Industry: Commercial leadership amid industrial acceleration
Commercial properties delivered 44.55% of 2025 sales, demonstrating enduring demand for seamless guest and staff connectivity across offices, retail chains, healthcare campuses, and hospitality venues. Office landlords refit networks to accommodate hybrid work, while stores weave analytics, loyalty apps, and frictionless checkout into their wireless footprint. Hospitals replace ageing access points with WPA3-ready gear to maintain accreditation for electronic health records. Resorts invest in estate-wide Wi-Fi 7 to elevate guest satisfaction metrics and support IoT-enabled energy management.
Industrial projects are the fastest-growing opportunity at 13.05% CAGR. Automotive OEMs such as BMW and Tesla leverage private 5G to synchronise robotics and automate in-line quality inspection. Oil and gas operators deploy cellular links for remote-area asset monitoring, avoiding fibre trenching costs. Warehouses rely on low-latency wireless to orchestrate autonomous forklifts and real-time inventory systems, while government agencies adopt FirstNet Band 14 coverage to underpin next-generation public-safety workflows. Industrial appetite for secure, deterministic networks will keep capital flowing toward the In-Building Wireless market.
Geography Analysis
North America led the In-Building Wireless market with 33.60% revenue share in 2025, aided by CBRS spectrum liberalisation and FirstNet’s USD 8 billion public-safety investment that funded 1,000 new cell sites. Enterprises in the United States adopt neutral-host architectures to consolidate carrier relationships and future-proof private-network ambitions. Wi-Fi 7 launches from multiple vendors accelerate refresh cycles, while Canada and Mexico leverage their automotive and aerospace clusters to justify private cellular rollouts inside plants.
Asia-Pacific is expanding at a 14.12% CAGR to 2031. China already hosts 4.4 million 5G base stations and plans to exceed 4.5 million within the forecast horizon as it digitalises manufacturing and logistics. Japan’s licence regime supports sub-6 and mmWave hybrids in smart factories, and South Korea channels state incentives into campus networks at semiconductor fabs. India’s electronic-manufacturing drive is supported by antenna localisation partnerships that trim import costs and shorten deployment lead times.
Europe shows steady uptake influenced by regulatory stringency around data privacy and building emissions. The 6 GHz allocation enlarges Wi-Fi capacity for dense venues, and French cities demonstrate the cost advantage of private 5G for municipal camera backhaul. German, British, and French enterprises lead adoption, while Central-Eastern manufacturers pilot private 5G to support Industry 4.0. Strict GDPR compliance requirements nudge buyers toward on-premises core networks and secure device-identity frameworks, shaping a security-first approach within the In-Building Wireless market.

Competitive Landscape
The In-Building Wireless market is moderately fragmented but trending toward consolidation. Amphenol absorbed CommScope’s mobility portfolio for USD 2.1 billion, combining cabling, connectors, and active equipment under one roof. Nokia secured EU clearance to acquire Infinera for USD 2.3 billion, vaulting it to the number two slot in optical networking and bolstering its end-to-end 5G proposition. These moves illustrate a push for vertical integration that captures radio through optical transport to cloud-managed orchestration.
Strategic alliances complement M&A. Nokia joined forces with Cisco, HPE, and Microsoft to embed cloud RAN inside enterprise data centres, delivering turnkey private 5G plus Wi-Fi 7 bundles that suit campuses lacking telco expertise. Extreme Networks leveraged AI-driven cloud software to deliver double-digit revenue growth for six straight years, earning Gartner leadership accolades that differentiate its subscription model. Patent filings in antenna design surge as players race to perfect multi-link and extended-reality support, with Meta, Samsung, and Qualcomm among the most active applicants.
Price pressure persists because fibre, power, and skilled labour inflate installation budgets; however, software-defined architectures allow vendors to pivot toward recurring revenue. Neutral-host providers experiment with marketplace pricing where building owners sell wholesale capacity to carriers and private tenants. Edge compute integration opens new revenue streams, letting integrators bundle analytics, computer vision, and localised AI into their radio footprint. In the next five years, competitive intensity will hinge on the ability to couple radio hardware with cloud-native control to meet the evolving expectations of the In-Building Wireless market.
In Building Wireless Industry Leaders
CommScope Holding Co.
Cisco Systems Inc.
Corning Inc.
Ericsson AB
Pierson Wireless Corp.
- *Disclaimer: Major Players sorted in no particular order


Recent Industry Developments
- June 2025: Ericsson and Google Cloud released a carrier-grade 5G Core-as-a-Service platform that cuts private-network deployment times from weeks to minutes, complete with AI-assisted troubleshooting capabilities.
- April 2025: AT&T finished a FirstNet expansion that added 1,000 new Band 14 cell sites across 46 US states, strengthening rural and tribal coverage.
- February 2025: Airspan agreed to purchase Corning’s wireless business to deepen its DAS and indoor-connectivity portfolio.
- May 2024: Tesla switched on a private 5G network at its Berlin Gigafactory to support automated manufacturing flows.


Research Methodology Framework and Report Scope
Market Definitions and Key Coverage
Our study defines the in-building wireless market as revenues generated from purpose-built indoor connectivity systems, distributed antenna systems, private small cells, repeaters, cabling, software, and related design or managed services installed inside commercial, residential, and mission-critical venues to deliver licensed cellular, public-safety, and next-gen Wi-Fi signals.
Scope exclusion: temporary event rentals and outdoor small-cell street furniture are not counted.
Segmentation Overview
- By Component Type
- Antenna
- Distributed Antenna Systems (Active DAS, Passive DAS)
- Cables (Coax, Fiber)
- Repeaters
- Small Cells (Femtocell, Picocell, Microcell)
- By Technology
- 4G/LTE
- 5G NR
- Wi-Fi 6/6E
- Wi-Fi 7
- By Frequency Band
- Less than 1 GHz (Low-band)
- 1 - 6 GHz (Mid-band incl. CBRS)
- More than 6 GHz (mmWave)
- By End-user Industry
- Commercial
- Offices
- Retail
- Healthcare
- Hospitality
- Residential
- MDU
- Single-family
- Industrial
- Manufacturing
- Warehousing
- Oil and Gas
- Public-Safety and Government
- Commercial
- By Geography
- North America
- United States
- Canada
- Mexico
- South America
- Brazil
- Argentina
- Rest of South America
- Europe
- Germany
- United Kingdom
- France
- Italy
- Spain
- Russia
- Rest of Europe
- Asia-Pacific
- China
- Japan
- South Korea
- India
- Rest of Asia-Pacific
- Middle East
- Saudi Arabia
- United Arab Emirates
- Turkey
- Rest of Middle East
- Africa
- South Africa
- Egypt
- Nigeria
- Rest of Africa
- North America
Detailed Research Methodology and Data Validation
Primary Research
Mordor analysts interviewed network engineers at mobile operators, building-automation integrators, and code inspectors across North America, Europe, Asia Pacific, and the Gulf. The conversations clarified indoor traffic growth rates, 5 G-ready retrofit costs, and typical refresh cycles, helping us refine model assumptions and stress-test forecasts.
Desk Research
We began with publicly available rule-making and spectrum filings from bodies such as the US FCC, Ofcom, and TRAI, then matched those signals with construction floor-space releases from the United Nations, Euroconstruct, and the US Census Construction Survey. Trade groups such as the Small Cell Forum and the National Fire Protection Association supplied deployment norms and code timelines that frame venue demand triggers. Company 10-K filings, investor decks, and equipment import statistics (UN Comtrade) gave us benchmark average selling prices and regional mix.
To cross-check vendor footprints, we drew on D&B Hoovers for financial breakouts, Dow Jones Factiva for contract awards, and Questel for recent patent velocity around neutral-host architectures. These sources are illustrative; many other databases and open records were reviewed for balance and validation.
Market-Sizing & Forecasting
Top-down demand pools were framed from global floor-space additions and occupied stock, adjusted by smartphone penetration, indoor traffic share, and mandated public-safety coverage ratios, which are then priced using region-specific ASP curves. Select bottom-up checks, supplier revenue roll-ups and sampled project invoices, were layered in to flag outliers. Key variables feeding the model include 5Gspectrum allocations, average DAS cost per square foot, enterprise Wi-Fi 6E shipments, smart-building adoption indices, and labor rate inflation. Multivariate regression with lagged indicators plus scenario analysis for economic slowdowns guides the 2025-2030 projection, and gaps in venue level data are bridged through calibrated analogs from similar markets.
Data Validation & Update Cycle
Outputs move through variance checks against independent capacity models and prior year audits. Senior reviewers examine anomalies before sign-off. Reports refresh annually, and analysts issue interim tweaks when material events, policy shifts or megamerger deals, arise. A final data sweep is completed just before delivery.
Why Mordor's In Building Wireless Baseline Commands Reliability
Published figures often diverge because firms slice venue types differently, convert currencies on separate dates, or project ASP erosion at dissimilar rates.
Key Gap Drivers: some publishers fold outdoor private networks into totals, others assume flat retrofit costs, and many refresh only every second year, whereas we re-benchmark prices quarterly and exclude non-indoor assets.
Benchmark comparison
| Market Size | Anonymized source | Primary gap driver |
|---|---|---|
| USD 22.43 B (2025) | Mordor Intelligence | - |
| USD 22.58 B (2025) | Global Consultancy A | Includes outdoor private small-cell rollouts and adopts fixed 8 % ASP decline without supplier validation |
| USD 21.05 B (2024) | Trade Journal B | Relies on historic device counts, omits public-safety mandates, and refreshes biennially |
The comparison shows that by anchoring totals to transparent venue stock, real-time pricing, and live primary inputs, Mordor delivers a balanced, repeatable baseline decision-makers can trust.


Key Questions Answered in the Report
What is the current size of the In-Building Wireless market?
The In-Building Wireless market size stands at USD 25.33 billion in 2026.
How fast will the In-Building Wireless market grow through 2031?
Revenue is forecast to reach USD 46.54 billion by 2031, reflecting a 12.94% CAGR during 2026-2031.
Which component is growing the quickest inside buildings?
Private-5G small cells are advancing the fastest at a 13.52% CAGR as enterprises seek dedicated cellular capacity.
Why is Asia-Pacific considered the most dynamic region?
Massive 5G investments, including China’s 4.4 million base-station footprint, drive a 14.12% regional CAGR and rapid industrial adoption.
How are enterprises justifying the cost of new indoor networks?
AI-managed neutral-host architectures and private-network models cut operating expenses and unlock monetisation of shared infrastructure.
What security steps are critical for healthcare or GDPR-sensitive deployments?
Deployments typically specify WPA3 encryption, Protected Management Frames, and on-premise cores to preserve data sovereignty while assuring 99.9% uptime.
Page last updated on:


