Market Overview
| Study Period | 2020 - 2031 |
|---|---|
| Market Size (2026) | USD 30.07 Billion |
| Market Size (2031) | USD 34.3 Billion |
| Growth Rate (2026 - 2031) | 2.67% CAGR |
| Fastest Growing Market | Middle East and Africa |
| Largest Market | Asia Pacific |
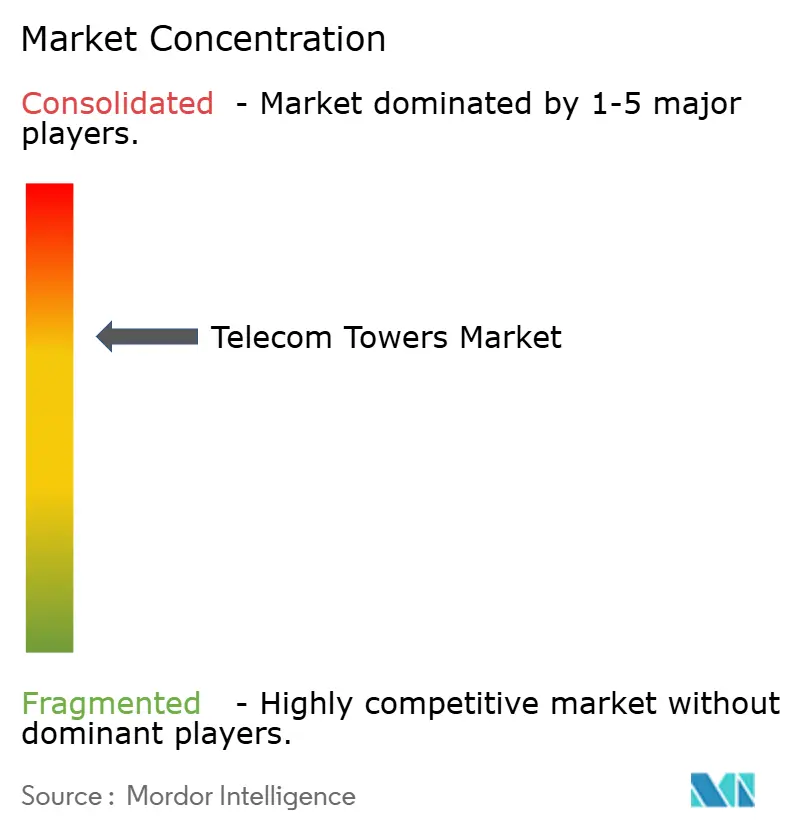
| Market Concentration | Medium |
Major Players*Disclaimer: Major Players sorted in no particular order Image © Mordor Intelligence. Reuse requires attribution under CC BY 4.0. | |
Telecom Towers Market Analysis by Mordor Intelligence
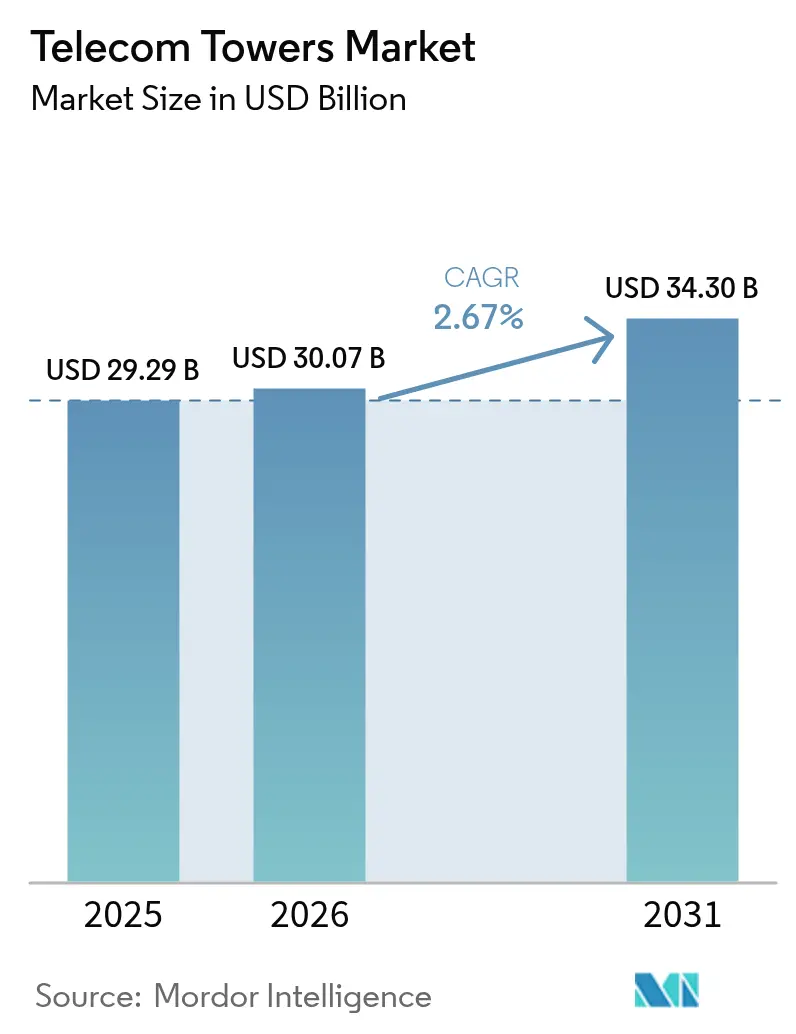
The Telecom Towers Market size was valued at USD 29.29 billion in 2025 and estimated to grow from USD 30.07 billion in 2026 to reach USD 34.3 billion by 2031, at a CAGR of 2.67% during the forecast period (2026-2031). This steady trajectory reflects how mobile network operators (MNOs) are shifting from rapid green-field rollouts toward infrastructure sharing and energy-efficient upgrades that protect margins in a capital-intensive environment. Continued 5G densification, government-backed rural coverage programs, and accelerating adoption of hybrid renewable power systems keep demand resilient, yet the overall pace remains measured as co-location ratios climb, and spectrum costs weigh on operator budgets. Regionally, Asia-Pacific leads growth thanks to China Tower’s 2.04 million-site portfolio and India’s USD 16.1 billion rural connectivity plan, while North America and Europe focus on optimizing existing assets amid zoning headwinds. Transaction activity highlights the sector’s maturation: operators are monetizing tower portfolios and redeploying proceeds into spectrum and core-network upgrades, underscoring a strategic pivot toward asset-light operating models.[1]GSMA, “The Mobile Economy Asia Pacific 2024,” gsma.com
Key Report Takeaways
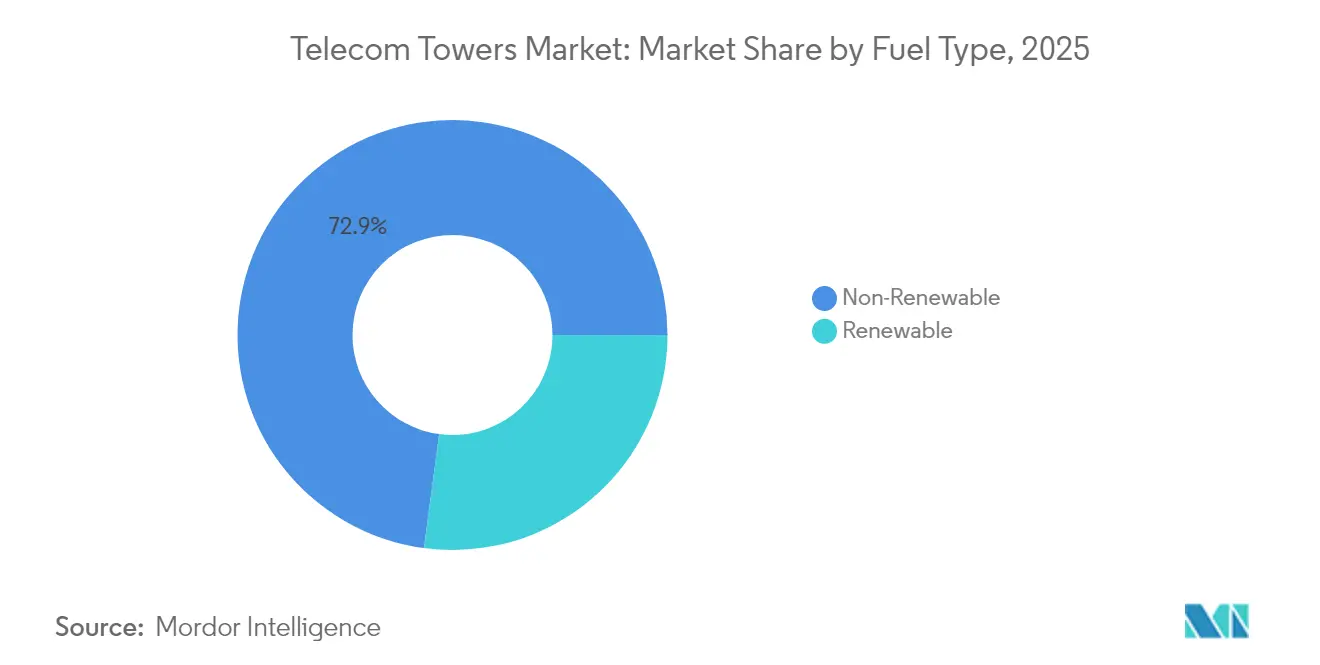
- By fuel type, non-renewable sources captured 72.88% of the telecom towers market share in 2025; renewable systems are expanding at a 5.22% CAGR through 2031.
- By tower type, lattice structures commanded 55.62% revenue share in 2025, whereas monopole towers are forecast to advance at a 4.12% CAGR.
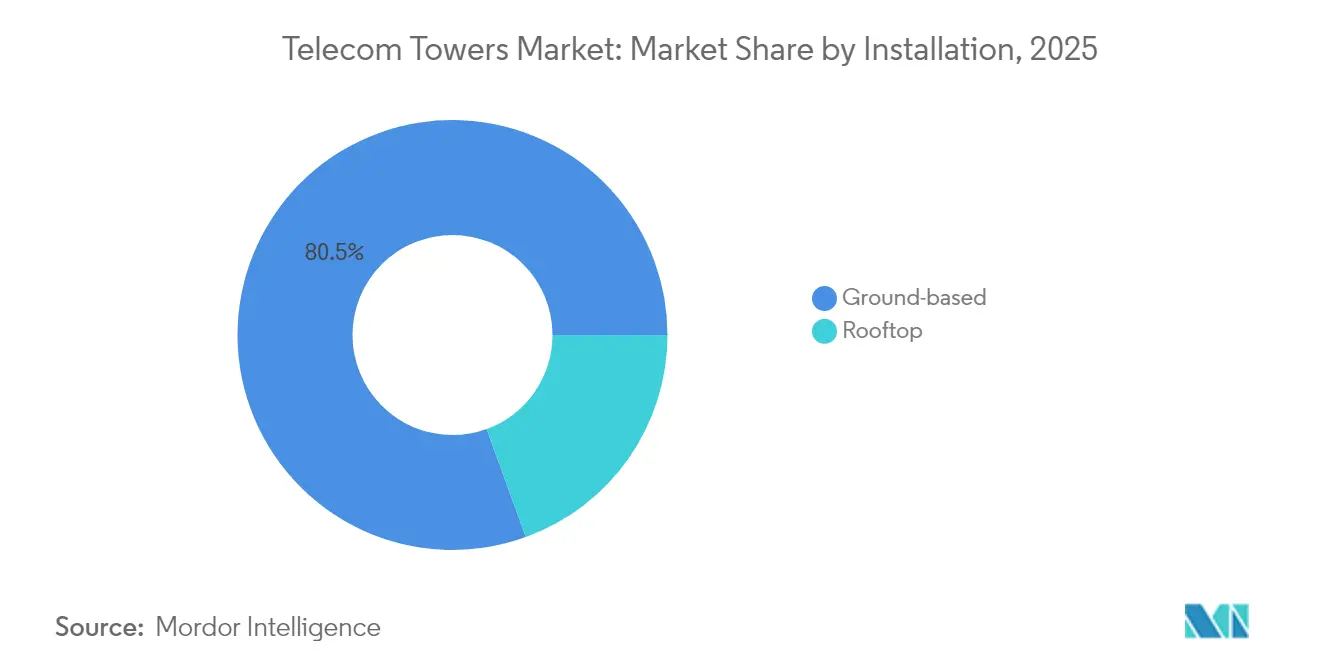
- By installation, ground-based sites accounted for 80.54% of the telecom towers market size in 2025, yet rooftop deployments are growing at a 4.68% CAGR.
- By ownership, operator-owned assets held a 61.02% share of the telecom towers market size in 2025, while private-owned towers are rising at a 4.86% CAGR.
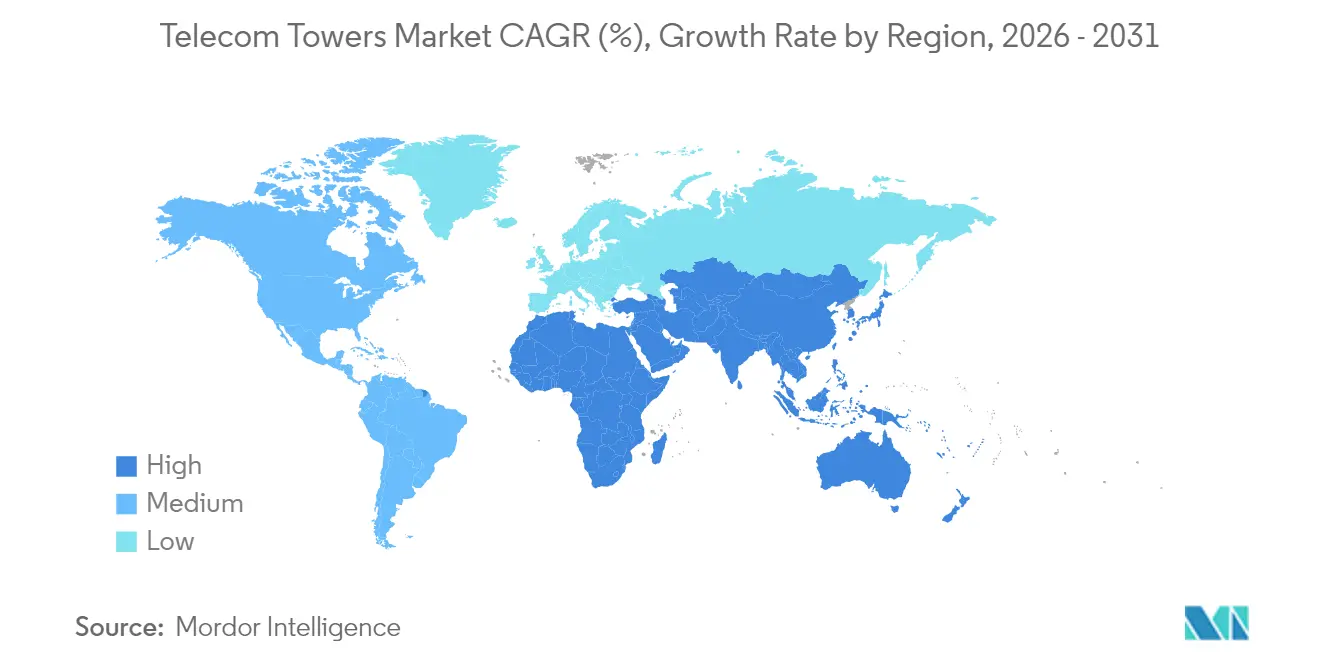
- By geography, Asia-Pacific delivered the fastest revenue expansion in 2025 and is projected to remain the growth leader through 2031.
Note: Market size and forecast figures in this report are generated using Mordor Intelligence’s proprietary estimation framework, updated with the latest available data and insights as of 2026.
Global Telecom Towers Market Trends and Insights
Drivers Impact Analysis*
| Driver | (~) % Impact on CAGR Forecast | Geographic Relevance | Impact Timeline |
|---|---|---|---|
| 5G network roll-outs | +0.80% | Global, with APAC and North America leading | Medium term (2-4 years) |
| Rising mobile data and smartphone usage | +0.60% | Global, strongest in emerging markets | Long term (≥ 4 years) |
| Rural connectivity programmes | +0.50% | APAC, Africa, Latin America | Medium term (2-4 years) |
| MNO tower-asset monetisation | +0.40% | North America, Europe, select APAC markets | Short term (≤ 2 years) |
| Edge data-centre co-location demand | +0.30% | North America, Europe, urban APAC | Long term (≥ 4 years) |
| Hybrid renewable power systems adoption | +0.20% | Global, with focus on off-grid locations | Long term (≥ 4 years) |
| Source: Mordor Intelligence | |||
5G Network Rollouts Drive Infrastructure Densification
Operators must increase site density by three to five times compared with 4G to deliver 5G’s low-latency targets, especially in high-band millimetre-wave spectrum. Latin America alone is expected to reach 425 million 5G connections by 2030, necessitating both traditional macro towers and growing layers of small cells. Regulatory bodies are responding: the Canadian Radio-television and Telecommunications Commission (CRTC) streamlined attachment rules so carriers can add 5G radios on existing structures without lengthy permissions. These policy shifts shorten deployment cycles and support consistent upward demand for new and upgraded tower sites across major urban corridors.
Rising Mobile Data Usage Pressures Network Capacity
U.S. wireless data consumption climbed 36% during 2024 as video streaming, cloud gaming, and enterprise mobility took hold, forcing carriers such as Crown Castle’s tenants to densify urban footprints and expand rural coverage.[2]Crown Castle, “Q3 2024 Earnings Call,” crowncastle.com Emerging markets mirror this surge as affordable smartphones proliferate. Techniques like carrier aggregation and massive-MIMO can stretch the spectrum, yet physical infrastructure remains the gating factor. As a result, the telecom towers market continues to exhibit incremental but durable expansion, with operators relying on tower companies to accelerate capacity meets.
Rural Connectivity Programs Unlock New Market Opportunities
Rural subsidies are reshaping deployment economics in low-density zones. India’s USD 16.1 billion rural plan and the U.S. USD 9 billion Rural 5G Fund subsidize tower construction where private ROI is thin.[3]Broadband Breakfast, “Latin America Speeds Forward With 5G Spectrum Auctions,” broadbandbreakfast.com Similar initiatives in Australia and the United Kingdom, couple with funding tower-sharing mandates, create favourable tenancy pipelines for independent tower companies and reinforce the long-run upside for the telecom towers market.
MNO Tower-Asset Monetization Accelerates Industry Restructuring
Verizon’s USD 3.3 billion sale to Vertical Bridge and Brookfield’s USD 2.5 billion acquisition of ATC India exemplify how operators unlock capital yet preserve service continuity via long-term master lease agreements. These transactions lift tenancy ratios, professionalize site management, and spur investment into backup power, automation, and edge-ready shelter elements that bolster both profitability and resilience across the telecom towers market.
Restraints Impact Analysis*
| Restraint | (~) % Impact on CAGR Forecast | Geographic Relevance | Impact Timeline |
|---|---|---|---|
| Tower-sharing saturation | -0.40% | Mature markets in North America and Europe | Short term (≤ 2 years) |
| Environmental and zoning restrictions | -0.30% | Global, most acute in developed markets | Medium term (2-4 years) |
| High-strength steel and composite supply constraints | -0.20% | Global manufacturing and supply chains | Short term (≤ 2 years) |
| LEO-satellite rural coverage substitution | -0.10% | Rural and remote areas globally | Long term (≥ 4 years) |
| Source: Mordor Intelligence | |||
Tower-Sharing Saturation Limits Mature-Market Upside
Co-location ratios in North America and Western Europe hover around 2.7 tenants per tower, leaving limited headroom for incremental leasing revenue. Structural limits complicate upgrades for heavier 5G equipment, prompting costly reinforcements that erode returns. While new tenancy pipelines remain healthy in emerging economies, saturation tempers growth in established regions, nudging the global telecom towers market toward a more balanced expansion profile.
Environmental and Zoning Restrictions Complicate Deployment
Community resistance to new structures lengthens approval timelines by up to 18 months in some U.S. municipalities, even as federal rules attempt to preempt excessive local control.[4]City of San Leandro, “Wireless Facility Design Standards 2024,” sanleandro.org Stringent design standards and health-impact debates add uncertainty, increasing holding costs and occasionally forcing operators toward pricier stealth or rooftop solutions. Such regulatory drag disproportionately affects dense urban zones where 5G site counts must multiply, softening near-term growth momentum.
*Our forecasts treat driver/restraint impacts as directional, not additive. The impact forecasts reflect baseline growth, mix effects, and variable interactions.
Segment Analysis
By Fuel Type: Renewable Transition Accelerates
Non-renewable sources dominated with 72.88% telecom towers market share in 2025, anchored by grid electricity and diesel generators for macro-cell sites. However, renewables deliver the fastest growth at a 5.22% CAGR as operators pivot to solar-battery hybrids that slash operating expense in remote areas. Renewable adoption is most pronounced in regions with erratic grid supply and high diesel logistics costs; Telefónica Germany’s energy self-sufficient 5G tower demonstrates viability in temperate climates. Hybrid systems also curb carbon output, aligning infrastructure providers with tightening ESG mandates and drawing green-finance capital toward the telecom towers market.
Progressive tower companies now bundle energy-as-a-service contracts, allowing MNOs to outsource both site and power management. As smart controllers and AI-driven battery analytics optimize consumption curves, the telecom towers industry is transitioning from energy consumer to localized producer. That evolution widens margin opportunity, diversifies revenue, and reinforces the sector’s role in sustainable connectivity.


By Type of Tower: Monopole Growth Challenges Lattice Dominance
Lattice towers retained a 55.62% share in 2025 because their triangulated-steel design supports heavy multi-band payloads at economical cost. They remain the backbone for wide-area coverage across rural expanses of Asia-Pacific and Africa. Monopoles, though, exhibit the highest growth at 4.12% CAGR in urban corridors. Their single-column form factors reduce right-of-way and skirt aesthetic objections, enabling faster permitting cycles. Carbon-fiber monopoles introduced in 2024 weigh one-twelfth of steel yet deliver twelve times the tensile strength, curbing transport and foundation expense while extending asset life.
Stealth and guyed variants round out the portfolio: stealth solutions satisfy zoning mandates in heritage districts, while guyed towers address ultra-tall applications where land is abundant. Collectively, diversified designs help the telecom towers market serve both densification and rural outreach targets without compromising economics.
By Installation: Rooftop Deployments Gain Momentum
Ground-based sites accounted for 80.54% of the telecom towers market size in 2025, thanks to structural stability, ample compound space, and ease of multi-tenant retrofits. These attributes remain paramount in suburban and green-field contexts. Urban realities differ; soaring land costs and compressed timelines push MNOs toward rooftop deployments, which are growing at a 4.68% CAGR. Distributed antenna systems now integrate seamlessly with building-management systems, improving in-building coverage for data-hungry occupants.
Rooftops still present challenges load constraints, landlord negotiations, and vertical transport for equipment, but engineering advances and prefabricated mounts streamline installation. Over the forecast window, ground-based towers will remain the workhorse of the telecom towers market, while rooftops fill densification gaps and complement small-cell grids.
By Ownership: Private Ownership Accelerates Amid Monetization Wave
Operator-owned portfolios contributed 61.02% of global revenue in 2025, reflecting legacy build-and-own models common during 3G and early 4 G eras. Tightening capital budgets now drive divestitures; privately owned towers are expanding at a 4.86% CAGR as infrastructure funds and specialist TowerCos acquire assets and sign long-term leases with carriers. Brookfield’s USD 2.5 billion purchase of ATC India exemplifies investors’ appetite for predictable cash flows tethered to multi-decade tenancy contracts.
Private owners leverage scale to negotiate better equipment procurement, centralize maintenance, and deploy site-automation platforms that boost EBITDA margins. The telecom towers market, therefore, demonstrates a pronounced tilt toward asset-light strategies for MNOs and operational specialization for investors. MNO-captive structures persist where regulatory rules require local equity participation, but the secular trend favours third-party ownership coupled to master-lease agreements.
Geography Analysis
Asia-Pacific remains the engine of global growth, backed by China’s 2.04 million-site footprint and India’s aggressive 5G targets that will add hundreds of thousands of new tenancies by 2030. Government policy is supportive: spectrum auctions prioritize coverage, and rural subsidies narrow viability gaps. Japan and South Korea refine ultra-dense architectures that layer small cells onto macro grids, while Southeast Asian markets pursue tower-sharing frameworks to accelerate rollout and contain costs. These dynamics solidify Asia-Pacific’s status as both the largest and fastest-growing slice of the telecom towers market.
North America presents a mature but technologically advanced landscape. Extensive co-location has tempered new-build volumes, yet 5G upgrades and edge-data-center initiatives sustain leasing demand. Federal programs such as the Rural 5G Fund bridge the economics of sparsely populated territories, steering incremental growth toward underserved communities. Regulatory headwinds arise at the municipal level, where zoning inertia and aesthetic opposition can extend project timelines, but federal pre-emption measures are narrowing the window for local vetoes.
Europe shows a two-speed pattern. Western markets face saturation and stringent environmental scrutiny, prompting tower companies to innovate with renewable-powered sites and stealth designs that satisfy eco-centric regulations. Eastern Europe and the Balkans, in contrast, are earlier in the 5G curve; spectrum auctions and EU connectivity funds support green-field construction that lifts overall regional momentum. Meanwhile, the Middle East advances consolidation, with TowerCo share surpassing 44% on the back of STC’s TAWAL and Zain’s TASC platforms. Latin America benefits from América Móvil’s USD 7.7 billion Brazil commitment and expanding 5G auctions, while Africa’s long-term potential rests on government digitization plans that combine satellite backhaul, rural subsidies, and universal-service mandates.

Competitive Landscape
The telecom towers market is moderately consolidated. Global majors such as American Tower Corporation, Cellnex, Indus Towers, and China Tower hold extensive multi-regional portfolios, while specialized owners like Vertical Bridge dominate specific geographies. Strategic differentiation centers on tenancy maximization, energy innovation, and digital-layer add-ons such as edge-computing cabinets. Recent appointments, like American Tower’s chief operating officer change, underscore a continuing drive toward operational excellence and automation.
Investment appetite remains robust as infrastructure funds chase predictable, inflation-linked cash flows. Transactions underscore a virtuous cycle: MNO divestitures feed TowerCo scale; scale unlocks capex synergies and lower cost of capital; savings funnel into site upgrades and renewable transitions that attract further tenants. Patent records show rising R&D in carbon-fiber poles and AI-enabled predictive maintenance, signalling sustained technological competition. Yet regulatory compliance covering everything from FAA lighting rules to municipal design standards continues to buffer incumbents by raising entry barriers.
White-space opportunities concentrate in edge compute and power-as-a-service. Early adopters are co-locating micro-data centers at tower bases, supplying immediate demand from content-delivery networks that require low-latency distribution. Concurrently, ESG-linked financing accelerates renewable retrofits, positioning market leaders to capture both cost savings and sustainability premiums.
Telecom Towers Industry Leaders
American Tower Corporation
Helios Towers PLC
Indus Towers Limited (Bharti Infratel)
China Tower Corporation
SBA Communications Corporation
- *Disclaimer: Major Players sorted in no particular order

Recent Industry Developments
- June 2025: Indus Towers generated USD 1.57 billion free cash flow in Q1 2025, aided by Vodafone Idea receivable collections, and plans extensive solar and lithium-ion upgrades across 249,305 sites.
- May 2025: Cellnex confirmed strong organic growth for Q1 2025 and reiterated upbeat full-year guidance despite macroeconomic uncertainty.
- April 2025: América Móvil earmarked up to USD 7.7 billion for Brazilian unit Claro through 2029 to blend 5G and fiber expansions.
- January 2025: American Tower named Eugene Noel chief operating officer and disclosed a USD 6.56 per-share dividend for 2024.


Global Telecom Towers Market Report Scope
A telecommunication tower can be of any structure, including monopoles, tripoles, lattice towers, guyed towers, self-support towers, poles, masts, or similar structures. These towers support one or more telecommunication antennas, allowing radio communications. They can be placed on the ground or a building's rooftop, including equipment storage and storing electronic components. These towers do not require regular staffing and require periodic maintenance. The growth of telecom towers is set to continue during the forecast period, owing to the deployment of 5G infrastructure.
The telecom towers market is segmented by fuel type (renewable and non-renewable), type of tower (lattice tower, guyed tower, monopole tower, and stealth tower), installation (rooftop and ground-based), ownership (operator-owned, joint venture, private-owned, MNO captive), and geography (North America [United States and Canada], Europe (United Kingdom, Germany, France, Italy, Spain, Netherlands, Sweden, Switzerland, and Rest of Europe], Asia-Pacific [China, India, Japan, South Korea, Indonesia, Vietnam, Malaysia, Philippines, Australia and New Zealand, and Rest of Asia-Pacific], Latin America [Brazil, Mexico, Argentina, Central America, Columbia, and Rest of Latin America], and Middle East and Africa [Saudi Arabia, Egypt, Algeria, Nigeria, South Africa, Tanzania, Morocco, and Rest of Middle East and Africa]). The market sizes and forecasts are provided in terms of value (USD) for all the above segments.
By Fuel Type
| Renewable |
| Non-Renewable |
By Type of Tower
| Lattice Tower |
| Guyed Tower |
| Monopole Tower |
| Stealth Tower |
By Installation
| Rooftop |
| Ground-based |
By Ownership
| Operator-owned |
| Joint Venture |
| Private-owned |
| MNO Captive |
By Geography
| North America | United States |
| Canada | |
| Mexico | |
| Europe | United Kingdom |
| Germany | |
| France | |
| Italy | |
| Rest of Europe | |
| Asia-Pacific | China |
| Japan | |
| India | |
| South Korea | |
| Rest of Asia | |
| Middle East | Israel |
| Saudi Arabia | |
| United Arab Emirates | |
| Turkey | |
| Rest of Middle East | |
| Africa | South Africa |
| Egypt | |
| Rest of Africa | |
| South America | Brazil |
| Argentina | |
| Rest of South America |
| By Fuel Type | Renewable | |
| Non-Renewable | ||
| By Type of Tower | Lattice Tower | |
| Guyed Tower | ||
| Monopole Tower | ||
| Stealth Tower | ||
| By Installation | Rooftop | |
| Ground-based | ||
| By Ownership | Operator-owned | |
| Joint Venture | ||
| Private-owned | ||
| MNO Captive | ||
| By Geography | North America | United States |
| Canada | ||
| Mexico | ||
| Europe | United Kingdom | |
| Germany | ||
| France | ||
| Italy | ||
| Rest of Europe | ||
| Asia-Pacific | China | |
| Japan | ||
| India | ||
| South Korea | ||
| Rest of Asia | ||
| Middle East | Israel | |
| Saudi Arabia | ||
| United Arab Emirates | ||
| Turkey | ||
| Rest of Middle East | ||
| Africa | South Africa | |
| Egypt | ||
| Rest of Africa | ||
| South America | Brazil | |
| Argentina | ||
| Rest of South America | ||


Key Questions Answered in the Report
How big is the Telecom Towers Market?
The Telecom Towers Market size is expected to reach USD 30.07 billion in 2026 and grow at a CAGR of 2.67% to reach USD 34.3 billion by 2031.
What is the current Telecom Towers Market size?
In 2026, the Telecom Towers Market size is expected to reach USD 30.07 billion.
Who are the key players in Telecom Towers Market?
American Tower Corporation, Helios Towers PLC, Indus Towers Limited (Bharti Infratel), China Tower Corporation and SBA Communications Corporation are the major companies operating in the Telecom Towers Market.
Which is the fastest growing region in Telecom Towers Market?
Asia Pacific is estimated to grow at the highest CAGR over the forecast period (2026-2031).
Which region has the biggest share in Telecom Towers Market?
In 2025, Asia-Pacific accounts for the largest market share in Telecom Towers Market.
What years does this Telecom Towers Market cover, and what was the market size in 2025?
In 2025, the Telecom Towers Market size was estimated at USD 30.07 billion. The report covers the Telecom Towers Market historical market size for years: 2019, 2020, 2021, 2022, 2023 and 2024. The report also forecasts the Telecom Towers Market size for years: 2026, 2027, 2028, 2029, 2030 and 2031.
Page last updated on:


