
Telecom Power Systems Market Size and Share
Market Overview
| Study Period | 2020 - 2031 |
|---|---|
| Market Size (2026) | USD 5.79 Billion |
| Market Size (2031) | USD 8.59 Billion |
| Growth Rate (2026 - 2031) | 8.22 % |
| Fastest Growing Market | Asia-Pacific |
| Largest Market | Asia Pacific |
| Market Concentration | Medium |
Major Players
*Disclaimer: Major Players sorted in no particular order Image © Mordor Intelligence. Reuse requires attribution under CC BY 4.0. |
|
Telecom Power Systems Market Analysis by Mordor Intelligence
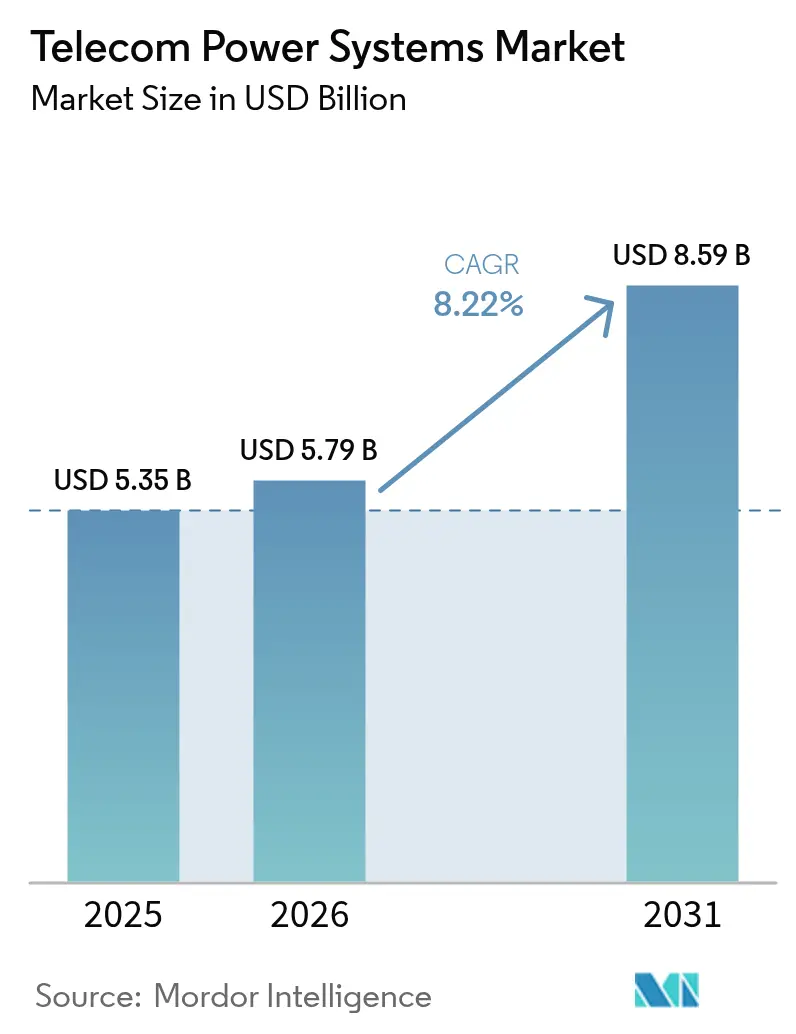
The telecom power systems market size was valued at USD 5.35 billion in 2025 and estimated to grow from USD 5.79 billion in 2026 to reach USD 8.59 billion by 2031, at a CAGR of 8.22% during the forecast period (2026-2031). Operators are prioritizing higher-efficiency rectifiers, hybrid AC/DC architectures, and advanced battery chemistries to accommodate the doubled power draw of 5G macro radios. Sustained network densification, edge-site build-outs, and regulatory pressure to curb energy use are accelerating investment in purpose-built power infrastructure. Lithium-ion’s longer life and lower lifetime cost are tilting battery procurement away from VRLA, while fuel cells are gaining attention for zero-emission backup at critical sites. Asia Pacific remains the most influential demand center thanks to large-scale rural electrification and aggressive 5G timelines, whereas North America and Europe are investing heavily in resilience against severe weather events and carbon compliance.
Key Report Takeaways
- By power range, medium systems (5–20 kW) led with 45.60% of telecom power systems market share in 2025, while high-power systems ( more than 20 kW) are forecast to grow at 11.08% CAGR through 2031.
- By power source, grid-connected solutions captured 54.70% revenue in 2025; hybrid solar-diesel configurations are projected to expand at 13.74% CAGR to 2031.
- By component, rectifiers dominated with a 27.70% share in 2025, whereas fuel cells will post a 14.85% CAGR over the forecast period.
- By energy storage technology, VRLA batteries accounted for 63.20% of the telecom power systems market size in 2025; lithium-ion storage is set to grow at 15.88% CAGR.
- By system architecture, DC power plants held 60.30% of 2025 revenue; the hybrid AC/DC segment is advancing at a 12.80% CAGR through 2031.
- By network generation, 4G/LTE retained 56.40% revenue in 2025, yet 5G NR will expand at a 17.05% CAGR between 2026 and 2031.
- By output-power configuration, the 2–10 kW band commanded 47.50% share of the telecom power systems market size in 2025, while the more than 20 kW band is rising at 13.98% CAGR.
- By region, Asia Pacific held 40.60% revenue in 2025 and is projected to grow at 10.31% CAGR through 2031.
Note: Market size and forecast figures in this report are generated using Mordor Intelligence’s proprietary estimation framework, updated with the latest available data and insights as of 2026.
Global Telecom Power Systems Market Trends and Insights
Drivers Impact Analysis*
| Driver | (~) % Impact on CAGR Forecast | Geographic Relevance | Impact Timeline |
|---|---|---|---|
| Surging 5G Macro-Cell Roll-outs | +2.1% | Global, with concentration in North America, Europe, and East Asia | Medium term (2-4 years) |
| Rapid Rural Electrification in Emerging Markets | +1.5% | Asia Pacific, Africa, Latin America | Medium term (2-4 years) |
| Energy-Efficiency Mandates for Telcos | +1.8% | Europe, North America, developed Asia | Long term (≥ 4 years) |
| Growing Preference for Lithium-ion and LFP UPS Systems | +1.4% | Global, with early adoption in North America and Europe | Medium term (2-4 years) |
| Satellite-Back-haul Expansion for Remote Towers | +1.0% | Rural areas across Africa, Latin America, Southeast Asia, and Oceania | Short term (≤ 2 years) |
| Data-center and Edge-site Convergence with RAN | +0.9% | Urban centers in North America, Europe, and East Asia | Medium term (2-4 years) |
| Source: Mordor Intelligence | |||


Surging 5G Macro-Cell Roll-outs
Massive 5G macro deployment is doubling the electrical load per site, with individual base stations now demanding more than 20 kW. Operators are retrofitting compact high-efficiency rectifiers that reach 96% conversion efficiency to offset rising utility costs and to fit within constrained tower footprints.[1]Infineon Technologies AG, “Key Requirements for 5G Telecom SMPS,” infineon.com Power density pressure is also accelerating the move to higher-voltage DC distribution that cuts conductor size and thermal losses. In dense urban clusters, integrated DC power shelves paired with lithium-ion strings enable quick energy dispatch during traffic peaks. Vendors offering modular 5G-ready power shelves have captured early share because they shorten installation windows and minimize site downtime. As 5G radios ramp to massive-MIMO configurations, demand for active cooling and precise thermal management is becoming a parallel purchase driver.
Rural Electrification: Catalyst for Hybrid Power Innovation
Off-grid and weak-grid communities are drawing investment into solar-diesel and solar-battery hybrids that cut diesel burn by up to 70% while preserving 99.99% uptime. Hybrid controllers now orchestrate multi-source inputs, optimizing generator run hours and state of charge across diverse chemistries. Telecom operators view these systems as a bridge to universal connectivity for an estimated 3.7 billion people still lacking reliable broadband. Field deployments, such as EdgePoint’s solar hybrid towers in Malaysia, supply up to 100% of site energy under optimal irradiance and curb annual carbon emissions by 78% per tower.[2]Antara News Agency, “EdgePoint Towers Deploys Solar Hybrid Site in Malaysia,” antara.com Improved rural power availability is further unlocking low-power small-cell and fixed-wireless access models, expanding the total addressable footprint for the telecom power systems market.
Energy Efficiency Mandates Drive Innovation
Policy frameworks that link license renewal and spectrum fees to carbon intensity are compelling operators to prove year-on-year energy reductions. Advanced power monitoring platforms now combine real-time telemetry with AI algorithms that trim site energy by 15-30% through load shifting and proactive maintenance. While the telecom sector today represents roughly 1% of global electricity use, unchecked growth in traffic could raise that figure by 60% by 2030. High-efficiency rectifiers, smart PDUs, and dynamic online UPS top procurement lists because they provide quick, audited energy gains. Operators deploying holistic optimization programs are reporting cost savings equal to 2-3% of service revenue, reinforcing the business case for accelerated power-plant upgrades.
Lithium-ion Adoption Reshapes Backup Economics
Despite an initial price premium of 1.5-2 ×, lithium-ion delivers 30-40% lower lifetime cost than VRLA. Energy density that is 2-3 × higher reduces cabinet count and frees up floor space for additional radio sectors. Lithium-ion cells tolerate deeper discharge and 3-4 × more cycles, aligning with peak-shaving use cases at 5G sites where frequent charge-discharge events are expected. Lower weight simplifies rooftop deployments and lowers freight cost in remote regions. As module prices fall and recycling programs scale, operators increasingly integrate lithium-iron-phosphate strings into both indoor and outdoor cabinets, accelerating the shift away from lead acid.[3]Kohler Power, “Lithium-ion vs VRLA Total Cost of Ownership,” kohlerpower.com
Restraints Impact Analysis*
| Restraint | (~) % Impact on CAGR Forecast | Geographic Relevance | Impact Timeline |
|---|---|---|---|
| Capital-intensive Site Modernization | -0.8% | Global, with higher impact in developing regions | Medium term (2-4 years) |
| High O&M Spend in Off-grid Terrains | -0.7% | Rural areas in Africa, Latin America, South Asia | Long term (≥ 4 years) |
| Fire-safety and Environmental Compliance Costs | -0.6% | Europe, North America, developed Asia Pacific | Medium term (2-4 years) |
| Prolonged Supply-chain Lead-times for Power Semis | -0.5% | Global, with acute impact in Asia Pacific manufacturing hubs | Short term (≤ 2 years) |
| Source: Mordor Intelligence | |||
Capital-Intensive Site Modernization
Retro-fitting 5G-ready power infrastructure costs USD 25,000–40,000 per macro site and often requires parallel legacy support during migration, effectively doubling near-term capital outlay. Smaller operators face balance-sheet pressure that slows upgrade schedules and prolongs the operating life of less-efficient gear. Financing models such as power-as-a-service are emerging, yet uptake is modest outside tier-1 players. Prolonged modernization cycles hinder timely adoption of high-voltage DC and lithium-ion, limiting the short-term growth potential of the telecom power systems market. In developing economies, currency fluctuations and high cost of imported components add another barrier to rapid overhaul.
Off-Grid Operations: Maintenance Challenges Persist
O&M costs at diesel-powered or hybrid off-grid sites are 2.5-3 × higher than grid-fed locations due to fuel logistics, road access issues, and specialized skill requirements. Extreme weather further inflates expenditure; the US Department of Homeland Security cites climate-induced outages as a growing threat to rural communications dhs.gov. To reduce truck rolls, operators deploy remote monitoring and predictive analytics, yet component replacements still necessitate on-site intervention. Supply-chain delays for high-power semiconductors can extend downtime, eroding service quality metrics. These factors collectively suppress the near-term addressable portion of the telecom power systems market in underserved territories.
*Our forecasts treat driver/restraint impacts as directional, not additive. The impact forecasts reflect baseline growth, mix effects, and variable interactions.
Segment Analysis
By Power Range: High-Capacity Systems Gain Momentum
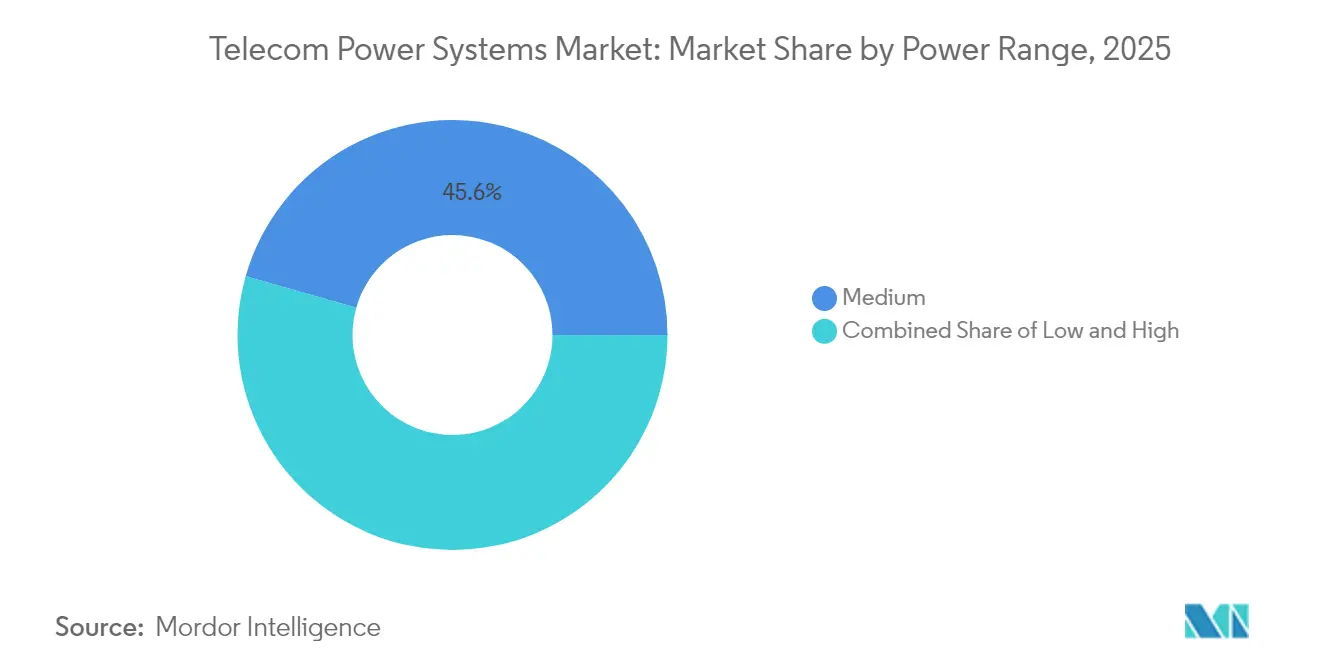
Medium-range solutions of 5–20 kW captured 45.60% of the telecom power systems market share in 2025. They remain the backbone for macro sites that host 4G LTE layers and incremental 5G sectors. The telecom power systems market is witnessing a strategic pivot toward ≥20 kW platforms that are growing at an 11.08% CAGR. These larger systems satisfy the aggregated load of massive-MIMO radios, edge compute racks, and active cooling within confined shelters. Vendors focus on hot-swappable modules and intelligent load management so that operators can phase-upgrade without site outages.Urban densification and spectrum pooling push operators to terminate multiple frequency bands at a single rooftop, raising per-site load. High-capacity rectifiers coupled with lithium-ion strings limit footprint while maintaining runtime objectives. Thermal design has emerged as a competitive differentiator; outdoor cabinets integrate liquid cooling to handle the increased heat flux. Conversely, low-power solutions below 5 kW continue serving small cells but their share is tapering as indoor distributed deployments migrate to cloud-RAN architectures with centralized power.


By Power Source: Hybrid Solutions Redefine Reliability
Grid-connected systems accounted for 54.70% of revenue in 2025 owing to robust urban grids in Europe, North America, and East Asia. Hybrid solar-diesel architectures, however, are expanding at a 13.74% CAGR and represent the fastest-growing slice of the telecom power systems market. Operators in Africa, South Asia, and Southeast Asia adopt these hybrids to cut diesel usage by up to 70% and lock in predictable energy cost over a 15-year horizon. Controllers that coordinate PV arrays, battery banks, and generator runtime optimize generator scheduling and curtail trip totals.Beyond cost, sustainability commitments elevate hybrid viability. Hybrid micro-grids support corporate science-based targets by lowering scope 1 emissions at tower companies. EdgePoint’s 5.9 kWp Malaysian tower shows solar can meet 100% of site load during peak irradiance, eliminating 78% of yearly carbon output. Pure renewables such as wind or standalone PV remain niche due to intermittency, but battery price declines and energy-management analytics are gradually expanding their deployment envelope.
By Component: Fuel Cells Emerge as Disruptive Force
Rectifiers constituted 27.70% of component revenue in 2025 and continue to evolve through silicon-carbide MOSFET topologies that cut loss and shrink heat sinks. The fuel-cell segment is climbing at a 14.85% CAGR, addressing sites that require extended autonomy without the environmental penalties of diesel. Proton-exchange-membrane systems deliver about 60% electrical efficiency and water vapor emissions only, making them suitable for densely populated or environmentally regulated areas. Early adopters include base-transceiver-station clusters adjacent to data centers that seek uninterrupted runtime during grid disturbance windows exceeding eight hours.Battery sub-systems are transitioning from sealed lead-acid toward lithium-ion and emerging solid-state formats. Cooling, once a secondary consideration, is now integral since active electronics and batteries must share tighter enclosures. Vendors package variable-speed compressor units and cold-plate solutions that slash cooling power by 40%. Controllers and remote monitoring hardware embed AI-enabled predictive analytics, trimming unplanned site visits and aligning maintenance intervals with actual wear.
By System Architecture: Hybrid AC/DC Bridges Legacy and Future
DC rails at –48 V or 380 V command 60.30% of 2025 deployments thanks to inherent efficiency and direct compatibility with telecom radios. Hybrid AC/DC configurations are growing fastest at 12.80% CAGR. They allow operators to keep legacy AC-fed HVAC gear online while powering radios through a high-efficiency DC bus. This blended architecture reduces conversion stages and provides a migration path toward full DC without immediate forklift upgrades. High-voltage 380 V DC is gaining traction in combined telecom and edge computing sites because it lowers cable cross-section and simplifies redistribution within multi-rack rooms.Pure AC distribution now appears mostly in micro-cells or legacy rural shelters. Even here, AC-input rectifiers internal to radios add conversion loss. Energy-audits often reveal 8-10 % savings when shifting comparable sites to DC or hybrid distribution. Vendors respond with rack-level power shelves that deliver both –48 V DC and 230 V AC outputs, enabling plug-and-play coexistence of diverse loads during staged migration.
By Energy Storage Technology: Lithium-ion Reshapes Economics
VRLA batteries retained 63.20% share in 2025, stemming from entrenched supply chains and low upfront cost. Lithium-ion, expanding at 15.88% CAGR, is redefining procurement criteria based on lifecycle economics rather than capex alone. Higher energy density frees up revenue-generating rack units within shelters and reduces tower dead-load on rooftops. With calendar lifetimes of 12-15 years, lithium-ion eliminates two VRLA refresh cycles and lowers technician visits, delivering total lifecycle savings of 30-40%. Fuel-cell cartridges have gained mindshare where runtime expectations exceed eight hours or where diesel logistics are prohibitive. Supercapacitors serve narrow roles in power conditioning and ultra-short backup for radios that must sustain sub-second glitch immunity. Nickel-cadmium batteries hold a niche in Arctic and desert zones where wide-temperature tolerance outweighs cost premium. Across chemistries, intelligent battery-management systems now use cell-level telemetry to optimize charging curves and slow capacity fade.
By Network Generation: 5G NR Drives Power Innovation
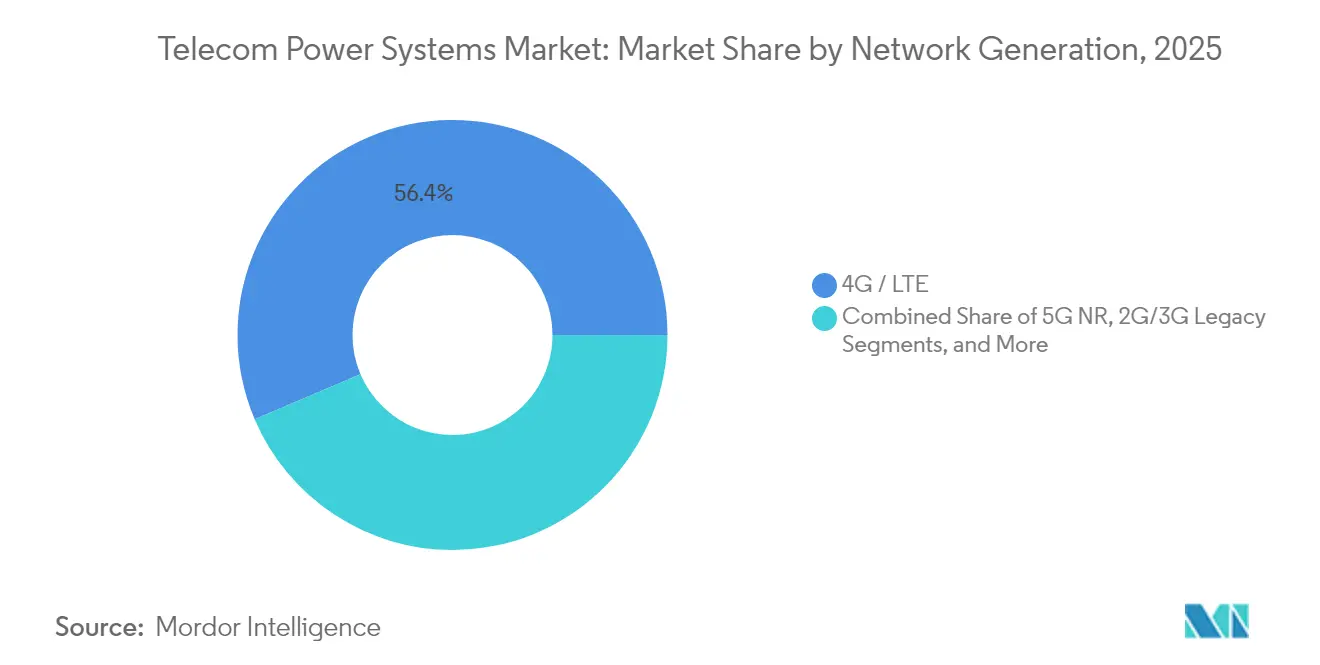
The 4G layer provided 56.40% of power demand in 2025, yet 5G NR is advancing at 17.05% CAGR and will soon dominate incremental capex. 5G macro cells employ 64T64R or larger arrays, doubling site wattage and pushing cooling loads to as high as 40% of total consumption. Energy-saving features in next-gen radios reduce idle draw, but peak power still rises, necessitating superior rectifier headroom and dynamic UPS engagement. Private 5G networks bring additional requirements for autonomous runtime and ruggedized enclosures in manufacturing or mining environments.Satellite and LEO backhaul sites create distinct power issues, often lacking grid access and experiencing large daily thermal swings. These locations increasingly pair solar arrays with high-cycle lithium-ion packs to reduce maintenance dispatch. Decommissioning of 2G and 3G networks remains a tactical lever for lowering energy bills; operators that sunset older layers free up budget for modern, high-efficiency equipment.
By Output Power Configuration: High-Capacity Blocks Surge
Systems rated 2–10 kW held 47.50% of revenue in 2025 reflecting legacy macro deployments. Rapid densification and the addition of edge compute racks are boosting demand for >20 kW blocks, which are growing at 13.98% CAGR. Operators prefer modular units that scale in 5 kW increments, allowing them to order just-in-time expansion as radios are added. High-capacity shelves integrate bus-bar distribution to minimize cable clutter and voltage drop.Low-power <2 kW units continue to support indoor distributed-antenna systems, small enterprise femtocells, and smart-pole urban furniture. The 10–20 kW tier acts as a transitional choice for suburban sites adding initial 5G sectors. Across all power bands, software-defined power controllers smooth load spikes, extend battery life, and integrate with network-wide energy-management dashboards, reinforcing the digitalization trend within the telecom power systems industry.
Geography Analysis
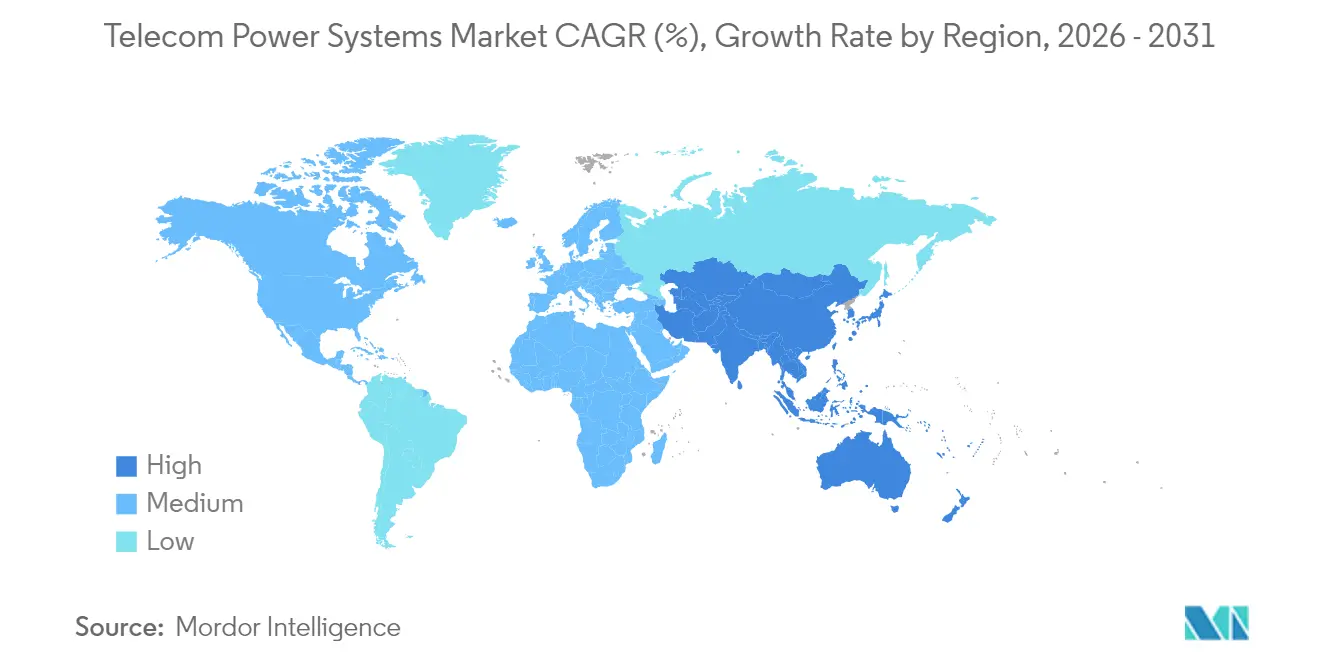
Asia Pacific contributed 40.60% of 2025 revenue and is expanding at 10.31% CAGR, anchored by China’s nationwide 5G blitz and India’s accelerated Digital India mandate. Massive greenfield tower rollouts pair high-capacity DC shelves with solar hybrids in rural provinces, broadening the telecom power systems market. Japan and South Korea add incremental demand through edge-compute nodes that require high-voltage DC distribution for latency-critical applications.North America ranks second, driven by continued C-band 5G upgrades and a sharp focus on climate resilience. Operators are hardening power plants against wildfires and hurricanes by adding lithium-ion packs with elevated temperature tolerance and designing enclosures that withstand longer grid-down intervals. Canadian carriers deploy cold-climate battery chemistries and remote telemetry to minimize winter truck rolls, while Mexican towercos invest in hybrid arrays to stabilize power in remote states.Europe’s market is shaped by some of the world’s strictest energy-efficiency rules. Telecom firms are required to disclose site-level energy metrics, accelerating adoption of hybrid renewable plants and intelligent rectifiers. Germany channels Industry 4.0 stimulus toward robust 5G coverage and thus advanced power cabinets. The United Kingdom concentrates on service continuity; new regulations increase operator liability for interruptions, prompting redundant UPS design. Eastern European nations leverage EU cohesion funds to modernize legacy shelters directly with lithium-ion and hybrid AC/DC power rails.

Regulatory Landscape
Regulation affecting telecom power systems increasingly centers on measurable energy efficiency, standardized interfaces, and tighter governance of shared infrastructure. In China, MIIT issued YD/T 3032-2026 (energy-efficiency requirements and evaluation methods for power and cooling systems in telecom rooms and stations), with the standard taking effect on September 1, 2026, shaping procurement criteria for rectifiers, cooling, and site-level power architectures.
Global and regional standards bodies are also converging around higher-voltage DC feeding and interoperable monitoring. ITU-T published Recommendation L.1206 in 2025 on multiple power supply interfaces for ICT equipment (AC and DC up to 400V), while ITU-T and ETSI in 2025 standardized monitoring and power-parameter interfaces for battery systems and ICT equipment (for example, ITU-T L.1397 and ETSI ES 202 336-11, and ETSI ES 202 336-12). In India, the Department of Telecommunications framework for infrastructure and authorization has expanded the governed scope around telecom infrastructure, with TRAI recommendations in February 2025 covering the authorization scope for Digital Connectivity Infrastructure Providers (DCIP), explicitly including passive infrastructure elements such as power systems alongside towers and related systems.
Value Chain Analysis
The telecom power systems value chain spans upstream power semiconductors and magnetics, battery materials and cells (VRLA and lithium-ion/LFP), power conversion assemblies (rectifiers, inverters, converters), controls and monitoring software, and downstream system integration into indoor and outdoor cabinets for telecom sites. Scale vendors and integrators bundle power shelves, battery cabinets, cooling, and remote monitoring, while tower companies and operators influence specifications (48V/51.2V battery platforms, runtime targets, and warranty terms) through large, centralized tenders and framework agreements.
Supply resilience and lead times remain key pinch points. Regional capacity additions in power electronics and logistics disruptions both influence availability of rectifier and controller bill-of-materials. Shipping reroutes that add 10 to 14 days on Asia-to-Europe/Africa lanes have put pressure on inventory planning for critical components such as semiconductors and power supplies. On the demand side, tower and operator procurement increasingly hard-code safety, delivery, and lifecycle requirements into tenders, while localization initiatives (for example, joint ventures in India for telecom equipment manufacturing) broaden the ecosystem of contract manufacturing and service partners supporting installation and field maintenance.
Competitive Landscape
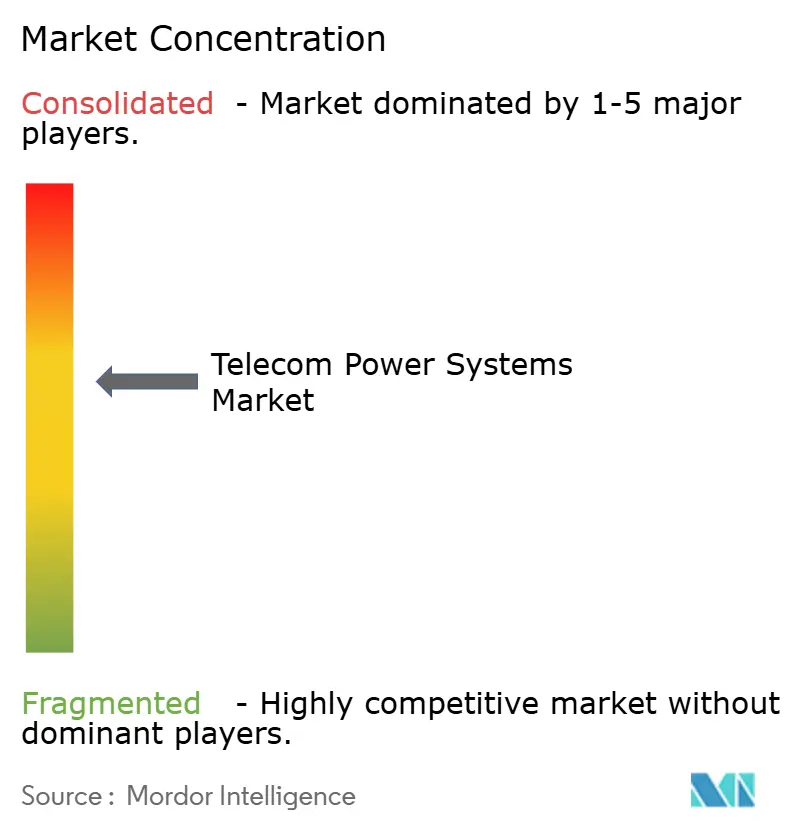
The top five vendors account for roughly 65% of global revenue, giving the telecom power systems market a moderate concentration profile. Huawei Digital Power exploits component-to-system integration, delivering turnkey DC plants with embedded AI energy management. Delta Electronics leverages power-electronics know-how to package rectifiers and battery cabinets into integrated outdoor enclosures that speed site rollout. Vertiv expands through acquisitions, most recently Bixin Energy Technology, to offer cooling systems matched to the rising heat density of combined telecom-edge deployments.
Strategic consolidation is visible in Liberty Energy’s acquisition of a specialist renewable power integrator, enabling bundled diesel-solar offers for remote towers. Edge-focused power innovators provide modular micro-grids under energy-as-a-service terms, easing capex constraints for smaller operators. Competition is shifting from upfront box pricing to lifetime energy cost, uptime guarantees, and carbon accounting dashboards. Vendors with global service networks hold an edge because swift parts logistics and field support materially affect operating expenditure for tower owners.
Open-standards initiatives around high-voltage DC interfaces threaten to commoditize basic rectifier hardware, prompting incumbents to differentiate via software, lifecycle services, and integrated cooling. At the same time, regional specialists win share by tailoring cabinets to local environmental codes, whether seismic reinforcement in Japan or anti-corrosion coatings in coastal India. Overall, scale, software intelligence, and renewable integration capabilities define competitive positioning across the telecom power systems industry.
Telecom Power Systems Industry Leaders
-
Eaton Corporation
-
Cummins Inc.
-
ZTE Corporation
-
Enedo (Efore Group)
-
Huawei Digital Power
- *Disclaimer: Major Players sorted in no particular order

Market Opportunities and Future Outlook
The accelerated refresh cycle toward energy-efficient power and cooling systems that comply with emerging measurement and evaluation requirements is creating near-term pull from operators. China MIITs YD/T 3032-2026, effective September 1, 2026, formalizes energy-efficiency evaluation for telecom rooms and stations. This creates whitespace for vendors that package high-efficiency rectifiers, hybrid AC/DC distribution, and monitored cooling into auditable site upgrades rather than standalone hardware swaps.
The shift from VRLA to lithium-ion also opens supplier and integrator headroom in both batteries and controls, particularly where operators want longer-life packs that support higher cycling and telemetry-rich battery management. A concrete capacity signal comes from India, where Exide Industries announced a INR 6,000 crore capex program aimed at expanding in-house lithium-ion manufacturing capability to serve telecom use cases. In parallel, standardized monitoring and power-parameter interfaces from ITU-T and ETSI (including battery monitoring/control and ICT equipment power parameters) support tighter integration of power plants into network management, enabling operators and towercos to treat energy systems as managed infrastructure with consistent data models across multi-vendor estates.
Recent Industry Developments
- June 2026: Cummins announced an agreement to supply high-efficiency natural gas generator sets (including HSK78 and QSK60 models) for a large-scale data center campus in West Texas, with deliveries scheduled through 2030. The deal highlights rising demand for resilient prime and backup power platforms that share technology and supplier ecosystems with telecom site generation and hybrid power deployments. It also underscores the strategic role of high-efficiency gensets as operators harden critical infrastructure against longer grid disturbance windows.
- May 2025: Cummins announced a strategic expansion of its high-efficiency power solutions for telecom sites, expanding modular and factory-integrated power blocks across additional regions. The initiative aims to shorten deployment timelines and simplify service through standardized platform variants across multiple country footprints.
- April 2024: Cummins introduced new generator set models as part of a broader push on reliable power solutions. Product portfolio updates at major engine OEMs influence the downstream availability of emissions-compliant, higher-efficiency generator options used across telecom bad-grid and off-grid sites. The refresh also supports integrators that standardize around common genset platforms for serviceability and spares across multi-country tower footprints.


Research Methodology Framework and Report Scope
Market Definition and Coverage
For this study, the telecom power system market covers the equipment and integrated solutions that supply, convert, store, and manage power for telecom network sites, so they can run reliably across grid-connected, poor-grid, and off-grid conditions.
Scope exclusions: The sizing excludes stand-alone generators or UPS units sold mainly for data centers, broadcast facilities, or general commercial backup use.
Segmentation Overview
-
By Power Range
- Low
- Medium
- High
-
By Power Source
- Grid-connected
- Diesel Generator
- Renewable (Solar, Wind)
- Hybrid (Solar-Diesel, Fuel-cell Hybrid)
-
By Component
- Power Supply Units
- Converters
- Rectifiers
- Inverters
- Controllers and Monitoring
- Batteries
- Generators
- Solar PV Modules
- Fuel Cells
- Cooling/Climate Systems
-
By System Architecture
- AC Power Systems
- DC Power Systems
- Hybrid AC/DC Systems
-
By Energy Storage Technology
- VRLA Battery
- Lithium-ion Battery
- Nickel-based Battery
- Super-capacitors
- Hydrogen Fuel Cell
-
By Network Generation
- 2G/3G Legacy
- 4G / LTE
- 5G NR
- Satellite / LEO Back-haul
- Private LTE / 5G Networks
-
By Output Power Configuration
- less than 2 kW
- 2 - 10 kW
- 10 - 20 kW
- above 20 kW
-
By Geography
-
North America
- United States
- Canada
- Mexico
-
South America
- Brazil
- Argentina
- Chile
-
Europe
- Germany
- United Kingdom
- France
- Italy
- Spain
- Russia
-
Asia Pacific
- China
- India
- Japan
- South Korea
- ASEAN
- Rest of Asia Pacific
-
Middle East and Africa
-
Middle East
- Saudi Arabia
- UAE
- Turkey
-
Africa
- South Africa
- Nigeria
- Kenya
-
Middle East
-
North America
Data Sources, Market Sizing, and Validation
Desk Research
Desk work started by mapping what is counted as a telecom site power stack and what is not, then aligning that scope to publicly available signals that can be checked by country. We referenced sources such as the International Telecommunication Union (ITU), the World Bank, the International Energy Agency (IEA), and national energy regulators to understand electricity access, reliability, and pricing context that affects telecom site design choices.
To convert that context into sizing inputs, we also used operator and tower company annual reports, investor presentations, and press releases on network rollouts, plus standards or guidance published on association and regulator websites. For cross-checks, shipment and trade patterns were reviewed using an import and export shipment-level database, and patent databases were used to gauge adoption direction in hybrid power, batteries, and site energy management. This list is illustrative only, and many other public and paid sources were used for data collection, validation, and clarification.
Primary Interviews and Surveys
Primary work focused on validating what gets installed at different site types and how pricing and replacement cycles move over time, since those details are not consistently visible in public sources. We spoke with a mix of equipment suppliers, system integrators, tower-focused service firms, and telecom stakeholders across APAC, EMEA, and the Americas to pressure-test assumptions and close gaps around volumes, average selling prices, and typical configurations.
Distribution of primary research fieldwork respondents
| Company type | Respondent position | Region |
|---|---|---|
| Top tier: 30% | CXOs: 17% | APAC: 44% |
| Mid tier: 53% | Functional/Unit leaders: 29% | EMEA: 31% |
| Smaller Players: 17% | Managers: 54% | Americas: 25% |
Market-Sizing & Forecasting
The market is modeled using a top-down approach where telecom site counts and rollout activity are translated into a demand pool, then converted into power-system value using typical configurations by grid condition. Once the demand pool was built, we corroborated totals using selective bottom-up approximations based on sampled price bands and channel checks for key building blocks, then adjusted where primary feedback showed consistent variance.
Key inputs feeding the model include the mix of on-grid, poor-grid, and off-grid telecom sites, the pace of new macro and small-cell deployments linked to 4G and 5G buildouts, battery chemistry shifts and replacement cycles, generator and hybridization penetration at remote sites, and cooling or heat management requirements in warmer climates. Average selling prices are handled as a blended ASP by system type and region, then translated into USD using consistent currency timing for the year being sized. For forecasting, we use scenario analysis around network expansion pace, energy reliability trends, and capex discipline, and we bring in expert views to keep the assumptions grounded. Where direct volume signals were thin, ranges were built and narrowed using adjacent indicators such as tower additions, rural coverage programs, and energy access data.
Data Validation & Update Cycle
Validation is done through repeated cross-checks between the model output and independent signals, such as rollout announcements, tower activity, and shifts in energy reliability that influence power stack choices. If a country or region output looks out of line, the drivers are rechecked, and when needed follow-up questions are sent back to interviewees to confirm whether the gap is definition, pricing, or timing.
Before sign-off, the work is reviewed in steps so assumptions, calculations, and conversion logic are checked by another analyst, followed by a final consistency scan across regions and years. The report is refreshed annually, and interim updates are made when a material event changes demand or pricing behavior. Right before delivery, a final pass is completed so clients receive the most current view available.
Mordor Intelligence's Telecom Power System Market Size Versus Other Published Estimates
Published numbers for telecom power systems often do not match because the underlying timing and counting rules are not the same, even when the market name appears similar. Differences usually come from what is treated as a full site power stack versus a narrower power sub-system, how hybrid energy components are priced, and whether local currency movements are aligned to the year being reported.
When refresh cadence is tighter, the current-year USD figure can shift because component ASPs move with battery pricing, generator costs, and regional mix, and those movements do not reach all regions at the same time. With annual model refreshes, consistent currency timing, and checks against site-level demand signals, Mordor Intelligence keeps the estimate tied to what is actually deployed at telecom network sites, instead of mixing in adjacent backup categories.
Benchmark comparison
| Source | Market Size | Gaps in Research Methodology |
|---|---|---|
| Mordor Intelligence | USD 5.35 B (2025) | |
| Global Consultancy A | USD 5.85 B (2025) | Often uses a wider component basket and may include a broader set of power hardware categories across telecom and nearby infrastructure, which can lift the 2025 total, especially if system-level ASP blending is less strict. |
| Industry Publisher B | USD 6.59 B (2025) | Commonly frames the market around AC, DC, and grounding systems with sales-led rollups, which can over-count when integrated hybrid solutions and non-telecom backup items are not filtered out consistently across regions. |
The spread across sources is mainly explained by how tightly the scope is limited to telecom site deployments, plus how pricing is converted and refreshed for the stated year. When the same deployment boundary is used and inputs are rechecked against rollout and site-condition signals, the resulting market value becomes easier to trace and replicate year to year.


Key Questions Answered in the Report
What is the current value of the telecom power systems market?
The telecom power systems market size is valued at USD 5.79 billion in 2026 and is forecast to reach USD 8.59 billion by 2031.
Why are lithium-ion batteries gaining popularity in telecom power plants?
Lithium-ion offers 2-3 × higher energy density, 12-15 years of service life, and 30-40% lower total cost of ownership compared with VRLA batteries, making them attractive for 5G sites with high power density.
Which region leads the telecom power systems market?
Asia Pacific holds the largest share at 40.60% in 2025 and is also the fastest-growing region with a 10.31% CAGR through 2031.
How do hybrid solar-diesel systems benefit telecom operators?
Hybrid configurations can cut diesel consumption by up to 70%, maintain 99.99% uptime, and reduce annual carbon emissions by nearly 78% per site, improving both operating cost and sustainability metrics.
What is driving demand for above 20 kW power configurations?
The shift toward massive-MIMO 5G radios and co-located edge computing racks is pushing per-site loads above 20 kW, leading to a 13.98% CAGR for high-capacity systems.
How do energy-efficiency mandates influence power-system procurement?
Regulations tying carbon performance to licensing motivate operators to adopt rectifiers, UPS, and monitoring software that collectively reduce site energy consumption by 15-30%, strengthening the business case for power-plant upgrades.
Page last updated on:





