Telecom Operations Management Market Size and Share
Market Overview
| Study Period | 2020 - 2031 |
|---|---|
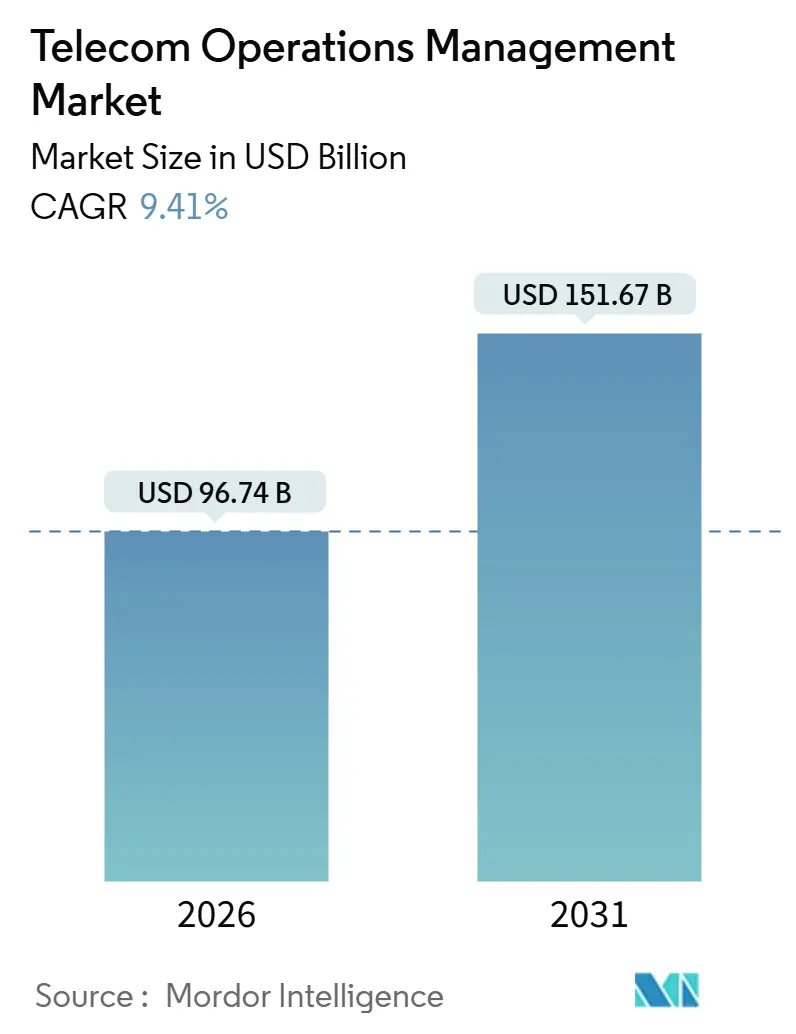
| Market Size (2026) | USD 96.74 Billion |
| Market Size (2031) | USD 151.67 Billion |
| Growth Rate (2026 - 2031) | 9.41% CAGR |
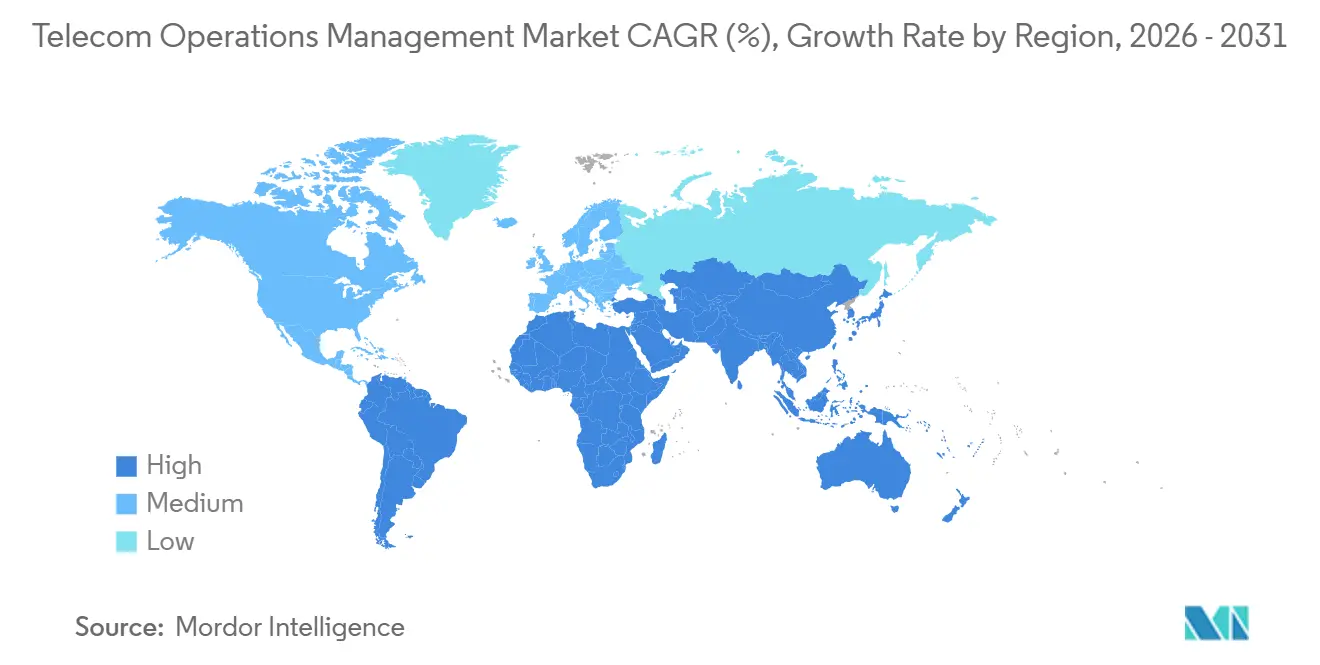
| Fastest Growing Market | Asia Pacific |
| Largest Market | North America |
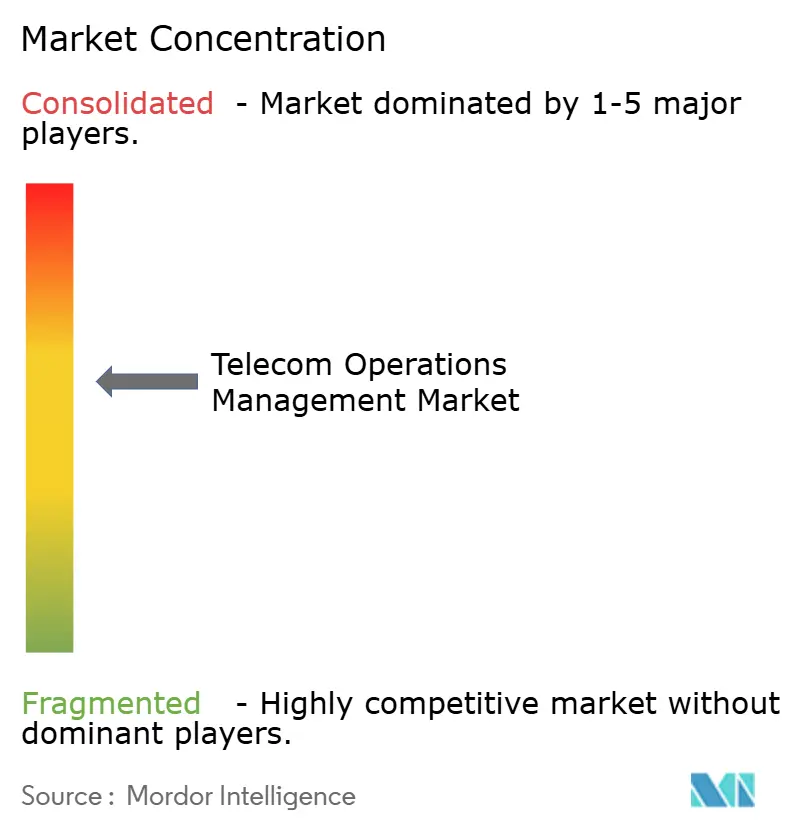
| Market Concentration | Medium |
Major Players *Disclaimer: Major Players sorted in no particular order Image © Mordor Intelligence. Reuse requires attribution under CC BY 4.0. | |
Telecom Operations Management Market Analysis by Mordor Intelligence
The telecom operations management market size stands at USD 96.74 billion in 2026 and is projected to reach USD 151.67 billion by 2031, advancing at a 9.41% CAGR. Continued migration from monolithic, on-premise OSS/BSS to cloud-native, API-first platforms dominates investment patterns as Tier-1 carriers re-architect stacks to monetize 5G standalone slices and edge resources. Spending momentum benefits vendors that bundle real-time charging, network automation, and AI copilots, because operators struggling with multi-generation network complexity seek turnkey solutions. Hyperscale cloud providers are reshaping commercial models by offering managed 5G cores and observability tools that bypass legacy integration layers. Competitive intensity is therefore shifting from pure-play telecom suppliers toward cloud and enterprise-software entrants, raising margin pressure for incumbents while accelerating innovation velocity.
Key Report Takeaways
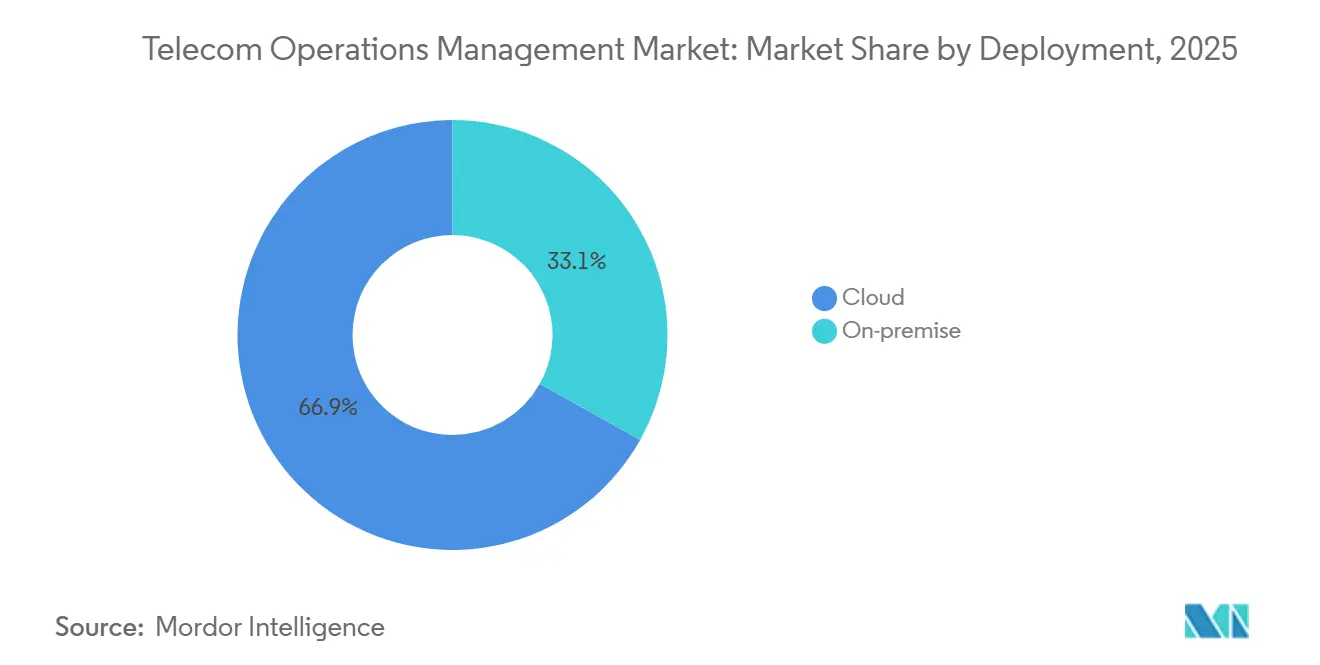
- By deployment type, cloud-based solutions held 66.89% of the telecom operations management market share in 2025, while hybrid and on-premises deployments lagged; cloud deployments are forecast to grow at a 9.89% CAGR through 2031.
- By solution type, software accounted for 59.11% of revenue in 2025, yet services are the fastest-growing component, advancing at a 9.84% CAGR across the forecast horizon.
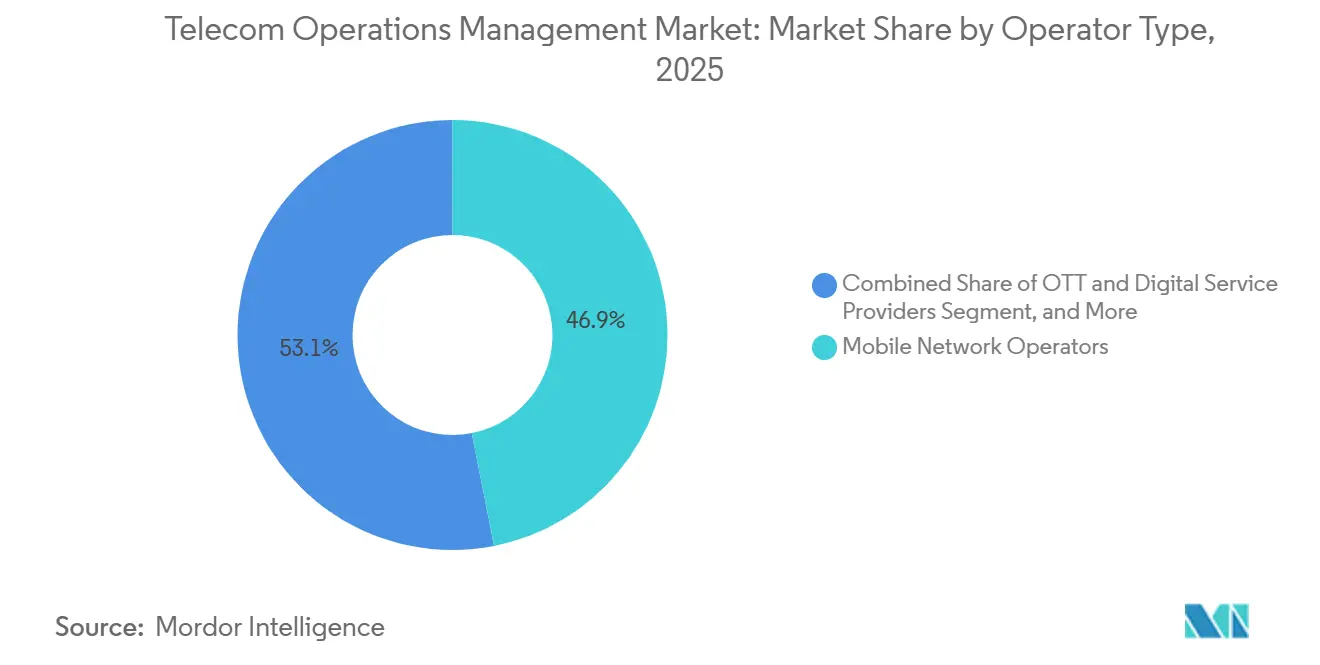
- By operator type, mobile network operators dominated spending with a 46.91% share in 2025, whereas over-the-top and digital service providers delivered the highest growth, expanding at a 10.23% CAGR.
- By end-use industry, telecom service providers retained 43.77% of the telecom operations management market in 2025, but healthcare is set to outpace all other verticals with an 11.13% CAGR.
- By geography, North America led with 36.73% market share in 2025; Asia Pacific has the strongest trajectory, growing at a 10.44% CAGR toward 2031.
Note: Market size and forecast figures in this report are generated using Mordor Intelligence’s proprietary estimation framework, updated with the latest available data and insights as of January 2026.
Global Telecom Operations Management Market Trends and Insights
Drivers Impact Analysis*
| Driver | (~) % Impact on CAGR Forecast | Geographic Relevance | Impact Timeline |
|---|---|---|---|
| Rising Demand for Enhanced Customer Experience | +1.8% | Global, peak in North America and Western Europe | Medium term (2-4 years) |
| Increasing Operational Costs and Complexity | +2.1% | Global, acute in Asia Pacific and Middle East | Short term (≤ 2 years) |
| Rapid Adoption of Cloud-Native OSS/BSS Platforms | +2.3% | North America and Europe lead, Asia Pacific accelerating post-2025 | Medium term (2-4 years) |
| 5G Standalone Rollouts Driving Network Automation Spend | +1.9% | Asia Pacific core, spillover to Middle East and Latin America | Long term (≥ 4 years) |
| Integration of AI Copilot Tools into NOCs | +1.4% | North America and Europe early adopters, Asia Pacific following | Medium term (2-4 years) |
| Telecom API Monetization Push Creating Upgrade Cycles | +1.2% | Global, with EU and India mandates | Long term (≥ 4 years) |
| Source: Mordor Intelligence | |||
Rapid Adoption of Cloud-Native OSS/BSS Platforms
Operators gaining elasticity from Kubernetes-based stacks cut capital outlays by up to 40%, accelerate service launches, and achieve five-nines availability during traffic spikes.[1]TM Forum, “Digital Transformation Tracker 8,” TMFORUM.ORG Major carriers, therefore, commit budgets to lift-and-shift legacy billing into container clusters even though dual-stack maintenance inflates short-term opex. Vendor ecosystems provide turnkey charging, policy, and exposure functions that simplify onboarding for edge applications. These moves create a virtuous cycle in which early adopters showcase cost savings, compelling followers to emulate architectures. Ongoing skills shortages, however, force many operators to rely on managed service contracts to complete migrations.
5G Standalone Rollouts Driving Network Automation Spend
Standalone cores unlock slicing and URLLC capabilities that only automated orchestration can manage at scale. China Mobile provisions slices in under 10 minutes using automation platforms, achieving a 90% reduction in workflow.[2]Huawei, “iMaster NCE Case Study,” HUAWEI.COM Greenfield U.S. implementations report up to 50% lower total cost of ownership than incumbents running legacy OSS stacks. Standards bodies forecast 1.2 billion standalone connections by 2027, with 18%-22% of infrastructure budgets earmarked for software automation. Operators in India and the Middle East embed automation early to tame spectrum complexity and guarantee latency for industrial use cases. These deployments collectively lift the telecom operations management market as software spend shadow-tracks radio rollouts.
Integration of AI Copilot Tools into Network Operations Centers
Generative-AI copilots translate natural-language intents into machine-readable configurations, triage alarms, and pre-populate remediation scripts. Early pilots cut mean time to repair by 40% and absorb 70% of routine incidents without human touch.[3]NVIDIA, “AI Aerial Platform,” NVIDIA.COM Cloud vendors integrate large language models into observability dashboards, enabling engineers to articulate outcomes rather than issuing CLI commands. Cost pressures amplify adoption because staffing reductions deliver rapid payback. Trust barriers remain, so most operators stage copilots in read-only mode before authorizing autonomous change, but progressive carriers in Japan and the United States are already granting limited write privileges in production networks.
Increasing Operational Costs and Complexity
Maintaining parallel 2G through 5G standalone cores stretches opex ratios to more than 70% of revenue in mature markets. Rising energy consumption compounds the burden as 5G base stations draw three to four times the power of 4G cells. Spectrum fragmentation means every new band adds distinct radios and propagation models, thereby multiplying the configuration items that OSS platforms monitor. Regulatory mandates now require 24-hour incident reporting across Europe, pushing additional compliance tooling into budgets. Collectively, these cost vectors strengthen the business case for automation and fuel demand growth within the telecom operations management market.
Restraints Impact Analysis*
| Restraint | (~) % Impact on CAGR Forecast | Geographic Relevance | Impact Timeline |
|---|---|---|---|
| Shortage of Efficient System Integrators | -1.6% | Global, acute in Asia Pacific and Latin America | Short term (≤ 2 years) |
| High Upfront Cost of Migrating Legacy Systems | -1.3% | North America and Europe | Medium term (2-4 years) |
| Security Liability Concerns in Multi-Tenant SaaS | -0.9% | Global, heightened in Middle East, Russia, China | Medium term (2-4 years) |
| Fragmentation of Open RAN Toolchains | -0.7% | North America and Europe early adopters | Long term (≥ 4 years) |
| Source: Mordor Intelligence | |||
Shortage of Efficient System Integrators
Demand for architects skilled in both mainframe COBOL and container orchestration outstrips supply, pushing wait times for Tier-1 consultancies to more than 18 months. Latin American and Southeast Asian operators often rely on offshore teams that lack local regulatory insight, adding 40%-60% to project timelines. Large IT firms prioritize higher-margin cloud migrations outside telecom, further tightening capacity. Vendors respond by launching rapid-deployment blueprints and low-code configurators, but still need integrators for complex data mapping. Until the talent gap narrows, the telecom operations management market encounters execution bottlenecks that temper growth.
High Upfront Cost of Migrating Legacy Systems
Full replacement of monolithic platforms can demand USD 50 million-USD 300 million per operator, including dual-stack run costs during 24-36-month transitions. Smaller carriers lack capital reserves to shoulder such expenditure, opting instead for tactical overlays that perpetuate technical debt. Boards remain cautious because revenue streams from network slicing and API commerce remain nascent, so return-on-investment models rely on optimistic uptake assumptions. Financing mechanisms such as revenue-share arrangements with cloud providers are emerging, yet balance-sheet impact still slows decision cycles. Consequently, deferred projects hold back the immediate expansion of the telecom operations management market.
*Our forecasts treat driver/restraint impacts as directional, not additive. The impact forecasts reflect baseline growth, mix effects, and variable interactions.
Segment Analysis
By Deployment: Cloud Dominance Accelerates Amid Hybrid Holdouts
Cloud implementations captured 66.89% of the telecom operations management market share in 2025, and this share is poised to widen as spending grows at a 9.89% CAGR through 2031. Public-cloud hosting of noncritical workloads delivers elastic scaling and pay-as-you-grow economics, letting operators trial new services without capital lock-in. Hybrid architectures address compliance needs in markets where data must remain on soil, blending on-premises billing with cloud-hosted analytics to reconcile sovereignty with agility. The telecom operations management market size allocated to on-premise systems continues to shrink because the total cost of ownership rises when proprietary hardware ages and vendor support winds down. Yet some rural carriers in Sub-Saharan Africa and Latin America still favor on-premise because unreliable backhaul links challenge cloud availability. Greenfield entrants demonstrate that full public-cloud deployments can achieve 50% lower lifetime costs, prompting regulators to ease restrictions and accelerate broader adoption.
Momentum toward cloud also shapes procurement patterns. Operators demand subscription licensing, continuous delivery, and open-API exposure from vendors, replacing decade-long enterprise contracts with evergreen SaaS agreements. Hyperscalers bundle infrastructure credits with migration services, compressing time-to-value. Meanwhile, private-cloud builds remain relevant for Tier-1 carriers handling highly sensitive subscriber data or operating under stringent banking-grade security rules. These divergent models ensure that, as cloud rules, hybrid options maintain a sizeable share of the telecom operations management market.


By Solution Type: Services Outpace Software as Complexity Rises
Software remained the revenue backbone with a 59.11% share in 2025, but escalating multi-vendor complexity is propelling services to a faster 9.84% CAGR. Systems integration now accounts for more than one-quarter of service revenue because microservice architectures require orchestration across dozens of container clusters. Managed-service contracts flourish among Tier-2 and Tier-3 players lacking DevOps expertise, shifting risk and staffing overhead to vendors. This trend increases the size of the telecom operations management market allocated to subscription-style service bundles tied to defined service-level agreements. Consulting demand also rises as carriers seek blueprints for monetizing 5G standalone and API marketplaces.
In software, network management suites still dominate, yet real-time charging solutions are the fastest-growing subsegment. Operators need per-transaction accounting for slice-based connectivity and edge compute workloads, driving upgrades ahead of 2028 volume inflection points. Customer and product management modules undergo a makeover to support dynamic bundling of connectivity, content, and cloud, underscoring how consumer experience priorities reshape back-office tooling. Collectively, these shifts cement services as the growth engine while software remains the foundational layer that anchors the telecom operations management market.
By Operator Type: OTT Providers Disrupt Traditional Spending Patterns
Mobile network operators accounted for 46.91% of spending in 2025, yet over-the-top and digital service providers posted the fastest 10.23% CAGR through 2031. API-driven business models require OTTs to integrate telecom-grade assurance and billing to comply with EU interoperability mandates and manage revenue-sharing deals. Consequently, the telecom operations management market size for OTT and digital services continues to expand even as traditional carrier budgets plateau.
Fixed-line operators are investing heavily to orchestrate DOCSIS 4.0 and fiber rollouts, accounting for roughly one-third of the segment's demand. MVNOs and MVNEs adopt cloud-native stacks quickly because they lack legacy encumbrances, helping them launch in new geographies within months rather than years. Convergence blurs categorical lines as tech giants secure spectrum leases and operate as quasi-carriers, further diversifying buyer profiles within the telecom operations management market.

By End-Use Industry: Healthcare Drives the Next Wave of Vertical Expansion
Telecom service providers still account for 43.77% of aggregate demand, but healthcare’s 11.13% CAGR makes it the fastest-rising vertical. Internet of Medical Things mandates, and reimbursement policies require 99.999% uptime, driving hospitals to deploy private 5G and automated slice management. These deployments elevate the telecom operations management market share devoted to latency-sensitive verticals and demand sophisticated fault isolation.
Information technology enterprises remain sizeable purchasers as they build private networks and edge clouds to host latency-critical workloads. Government and public-safety networks steadily invest in mission-critical OSS domains, while the manufacturing and automotive sectors embrace deterministic 5G slices for robotics and connected-vehicle coordination. Banking and retail pilot network-as-a-service models that rely on unified billing across fiber, cellular, and satellite links, demonstrating how diverse industries expand the telecom operations management market footprint.
Geography Analysis
North America retained 36.73% of spending in 2025, underpinned by USD 15 billion in OSS/BSS modernization across the three largest carriers and parallel investments by cable operators upgrading to DOCSIS 4.0. Public-cloud deployments proliferate because regulatory frameworks permit hosting subscriber data outside carrier premises, provided encryption and audit controls meet federal guidelines. Dish Network’s greenfield platform validated 50% lower total cost scenarios, encouraging incumbents to negotiate cloud credits with hyperscalers. Securing networks against supply-chain risks also drives uptake of automated threat-detection modules that integrate directly with operations consoles.
Europe follows a patchwork path because the Digital Markets Act and the Network and Information Security Directive 2 impose divergent compliance burdens across member states. Major multi-country groups invested EUR 10 billion (USD 11.3 billion) in 2024-2025 to create pan-regional cloud-native cores that still respect local data residency, nudging the telecom operations management market size higher despite regulatory friction. Post-Brexit divergence forces dual compliance tracks for operators straddling the United Kingdom and continental Europe, inflating project overhead. Russia’s strict localization laws keep public cloud share low, sustaining a residual on-premises segment.
Asia Pacific delivers the fastest CAGR of 10.44%. Chinese carriers operate more than 3.6 million 5G base stations and are automating provisioning to slash transport costs, expanding the telecom operations management market faster than any other territory. India’s leading operators invested USD 8 billion in modernization ahead of nationwide 5G rollouts, while Japanese and South Korean incumbents pilot AI copilots to halve incident resolution times. Australia channels spending toward fixed-wireless services in remote areas, illustrating how geography dictates architecture choices. Middle East commitments tied to Vision 2030 and national digitization agendas accelerate private-network automation, whereas Africa advances cautiously amid integrator shortages, though landmark cloud-native BSS deals signal future growth. South America moderates due to 4G coverage priorities, yet Brazil’s 2024 spectrum auctions set the stage for upticks from 2026 onward.

Competitive Landscape
Vendor concentration remains moderate: the top five suppliers hold a 40% share, but none exceeds 12%, reflecting domain fragmentation across software, services, and managed offerings. Incumbent telecom vendors infuse AI and predictive analytics into existing suites to protect installed bases; Ericsson’s reinforcement learning cuts radio access power consumption by 15% in live networks. Oracle leverages its Cerner acquisition to bundle healthcare connectivity solutions, targeting the fastest-growing vertical. Hyperscale clouds intensify rivalry by releasing low-code network builders that let operators spin up cores using native tools, siphoning budgets from traditional OSS providers. Standards such as TM Forum Open APIs reduce vendor lock-in, enabling carriers to swap modules more readily, which further pressures price points.
Specialist players carve profitable niches. Netcracker and CSG Systems dominate revenue assurance software, where incumbents underinvest, while Subex focuses on fraud analytics for emerging markets. Enterprise IT platforms also encroach: ServiceNow’s Lightstep observability and Cisco’s AgenticOps copilot blur lines between IT and network operations. Patent filings confirm the strategic pivot: between 2024 and 2025, vendors filed more than 1,200 patents covering autonomous operations, with Huawei, Nokia, and Ericsson accounting for over half. Mergers and strategic alliances will likely continue as suppliers seek scale and portfolio breadth, shaping future contours of the telecom operations management market.
Telecom Operations Management Industry Leaders
IBM Corporation
Telefonaktiebolaget LM Ericsson
Oracle Corporation
Hewlett Packard Enterprise Development LP
Huawei Technologies Co., Ltd.
- *Disclaimer: Major Players sorted in no particular order

Recent Industry Developments
- December 2025: Ericsson secured a USD 500 million contract with Vodafone Group to deploy cloud-native charging across 12 European markets, targeting 30% billing-cost reduction by 2027.
- November 2025: Oracle introduced Communications Billing and Revenue Management Cloud Service, winning early migrations from Telefónica and América Móvil.
- October 2025: IBM closed its USD 4.6 billion acquisition of Apptio, adding multi-cloud financial governance to its telecom toolkit.
- September 2025: Cisco launched AgenticOps, an AI copilot translating natural-language intents into multi-vendor configurations.


Global Telecom Operations Management Market Report Scope
The Telecom Operations Management Market Report is Segmented by Deployment (On-premise, Cloud), Solution Type (Software, Services), Operator Type (Mobile Network Operators, Fixed-line Operators, MVNOs and MVNEs, OTT and Digital Service Providers), End-Use Industry (Telecom Service Providers, IT and Technology, Government, BFSI, Manufacturing, Healthcare, Other), and Geography (North America, Europe, Asia Pacific, Middle East and Africa, South America). Market Forecasts are Provided in Terms of Value (USD).
| On-premise | |
| Cloud | Public Cloud |
| Private Cloud | |
| Hybrid Cloud |
| Software | Network Management |
| Customer and Product Management | |
| Revenue Management | |
| Inventory Management and Other Software | |
| Services | Planning and Consulting |
| Operations and Maintenance | |
| System Integration | |
| Managed Services |
| Mobile Network Operators |
| Fixed-line Operators |
| MVNOs and MVNEs |
| OTT and Digital Service Providers |
| Telecom Service Providers |
| IT and Technology Enterprises |
| Government and Public Sector |
| Banking and Financial Services |
| Manufacturing and Automotive |
| Consumer Goods and Retail |
| Healthcare |
| Other End-Use Industries |
| North America | United States | |
| Canada | ||
| Mexico | ||
| Europe | Germany | |
| United Kingdom | ||
| France | ||
| Russia | ||
| Rest of Europe | ||
| Asia-Pacific | China | |
| Japan | ||
| India | ||
| South Korea | ||
| Australia | ||
| Rest of Asia-Pacific | ||
| Middle East and Africa | Middle East | Saudi Arabia |
| United Arab Emirates | ||
| Rest of Middle East | ||
| Africa | South Africa | |
| Egypt | ||
| Rest of Africa | ||
| South America | Brazil | |
| Argentina | ||
| Rest of South America | ||
| By Deployment | On-premise | ||
| Cloud | Public Cloud | ||
| Private Cloud | |||
| Hybrid Cloud | |||
| By Solution Type | Software | Network Management | |
| Customer and Product Management | |||
| Revenue Management | |||
| Inventory Management and Other Software | |||
| Services | Planning and Consulting | ||
| Operations and Maintenance | |||
| System Integration | |||
| Managed Services | |||
| By Operator Type | Mobile Network Operators | ||
| Fixed-line Operators | |||
| MVNOs and MVNEs | |||
| OTT and Digital Service Providers | |||
| By End-Use Industry | Telecom Service Providers | ||
| IT and Technology Enterprises | |||
| Government and Public Sector | |||
| Banking and Financial Services | |||
| Manufacturing and Automotive | |||
| Consumer Goods and Retail | |||
| Healthcare | |||
| Other End-Use Industries | |||
| By Geography | North America | United States | |
| Canada | |||
| Mexico | |||
| Europe | Germany | ||
| United Kingdom | |||
| France | |||
| Russia | |||
| Rest of Europe | |||
| Asia-Pacific | China | ||
| Japan | |||
| India | |||
| South Korea | |||
| Australia | |||
| Rest of Asia-Pacific | |||
| Middle East and Africa | Middle East | Saudi Arabia | |
| United Arab Emirates | |||
| Rest of Middle East | |||
| Africa | South Africa | ||
| Egypt | |||
| Rest of Africa | |||
| South America | Brazil | ||
| Argentina | |||
| Rest of South America | |||


Key Questions Answered in the Report
How large is the telecom operations management market in 2026?
It is valued at USD 96.74 billion and is on track to reach USD 151.67 billion by 2031.
Which deployment model is growing fastest?
Cloud-based deployments expand at a 9.89% CAGR as operators migrate workloads to public and hybrid clouds.
Why are healthcare organizations investing in telecom operations tools?
Remote patient monitoring and IoMT mandates demand 99.999% uptime and automated slice management, driving 11.13% CAGR in healthcare spending.
Which region will see the highest growth through 2031?
Asia Pacific leads with a projected 10.44% CAGR, propelled by large-scale 5G standalone rollouts and automation initiatives.
How are AI copilots changing network operations?
Early adopters report 40% reductions in mean time to repair because copilots automate alarm triage and configuration remediation.
What is the biggest barrier to cloud-native OSS/BSS migration?
A shortage of skilled system integrators extends project timelines and raises costs, tempering near-term migration momentum.
Page last updated on:


