Asia Pacific Telecom Towers Market Size and Share
Market Overview
| Study Period | 2019 - 2030 |
|---|---|
| Forecast Data Period | 2025 - 2030 |
| Historical Data Period | 2019 - 2023 |
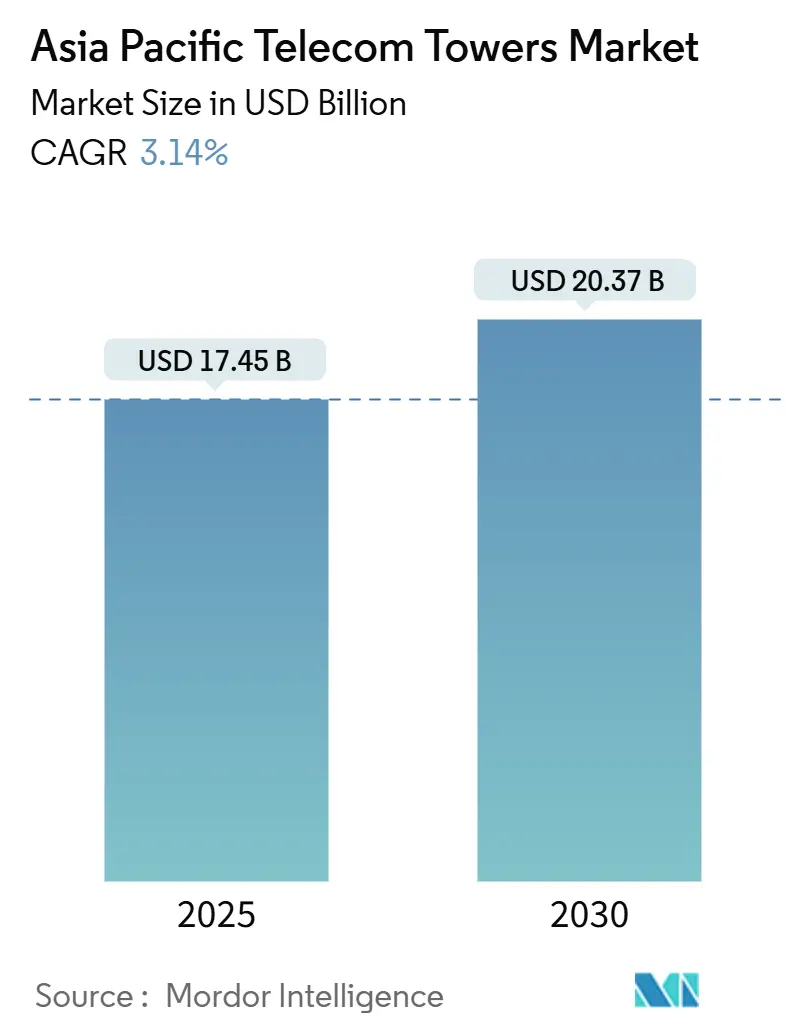
| Market Size (2025) | USD 17.45 Billion |
| Market Size (2030) | USD 20.37 Billion |
| Growth Rate (2025 - 2030) | 3.14% CAGR |
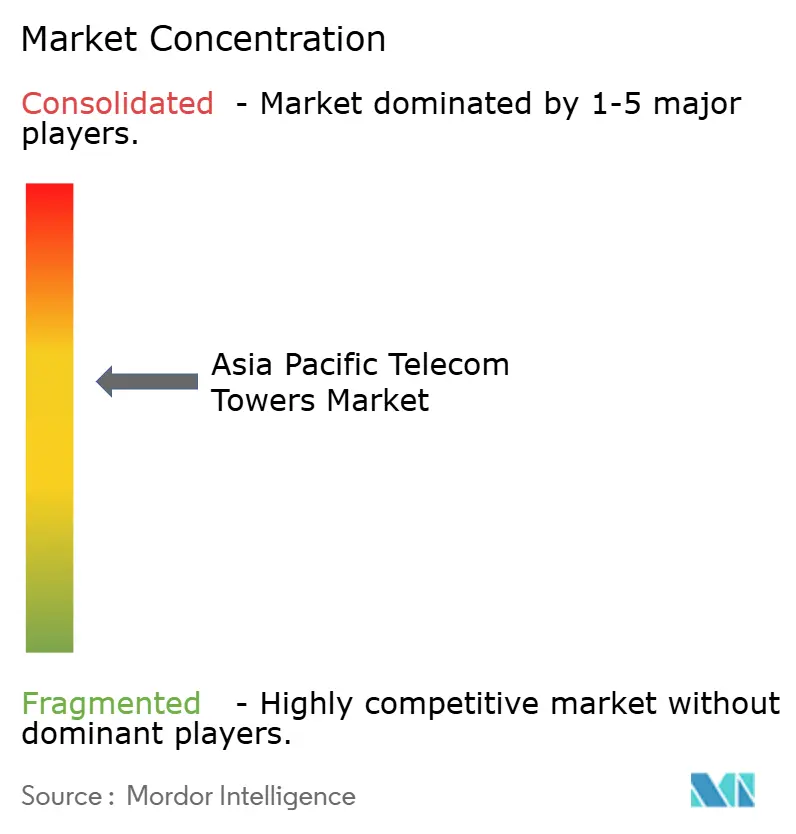
| Market Concentration | Medium |
Major Players *Disclaimer: Major Players sorted in no particular order Image © Mordor Intelligence. Reuse requires attribution under CC BY 4.0. | |
Asia Pacific Telecom Towers Market Analysis by Mordor Intelligence
The Asia Pacific Telecom Towers Market size is estimated at USD 17.45 billion in 2025, and is expected to reach USD 20.37 billion by 2030, at a CAGR of 3.14% during the forecast period (2025-2030). In terms of installed base, the market is expected to grow from 771.11 thousand units in 2025 to 874.5 thousand units by 2030, at a CAGR of 2.55% during the forecast period (2025-2030).
Measured growth reflects the region’s shift from rapid green-field build-out to optimization and densification, a phase driven by 5G spectrum utilization, evolving network architectures, and edge-computing alignment. Independent TowerCos command rising influence as operators monetize passive assets, while renewable-powered sites gain favor as energy costs and ESG mandates tighten. Shifting tenancy models, a surge of rural connectivity mandates, and coordinated infrastructure-sharing frameworks open fresh revenue channels, yet multi-layered permitting, land-lease inflation, and currency depreciation risks temper near-term momentum. Competitive intensity remains moderate, defined by selective divestments, technology-led differentiation, and a steady inflow of institutional capital seeking long-duration cash flows.
Key Report Takeaways
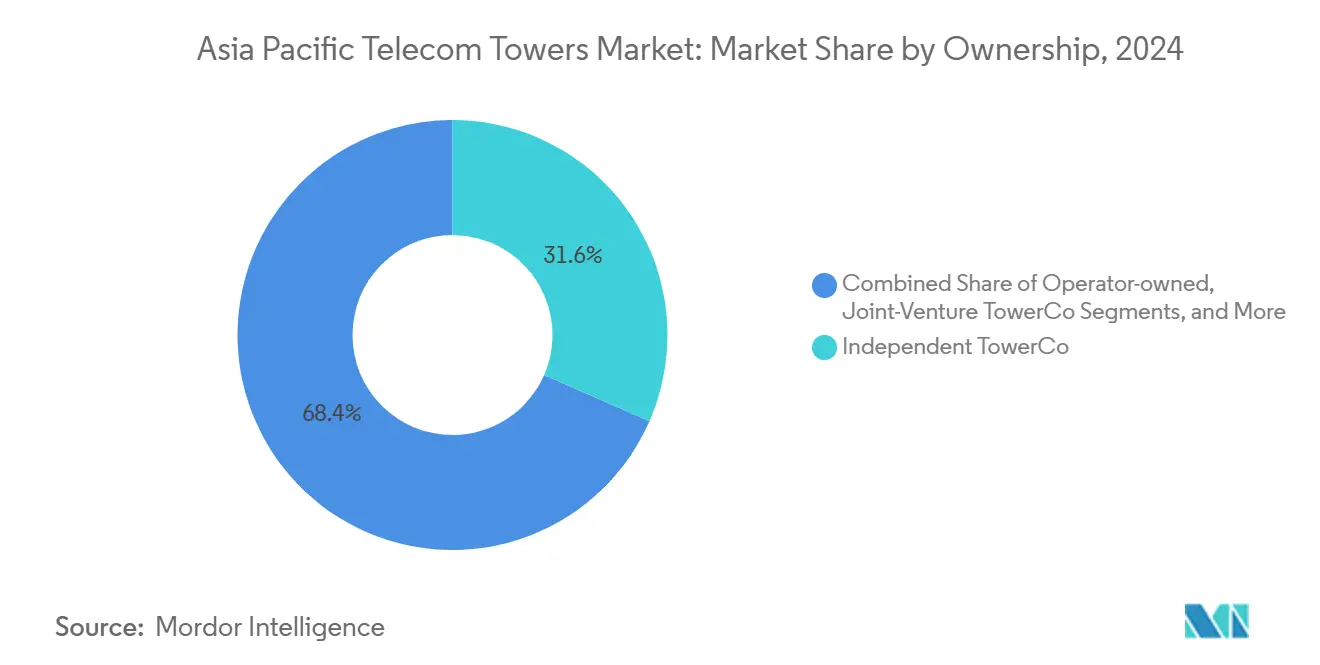
- By ownership, independent TowerCos led with 31.56% of the Asia Pacific telecom towers market share in 2024; the segment is set to post a 7.15% CAGR through 2030.
- By installation, ground-based sites held a 64.56% share of the Asia Pacific telecom towers market size in 2024, while rooftop deployments exhibit the fastest projected CAGR at 4.34% through 2030.
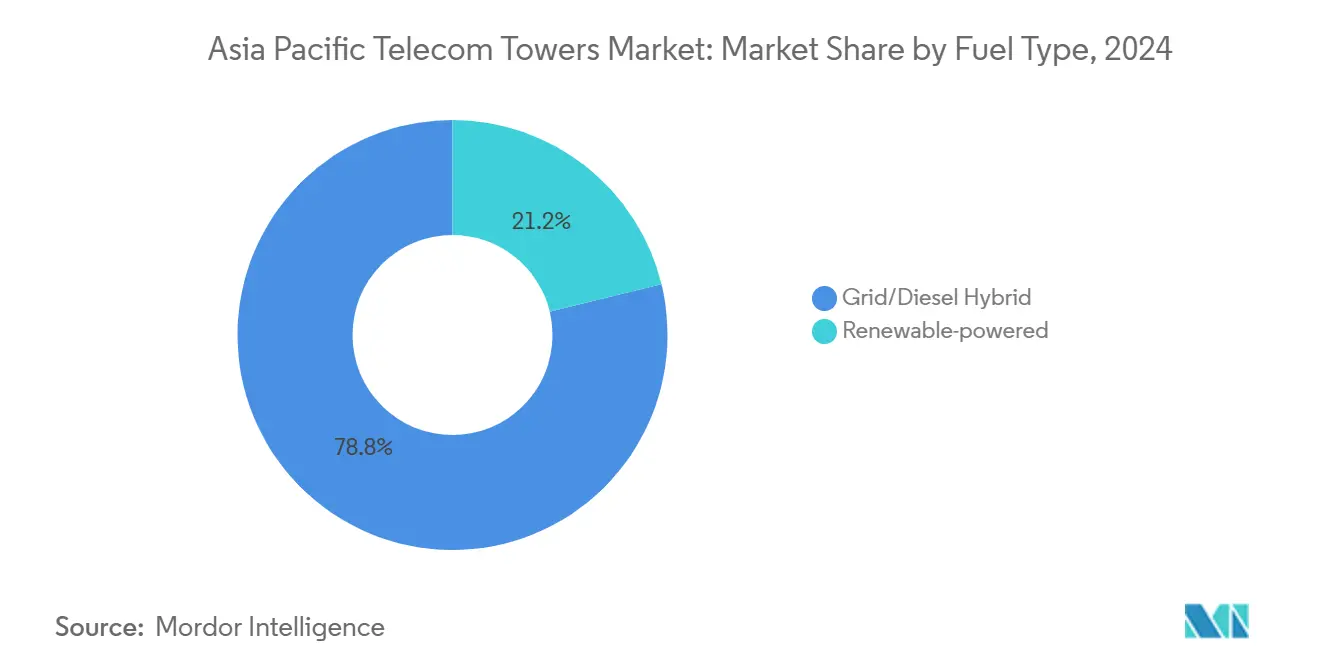
- By fuel type, grid/diesel hybrids accounted for 78.79% of the Asia Pacific telecom towers market size in 2024; renewable-powered sites are poised for a 16.71% CAGR to 2030.
- By tower type, monopoles captured 40.68% of the Asia Pacific telecom towers market share in 2024, whereas stealth structures are forecast to expand at a 7.47% CAGR to 2030.
- By country, China represented 51.87% of the Asia Pacific telecom towers market size in 2024; India is expected to grow at a 4.71% CAGR through 2030.
Asia Pacific Telecom Towers Market Trends and Insights
Drivers Impact Analysis*
| Driver | (~) % Impact on CAGR Forecast | Geographic Relevance | Impact Timeline |
|---|---|---|---|
| Surging 5G rollouts and densification needs | +1.2% | China, South Korea, Japan | Medium term (2–4 years) |
| Government-backed rural connectivity mandates | +0.8% | India, Indonesia, Bangladesh, Vietnam | Long term (≥4 years) |
| MNO network-sharing to cut capex/opex | +0.6% | Core Southeast Asia | Short term (≤2 years) |
| Rising data-center edge nodes on towers | +0.4% | Singapore, Malaysia, urban APAC | Medium term (2–4 years) |
| ESG push toward renewable-powered sites | +0.3% | Australia, Malaysia | Long term (≥4 years) |
| Satellite-to-cell partnerships demanding co-location | +0.2% | Remote Australia, New Zealand | Long term (≥4 years) |
| Source: Mordor Intelligence | |||
Surging 5G Rollouts and Densification Needs
Ongoing 5G deployment requires up to five times more sites per square kilometer than legacy networks, redirecting capital toward colocation-ready assets that support millimeter-wave coverage and ultra-low-latency use cases. China Tower Corporation’s small-cell strategy and high-capacity distributed antenna systems illustrate the operational shift, while edge nodes integrated at tower bases unlock incremental revenue from cloud and industrial IoT tenants [1]China Tower Corporation, “One Core Two Wings Strategy Briefing,” chinatowercom.com.
Government-backed Rural Connectivity Mandates
India’s Universal Service Obligation Fund, Indonesia’s Bakti program, and Bangladesh’s hybrid satellite-terrestrial pilots illustrate a state-sponsored push to shrink the digital divide. Fresh funding pools, spectrum discounts, and rollout deadlines oblige operators to extend footprints into power-constrained regions, a dynamic that directly raises build-to-suit demand for independent TowerCos.
MNO Network-sharing to Cut Capex/Opex
Infrastructure-sharing frameworks catalyze tenancy-ratio uplift and shave up to 40% from the total cost of ownership, accelerating asset-light strategies. Malaysia’s CelcomDigi leverages master-service agreements with EdgePoint and EDOTCO to preserve profitability during aggressive 5G expansion, while the Philippines’ PhilTower-MIDC venture demonstrates how joint structures can fast-track market consolidation.
Rising Data-center Edge Nodes on Towers
Hyperscalers and regional carriers integrate micro-data centers at tower sites to meet sub-10-millisecond latency targets. ST Telemedia Global Data Centres and U Mobile’s memorandum of understanding in Malaysia typifies the symbiosis, turning tower footprints into distributed compute hubs that reinforce tenancy growth [2]ST Telemedia Global Data Centres, “U Mobile-STT GDC MOU on 5G Edge,” sttelemediagdc.com.
Restraints Impact Analysis*
| Restraint | (~) % Impact on CAGR Forecast | Geographic Relevance | Impact Timeline |
|---|---|---|---|
| Sluggish permitting in tier-III Asian cities | –0.7% | India, Indonesia, Philippines, Vietnam | Medium term (2–4 years) |
| Rising land-lease and community opposition costs | –0.5% | Japan, South Korea, dense urban APAC | Short term (≤2 years) |
| Currency depreciation risk on USD-linked leases | –0.4% | Indonesia, Malaysia | Short term (≤2 years) |
| Fiber-first strategies reducing macro-tower demand | –0.3% | Australia, Singapore | Medium term (2–4 years) |
| Source: Mordor Intelligence | |||
Sluggish Permitting in Tier-III Asian Cities
Fragmented municipal approvals stretch project lead times by 6-12 months in secondary cities; financing costs climb while service gaps persist. Bangladesh’s 2025 spectrum auction progress still leaves operators navigating multi-layered clearances that dampen investment appetite [3]The Financial Express (Bangladesh), “Spectrum Allocation and 5G Infrastructure,” today.thefinancialexpress.com.bd.
Rising Land-lease and Community Opposition Costs
Escalating urban land values and increased public scrutiny push lease renewals upward and shorten tenure, eroding cash-flow predictability. Japan’s dense neighborhoods and South Korea’s aesthetic ordinances favor premium stealth structures, adding complexity and incremental capex even as they unlock previously off-limits zones.
*Our forecasts treat driver/restraint impacts as directional, not additive. The impact forecasts reflect baseline growth, mix effects, and variable interactions.
Segment Analysis
By Ownership: Independent TowerCos Propel Structural Change
Independent TowerCos captured 31.56% of the Asia Pacific telecom towers market share in 2024 and are projected to post a 7.15% CAGR through 2030, a trajectory fueled by operator asset-monetization and institutional investors’ appetite for infrastructure-yield. China Tower Corporation’s 2.094 million-site portfolio underscores the model’s scalability.
Operator-retained sites still dominate in markets with vertical-integration bias or nascent TowerCo ecosystems, yet rising capital requirements for 5G motivate further carve-outs. Joint-venture TowerCos offer a compromise for markets with local ownership mandates, while MNO captive holdings persist where bespoke coverage or security considerations outweigh efficiency gains.


By Installation: Rooftop Deployments Gain Urban Traction
Ground-based sites retained 64.56% of the Asia Pacific telecom towers market size in 2024, anchoring wide-area coverage across varied terrains. Rooftop structures, however, are pacing ahead at a 4.34% CAGR on the back of urban densification, high land costs, and expedited zoning.
Japan and South Korea exemplify mature rooftop penetration, where operators lease commercial roofs to shorten time-to-on-air. Malaysia’s year-over-year 119.9% 5G subscriber spike has similarly turned rooftops into quick-turn options that alleviate macro-tower congestion.
By Fuel Type: Renewables Accelerate Despite Grid Constraints
Grid/diesel hybrids commanded 78.79% of the Asia Pacific telecom towers market size in 2024, reflecting uneven grid reliability in emerging economies. Solar-hybrid and battery-storage systems are poised for a 16.71% CAGR as ESG metrics tighten and diesel prices fluctuate.
EdgePoint’s solar-hybrid tower near Kuala Lumpur cut fuel cost by 35% in its first operating quarter, validating the economics for larger rollouts. Indonesia’s 23% national renewable target is catalyzing integrated solar-plus-storage pilots, leveraging LFP battery systems that achieve >95.5% round-trip efficiency [4]ACROFAN/PRNewswire, “EVE Energy Storage at Solartech Indonesia 2025,” mus.acrofan.com.
By Tower Type: Stealth Solutions Mitigate Urban Friction
Monopoles held 40.68% of Asia Pacific telecom towers market share in 2024, favored for structural efficiency and multi-antenna compatibility. Concealed designs, however, will grow 7.47% annually as city planners and residents demand low-profile assets.
Lattice and guyed towers remain relevant for heavy load or rural span, yet planning-board aesthetics now shape approval odds in metropolitan Tokyo, Seoul, and Sydney. Premium stealth pricing is offset by higher lease rates tied to high-density traffic corridors.
Geography Analysis
China’s commanding 51.87% share underscores unrivaled operational scale, yet densification is now prioritized over footprint expansion. Strategic diversification into smart-energy services allows China Tower Corporation to leverage asset adjacency and sustain margin resilience.
India’s growth rests on parallel rural and 5G initiatives. Universal Service funds subsidize green-field sites while private TowerCos fast-track build-to-suit orders from Reliance Jio and Bharti Airtel. Foreign capital inflow remains robust, encouraged by clarified FDI rules and spectrum roadmaps.
Southeast Asia presents a patchwork of regulatory models. Malaysia’s Communications and Multimedia Act drives infrastructure pooling, supporting CelcomDigi’s nationwide rollout. Thailand’s independent TowerCo ownership surpassing 56% highlights a mature divest-and-lease model, while the Philippines sees emergent consolidation via PhilTower-MIDC’s 3,500-site platform. Vietnam’s geographically dispersed provinces and licensing complexity delay tower release cycles, yet spectrum reform promises upside. Developed markets, such as Japan, South Korea, and Australia, focus on urban small-cell addition and strategic M&A. Waveconn’s 170-site pickup from American Tower widens Australia’s independent footprint, confirming an active secondary-market pipeline.
Competitive Landscape
Competitive concentration sits in the mid-range as country-specific incumbents dominate their home bases while regional challengers selectively expand. China Tower Corporation anchors Mainland China; Indus Towers and Helios Towers target high-growth South Asia and frontier Southeast Asia, respectively.
Strategic divestment reshapes geography exposure. American Tower’s USD 2.5 billion India exit and concurrent Australian portfolio sale to Waveconn illustrate rotation toward higher-yield, lower-regulatory-risk territories. Private equity-backed platforms pursue bolt-on deals, evidenced by OMERS Infrastructure’s continued Stilmark integration.
Technology adoption forms a new battleground. Operators reward TowerCos integrating renewable energy, lithium-ion storage, and intelligent power management. EdgePoint’s hybrid-solar rollouts and EDOTCO’s carbon-reduction roadmap position both firms favorably in bid evaluations. Energy-efficient sites also attract hyperscalers seeking green footprints for edge compute, broadening tenancy prospects.
Asia Pacific Telecom Towers Industry Leaders
China Tower Corporation
Indus Towers Limited
American Tower Corporation
Mitratel (PT Telkom Indonesia (Persero) Tbk)
PT Tower Bersama Infrastructure Tbk
- *Disclaimer: Major Players sorted in no particular order

Recent Industry Developments
- April 2025: EdgePoint Infrastructure launched Malaysia’s first solar-hybrid tower, cutting diesel runtime by 35%.
- December 2024: China Tower Corporation completed its nationwide 5G upgrade across 2.094 million sites, broadening services into smart-city energy management.
- September 2024: PhilTower-MIDC finalized a 3,500-site merger, targeting 2,000 incremental build-to-suit towers for underserved Philippine provinces.
- September 2024: Waveconn closed the acquisition of American Tower’s 170-site Australian portfolio, bringing its national total to over 1,400 structures.
- June 2024: ST Telemedia Global Data Centers secured SGD 1.75 billion in funding led by KKR and Singtel to expand edge-linked campuses in India and Southeast Asia.


Asia Pacific Telecom Towers Market Report Scope
| Operator-owned |
| Independent TowerCo |
| Joint-Venture TowerCo |
| MNO Captive |
| Rooftop |
| Ground-based |
| Renewable-powered |
| Grid/Diesel Hybrid |
| Monopole |
| Lattice |
| Guyed |
| Stealth / Concealed |
| China |
| India |
| Japan |
| South Korea |
| Malaysia |
| Thailand |
| Vietnam |
| Rest of Asia Pacific (Australia and New Zealand, Philippines, Singapore, Bangladesh, Indonesia, and others) |
| By Ownership | Operator-owned |
| Independent TowerCo | |
| Joint-Venture TowerCo | |
| MNO Captive | |
| By Installation | Rooftop |
| Ground-based | |
| By Fuel Type | Renewable-powered |
| Grid/Diesel Hybrid | |
| By Tower Type | Monopole |
| Lattice | |
| Guyed | |
| Stealth / Concealed | |
| By Country | China |
| India | |
| Japan | |
| South Korea | |
| Malaysia | |
| Thailand | |
| Vietnam | |
| Rest of Asia Pacific (Australia and New Zealand, Philippines, Singapore, Bangladesh, Indonesia, and others) |


Key Questions Answered in the Report
How fast is the Asia Pacific telecom tower market expected to grow to 2030?
It is forecast to expand from USD 17.45 billion in 2025 to USD 20.37 billion by 2030, registering a 3.14% CAGR.
Which ownership model is expanding the quickest?
Independent TowerCos lead, holding 31.56% share in 2024 and projected to grow at 7.15% CAGR through 2030.
Why are rooftop towers gaining traction in major cities?
Urban densification, high land costs and faster permitting make rooftop structures the preferred solution, driving a 4.34% CAGR.
What fuels the shift toward renewable-powered tower sites?
ESG mandates, diesel price volatility and improved battery economics push renewable-powered sites toward a 16.71% CAGR.
Which country shows the strongest growth momentum?
India is projected to record the fastest growth at 4.71% CAGR on the back of rural coverage programs and 5G rollout.
How is competitive intensity evolving across the region?
Moderate consolidation persists; selective divestments and technology-focused upgrades define competition, with a market concentration score of 6.
Page last updated on:


