
Table And Floor Lamps Market Size and Share
Market Overview
| Study Period | 2020 - 2031 |
|---|---|
| Market Size (2026) | USD 26.41 Billion |
| Market Size (2031) | USD 33.08 Billion |
| Growth Rate (2026 - 2031) | 4.62 % |
| Fastest Growing Market | Middle East and Africa |
| Largest Market | Asia Pacific |
| Market Concentration | Low |
Major Players *Disclaimer: Major Players sorted in no particular order Image © Mordor Intelligence. Reuse requires attribution under CC BY 4.0. | |
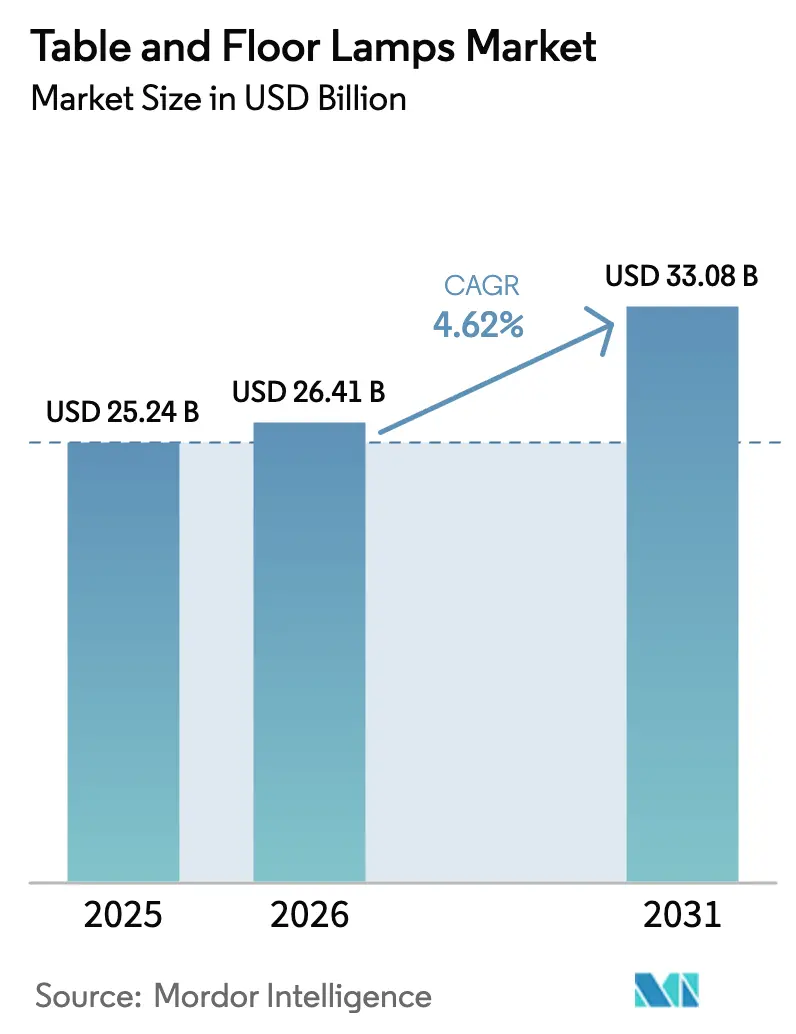
Table And Floor Lamps Market Analysis by Mordor Intelligence
The table and floor lamps market size in 2026 is estimated at USD 26.41 billion, growing from 2025 value of USD 25.24 billion with 2031 projections showing USD 33.08 billion, growing at 4.62% CAGR over 2026-2031. Hybrid work patterns, hospitality refurb cycles, and the democratization of LED technology keep demand resilient, while connected fixtures capture a growing premium as they serve as vital endpoints in home-automation ecosystems. Manufacturers extend product lifecycles through firmware updates, recurring software services, and modular components that allow aesthetic refresh without full replacement. A parallel pricing squeeze persists: do-it-yourself furniture giants amplify private-label competition, and raw-material cost swings pressure margins, yet strong secondary LED replacement demand cushions revenue. The market balances premium margins for connectivity with margin pressure from DIY furniture private labels and raw-material volatility, yet stricter energy-efficiency mandates continue to favor advanced LED designs, evidenced by the U.S. Department of Energy’s 2024 lamp rule that boosts annual consumer savings and drives manufacturer compliance[1].
Key Report Takeaways
- By product type, desk/task lamps led with 48.62% of the table and floor lamps market share in 2025, while floor lamps poised for the fastest 14.02% CAGR through 2031.
- By material, metal accounted for 35.78% revenue in 2025; wood is set to expand at 14.28% CAGR to 2031 in the table & floor lamps market.
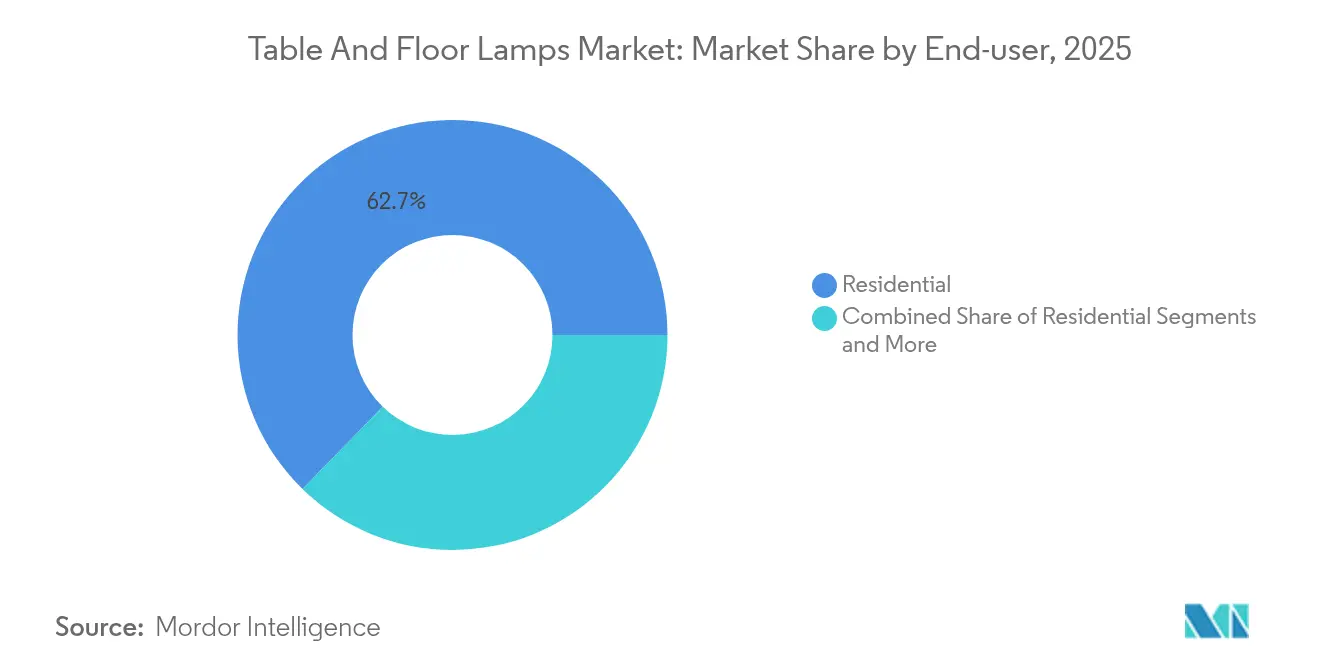
- By end user, the residential sector captured 62.71% of revenue in 2025 and is forecast to grow 13.92% to 2031 in the table & floor lamps market.
- By distribution, offline outlets held 40.62% revenue in 2025, whereas online sales will accelerate at 13.68% CAGR through 2031 in the table & floor lamps market.
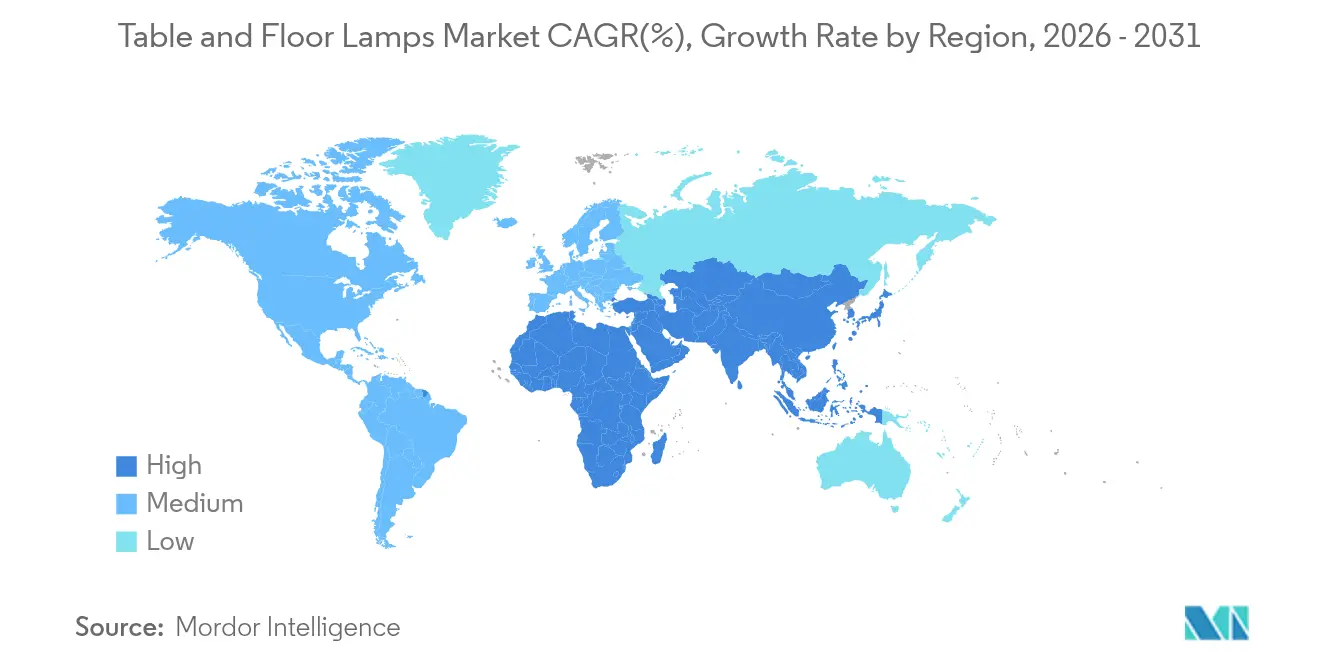
- By geography, Asia-Pacific commanded 34.11% revenue in 2025; Middle East & Africa is the fastest-growing region at 9.21% CAGR.
- Top 5 player such as Signify (Philips Lighting), IKEA Group, Acuity Brands Lighting, FLOS, Artemide holds major market share in 2024.
Note: Market size and forecast figures in this report are generated using Mordor Intelligence’s proprietary estimation framework, updated with the latest available data and insights as of 2026.
Market Trends and Insights
Drivers Impact Analysis of Table And Floor Lamps Market*
| Driver | (~) % Impact on CAGR Forecast | Geographic Relevance | Impact Timeline |
|---|---|---|---|
| Proliferation of smart-home ecosystems boosting connected lamps | +1.2% | Global, with early adoption in North America & EU | Medium term (2-4 years) |
| Growing penetration of LED-integrated decorative lamps | +0.8% | Global, accelerated in APAC manufacturing hubs | Short term (≤ 2 years) |
| Rapid hotel-room refurb cycles in lifestyle and boutique segments | +0.6% | North America & EU hospitality markets, expanding to APAC | Medium term (2-4 years) |
| Workplace wellness programs embracing circadian-lighting task lamps | +0.4% | North America & EU corporate markets | Long term (≥ 4 years) |
| Surge in short-term rental hosts demanding statement lighting | +0.5% | Global urban centers, concentrated in North America & EU | Short term (≤ 2 years) |
| AI-driven design-to-manufacture platforms enabling micro-brands | +0.3% | Global, with technology hubs leading adoption | Medium term (2-4 years) |
| Source: Mordor Intelligence | |||
Proliferation of Smart-Home Ecosystems Boosting Connected Lamps
Connected fixtures stand at the forefront where illumination converges with IoT, transforming the table and floor lamps market from commodity décor pieces into interactive nodes that respond to voice, occupancy, and security cues. Consumers expect seamless pairing with voice assistants and mobile dashboards, making interoperability a baseline rather than a luxury. The value comes not just from switching or dimming but from color-temperature tuning that syncs to circadian rhythms, adaptive light levels informed by ambient sensors, and predictive usage analytics that conserve energy. These functions justify higher average selling prices and subscription revenues for cloud-based scene libraries and remote diagnostics, lifting margins while binding customers to brand ecosystems. The desk-lamp category benefits disproportionately, as knowledge workers demand granular control to reduce eye strain and extend productive focus windows. Brands now embed upgradeable wireless chips and open APIs to future-proof purchases, turning lamps into long-life platforms rather than disposable appliances.
Growing Penetration of LED-Integrated Decorative Lamps
LED maturity has erased the historical efficiency-price trade-off, pushing the table and floor lamps market toward unqualified LED standardization. LEDs cover 70% of global lamp sales, and the looming secondary replacement wave—5.8 billion units in 2024—sustains volume even as lifetimes lengthen. Miniaturized emitter footprints unleash daring shapes and ultra-thin profiles, while addressable RGB arrays let one lamp toggle between task brightness and lounge mood at the swipe of a screen. Manufacturing cost curves now allow mainstream price points, making decorative LED pieces accessible in mass retail and hospitality alike. For designers, LED boards embedded in organic or translucent substrates enable fresh narratives; for consumers, top-tier color rendering and 50,000-hour lifespans translate to longer satisfaction cycles and reduced maintenance costs.
Rapid Hotel-Room Refurb Cycles in Lifestyle and Boutique Segments
Social-media-driven brand storytelling compels hotels to refresh lighting schemes every few years, shortening refurb cycles that once spanned a decade. Unique floor lamps and sculptural table pieces act as Instagram backdrops, enhance perceived room value, and influence booking conversions, driving premium procurement budgets. Operators deploy dynamic LED arrays to match daytime business energy with evening leisure ambiance, optimizing revenue per available room through experiential differentiation. Energy-efficient fixtures cut utility bills and maintenance downtime, easing payback calculations. Brands increasingly specify connected controls that integrate with property-management systems to monitor occupancy and automate dimming when rooms are vacant, lifting sustainability credentials while streamlining operations.
Workplace Wellness Programs Embracing Circadian-Lighting Task Lamps
Corporate wellness budgets have spotlighted lighting as a quantifiable performance lever, with many employers allocating 20–30% extra for circadian-aligned systems that regulate melatonin and cortisol cycles. Task lamps that shift from cool noon whites to warm evening ambers support focus in open offices and minimize after-work fatigue, directly feeding retention targets as hybrid workers weigh in-office experience against home comfort. Employers capture granular usage data through connected drivers, correlating light patterns with productivity dashboards and tailoring future layouts based on empirical feedback. The market monetizes via premium optics, tunable LEDs, and Bluetooth mesh modules embedded in otherwise familiar form factors, creating upgrade triggers even where general ceiling lighting has already migrated to LED.
Restraints Impact Analysis of Table And Floor Lamps Market*
| Restraint | (~) % Impact on CAGR Forecast | Geographic Relevance | Impact Timeline |
|---|---|---|---|
| Margin pressure from DIY furniture-store private labels | -0.7% | Global, particularly intense in North America & EU | Short term (≤ 2 years) |
| Safety-code tightening on portable luminaires (fire and tip-over) | -0.3% | Global, with varying implementation timelines by region | Medium term (2-4 years) |
| Volatility in metal and glass commodity prices | -0.4% | Global, with manufacturing hubs most affected | Short term (≤ 2 years) |
| Lengthening replacement cycles due to ultra-long-life LEDs | -0.2% | Global, mature markets experiencing first | Long term (≥ 4 years) |
| Source: Mordor Intelligence | |||
Margin Pressure from DIY Furniture-Store Private Labels
Mega-retailers exploit integrated supply chains to debut private-label lamps that undercut branded rivals by double-digit percentages while offering acceptable build quality. IKEA’s top-five market status exemplifies how bundled home-furnishing assortments steer shoppers away from specialist brands. Mid-tier producers feel the squeeze, prompting portfolio rationalization, regional exit strategies, or downstream mergers financed by private equity. Kingswood Capital’s USD 256 million sweep of Kichler and Progress Lighting into Coleto Brands illustrates that scale consolidation is a preferred defense. Legacy names now couple proprietary app ecosystems and designer collaborations to justify price premiums and shield margin integrity.
Safety-Code Tightening on Portable Luminaires
Regulators have refreshed standards such as UL 1598 to add tougher fire, tip-over, and wet-location requirements, imposing fresh engineering, testing, and documentation expenses. China’s GB/T 9473-2022 for reading lamps adds another compliance layer for exporters. Certification bottlenecks lengthen time-to-market, particularly for artisanal labels unfamiliar with multi-region regimes. Costs also rise for component traceability, grounding, and safety labeling, reshaping design priorities and nudging smaller firms toward OEM partnerships or exit.
*Our forecasts treat driver/restraint impacts as directional, not additive. The impact forecasts reflect baseline growth, mix effects, and variable interactions.
Table And Floor Lamps Market Segment Analysis
By Product Type:
Task Lighting Dominates Amid Wellness FocusDesk/task lamps generated the largest slice of the table and floor lamps market in 2025, seizing 48.62% revenue as employers and home workers converge on circadian-aligned illumination. Segment revenue reached USD 12.27 billion in 2025, and analysts project a steady 3.82% CAGR through 2031 as hybrid workflows persist. Floor lamps remain the breakout star, poised for a 14.02% CAGR, because hospitality operators and short-term landlords crave sculptural pieces that double as statement art. Traditional table lamps stay relevant, particularly when retrofitted with Wi-Fi drivers or voice-control modules that enable automation scenes. Accent, torchiere, and niche reading formats maintain modest volume, yet achieve healthy margins thanks to specialized optics and materials that address aging eyesight and design eccentricities. Competitive dynamics encourage multipurpose hybrids—task heads mounted on ambient towers—allowing a single SKU to satisfy living-room ambiance and focused worktop duties. Such versatility sustains upselling potential even as minimalism trends influence furniture footprints.
Second-generation smart task lamps integrate occupancy sensors, glare-control louvers, and USB-C charging docks, streamlining desktop clutter. Employers quantify lighting efficacy via wellness audits, correlating spectrum shifts with biometric feedback from wearables, thereby turning lamps into participatory wellbeing assets. The segment’s premium tier enjoys lower price elasticity: corporate buyers allocate budget based on productivity gains rather than unit cost. Conversely, entry-level desk fixtures sold through mass e-commerce lean on commodity LEDs and plastic housings, showing thin margins yet vast unit potential. The table and floor lamps market size for desk/task lamps is set to approach USD 15.36 billion by 2031, underscoring persistent dominance even as newer categories accelerate.


By Material:
Metal Leadership Faces Sustainable InnovationMetal remained the material of choice in 2025, holding 35.78% revenue, primarily through steel and aluminum constructions that grant durability, thermal management for LEDs, and broad aesthetic range. Robust supply chains and CNC versatility streamline design iterations, letting brands combine brushed finishes with powder-coat colors for rapid trend response. Nonetheless, wood posts the highest 14.28% CAGR outlook thanks to sustainability appeal and emerging research on transparent, phosphorescent wood panels that emit soft afterglow while showcasing natural grain. Such composites ally eco-credentials with functional luminosity, attractive to eco-conscious millennials who value carbon narratives simplified through FSC-certified sourcing.
Glass persists as the premium medium for sculptural statement lamps, leveraging optical clarity and hand-blown craftsmanship to tap luxury price bands. Glass also benefits from LED’s low heat output, allowing thinner profiles without thermal cracks. Ceramic resurges in boutique studios where tactile glazes produce individualistic finishes; small-batch ceramic runs exploit local clay traditions and align with the burgeoning “slow décor” movement. Recycled plastic alloys and hemp-fiber biopolymers populate budget-friendly lines, their color flexibility supporting seasonal palettes. As commodity metals face price unpredictability, design teams adopt mixed-material strategies—metal frames with wooden arms or rattan shades—to hedge costs and lift perceived artisanal value. Segment leaders now disclose life-cycle assessments, reinforcing transparency and tipping procurement decisions among contract buyers weighing ESG metrics.
By End-User:
Residential Dominance Amid Commercial InnovationHomeowners remained the central buyers, accounting for 62.71% of sales in 2025 as the work-from-anywhere wave spurred home-office upgrades and living-room mood-lighting makeovers. Residential demand is forecast to climb 13.92% through 2031, encouraged by falling prices for Wi-Fi modules and the mainstreaming of voice-controlled ecosystems. Within the commercial channel, hospitality venues drive premium orders: lifestyle hotels specify unique floor statements to anchor lobby identity, and chain operators pre-install smart dimming to satisfy green-building certifications. Offices, coworking hubs, and tech campuses adopt personal desk luminaires that sync circadian rhythms, often bundled under corporate wellness budgets for demonstrable return.
Retailers and restaurants deploy color-tunable lamps to evoke brand mood, while healthcare facilities specify glare-free, disinfectant-resistant housings aimed at patient comfort and staff efficacy. Education sectors migrate toward LED systems primarily to slash energy bills and maintenance downtime, but limited capital expenditures cap adoption of advanced controls. Government buildings and public libraries participate, spurred by mandates that align procurement with national efficiency or circularity goals. Industrial buyers remain a niche, focusing on rugged fixtures that handle vibration and dust, though interest grows in biologically optimized break-room lighting that reduces shift-worker fatigue. The table and floor lamps market size for residential applications should exceed USD 20.86 billion by 2031, reinforcing retail dominance even as high-margin commercial niches flourish.
By Distribution Channel:
Digital Transformation AcceleratesPhysical retail retained 40.62% in 2025, capitalizing on tactile evaluation—color rendition and material heft still matter—especially for high-value art pieces. Specialty lighting boutiques curate designer assortments and offer shade customization, justifying double-digit price premiums. Home-center chains deploy aisle-end vignettes that encourage basket bundling with furniture, rugs, and paint, capturing impulse purchases. Department stores remain relevant in emerging markets where urban malls dominate middle-class shopping journeys.
Online channels, posting a 13.68% CAGR, evolve from simple click-through catalogs into immersive showrooms featuring 360-degree configurators, AR placement previews, and AI chat advisers that propose bulb color temperatures based on room photos. Brand-owned storefronts raise gross margins, collect first-party data, and nurture repeat business through loyalty perks. Marketplaces scale selection breadth and expedite delivery, but customer acquisition costs escalate, pressing vendors to optimize keyword bids and refine listing imagery. Social-commerce clips on platforms such as TikTok accelerate viral launches, enabling micro-brands to sell thousands of units overnight. Warranty and returns infrastructure improve, alleviating customer hesitation historically tied to shipping fragile glass. For wholesalers, e-procurement portals simplify contractor orders, integrating project schedules and digital spec sheets.
Geography Analysis
APAC Table and Floor Lamps Market
Asia-Pacific led the table and floor lamps market with 34.11% revenue in 2025 on the back of concentrated manufacturing clusters, competitive labor costs, and expanding urban middle-class consumption. China’s introduction of eight lighting standards in January 2024 underscores regulatory drive to elevate quality and safety while encouraging domestic innovation. Japan and South Korea showcase early-adopter appetite for voice-assistant lighting scenes and ultra-compact desk lamps suited to dense living spaces. India’s Smart Cities Mission and rising disposable incomes spur premium demand, although fragmented distribution networks pose reach challenges beyond tier-one metros. Southeast Asian economies, including Vietnam and Indonesia, see accelerating project pipelines in hospitality and residential high-rises, generating contract volumes for both domestic and foreign brands.
MEA Table and Floor Lamps Market
Middle East & Africa posts the fastest 9.21% CAGR forecast to 2031, propelled by mega-projects in Gulf states, energy diversification strategies, and robust hospitality pipelines targeting tourism diversification. The UAE lighting sector, valued at USD 336 million, targets 15% growth as Dubai’s solar-park initiatives dovetail with architectural showpieces that specify smart LED installations. Saudi Arabia’s Vision 2030 funds cultural hubs, entertainment districts, and luxury resorts that demand high-spec lamps for guest rooms and public lounges. African metros from Nairobi to Lagos modernize hotel stock and upscale residences, though erratic power supply pushes appetite for LED efficiency and integrated battery backup.
North America and Europe Table and Floor Lamps Market
North America continues to display strong adoption of connected solutions; the U.S. Department of Energy’s tightened lamp efficiency rules effective July 2024 accelerate the shift toward integrated LED fixtures. Consumers embrace voice synchronization across smart-speaker ecosystems, and corporate buyers scale datacentric wellness pilots. European markets mirror North America in maturity but intensify circular-economy criteria, rewarding brands that offer repairable modules and certified recycled content. In Germany and the Nordics, public procurement frameworks now award points for end-of-life recyclability, steering tenders toward modular designs. Despite slower unit growth, both regions offer high average selling prices and early adoption for emerging control protocols such as Matter, reinforcing their influence on global standards.
Regulatory Landscape
The regulatory environment for table and floor lamps is shaped by overlapping safety, energy-efficiency, and substance-restriction requirements that vary by region, but increasingly align with common global baselines. Portable-luminaire safety is commonly anchored to IEC 60598-2-4, and market access typically depends on destination-specific certifications such as CE marking in the EU, UL 153 in the United States, PSE in Japan, KC in South Korea, SAA in Australia, and SASO in Saudi Arabia. At the EU level, lighting products also fall under Ecodesign and EPREL registration, with Low Voltage Directive (LVD), EMC, and RoHS compliance covering electrical safety, electromagnetic compatibility, and restricted substances.
Standards and guidance are also being shaped by industry bodies that coordinate compliance narratives and implementation support. The Global Lighting Association (GLA) issued guidance on standby power in February 2026 and has published mercury-related regulatory guidance tied to fluorescent-lamp phase-downs in April 2025, reinforcing the broader shift toward LED-integrated designs and controls that reduce standby consumption. Alongside efficiency and substance restrictions, tightening safety expectations, including fire, tip-over, and wet-location suitability, increases test and documentation workloads for portable luminaires, pushing manufacturers toward certified components and earlier multi-region certification planning.
Value Chain Analysis
The table and floor lamps value chain typically starts with raw materials (metals, glass, wood, plastics) and electronics (LED modules, drivers, sensors, wireless chips), then moves through component suppliers such as lamp holders, switches, and power supplies. OEM/ODM assembly, certification and testing, and documentation follow, before distribution reaches contract/specification channels, mass retail, specialty lighting stores, and e-commerce. Compliance acts as a recurring gate across regions, and many exporters reduce re-testing and time-to-market risk by sourcing internationally certified components, for example VDE, UL, or ENEC-marked lamp holders and switches, then designing to common safety baselines before adapting labels, plugs, and required documentation for each market.
Positioning across the chain varies by business model. Signify benefits from vertical integration in LED and connected-lighting platforms, supporting repeatable modules and software features across both residential and professional projects. IKEA, meanwhile, uses private-label diode-on-board (DoB) modules and flat-pack logistics to compress costs and speed global replenishment. Acuity Brands focuses on commercial specification ecosystems that pair luminaires with sensors and controls for building-wide energy optimization, increasing the importance of software and controls partners. Across tiers, the value pool continues to shift toward electronics, firmware, and branded ecosystems, while commodity mechanical parts and housings remain more exposed to price competition and input-cost swings.
Competitive Landscape
The table and floor lamps market maintains moderate concentration, with Signify, IKEA Group, Acuity Brands, FLOS, and Artemide collectively anchoring revenue leadership. Private equity is an active reshape, Kingswood Capital forged Coleto Brands by acquiring Kichler and Progress Lighting for USD 256 million, aiming to unlock shared logistics, digital marketing, and cross-brand product lines. Technology giants likewise expand stakes; Siemens’ planned USD 10.6 billion purchase of Altair Engineering bundles the Toggled controls platform, signaling alignment between lighting and holistic building-automation stacks.
Established brands differentiate through R&D into multisensor drivers that measure sound, temperature, and air quality, positioning lamps as infrastructure for broader smart-space analytics. FLOS leans on Italian design heritage, partnering with architects for limited editions that command luxury margins. IKEA scales affordability through vertically integrated supply chains and diode-on-board (DoB) modules that minimize part counts. Signify fortifies connected ecosystems via the Hue portfolio and open APIs, licensing Zigbee and Matter firmware to third-party luminaires and collecting subscription revenue from cloud scene libraries. Acuity Brands invests in AI algorithms that orchestrate building-wide daylight harvesting and occupant-based energy optimization, evident in its 2025 acquisition of QSC that broadens its sensor and control logic footprint.
Threats arise from white-label imports featuring basic Bluetooth control at a fraction of branded prices. To preserve pricing power, leaders emphasize compliance with evolving standards like UL 1598 and EU-wide EcoDesign, which require rigorous photobiological safety and energy metrics. Micro-brands court Instagram aesthetics but face certification costs that hamper scaling. Strategic OEM alliances and contract manufacturing in Vietnam or Mexico help incumbents balance tariff risks and shorten lead times to North American and European markets. Emerging ESG scrutiny pushes all players to publish Scope 3 emissions baselines and commit to recyclable packaging, with early movers gaining procurement preference among institution buyers.
Table And Floor Lamps Industry Leaders
-
Signify
-
Artemide
-
Flod
-
IKEA
-
Acuity Brands Lighting
- *Disclaimer: Major Players sorted in no particular order
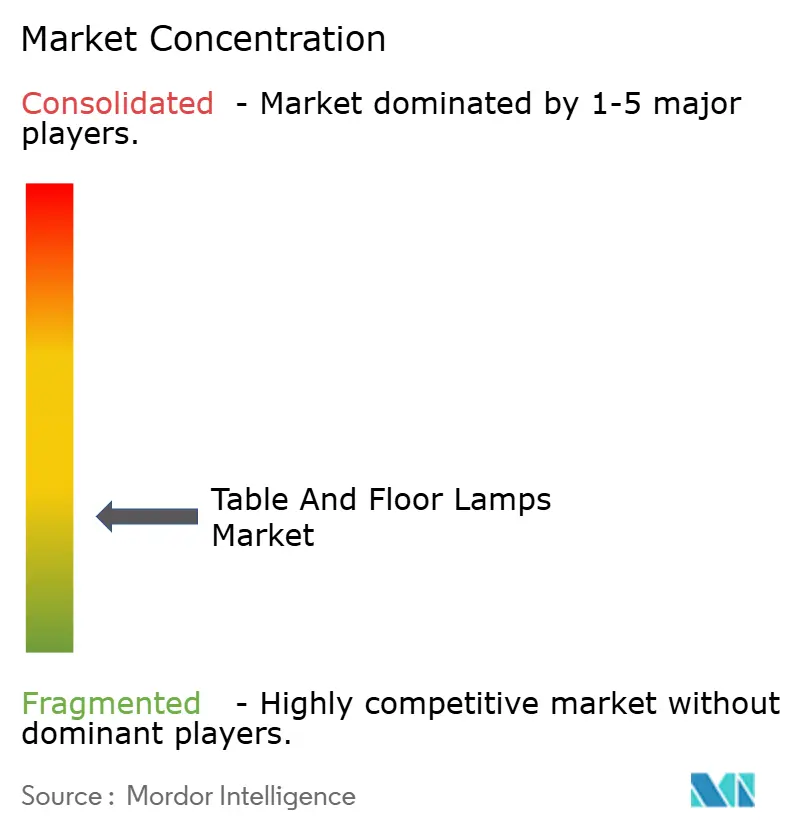
Table And Floor Lamps Market Companies Covered in this Report
- Signify (Philips Lighting)
- IKEA Group
- Acuity Brands Lighting
- FLOS
- Artemide
- Hudson Valley Lighting
- Generation Lighting (Visual Comfort)
- Kichler Lighting
- Eglo Leuchten
- Foscarini
- Lutron Electronics
- Ralph Lauren Home
- Quoizel
- House of Troy
- Adesso Inc.
- Zumtobel Group
- NVC Lighting
- Osram GmbH
- Zaozuo
- Targetti Sankey*
Market Opportunities and Future Outlook
Connected table and floor lamps that function as endpoints in smart-home ecosystems create a clear whitespace, especially where interoperability and control experience are becoming purchasing criteria rather than optional features. Signify's Philips Hue activity, including new Play-format lamps and wired switches in June 2026, illustrates how suppliers package table and floor lamps as part of an entertainment and automation stack, rather than only as decor. This supports differentiated SKUs that combine tunable light, sensors, and reliable multi-protocol integration, with additional post-purchase value through firmware updates and app-driven features.
A second opportunity area is compliance-led product redesign and circularity-friendly construction that reduces friction across regions and channels. EU access requirements that combine EPREL/Ecodesign with LVD, EMC, and RoHS compliance are encouraging more modular designs and tighter component traceability, which can be translated into clearer repairability narratives in markets where circular procurement criteria are gaining attention. For premium and contract segments, brands that invest in experiential retail and specifier engagement continue to pull demand; Artemide's opening of a new flagship showroom in Frankfurt in March 2026 supports designer-led and project-based selling. At the same time, e-commerce growth widens the addressable customer base for micro-brands and D2C launches, increasing the value of standardized certified platforms that can scale across marketplaces without repeated engineering changes.
Recent Industry Developments in Table And Floor Lamps Market
- June 2026: Signify expands smart home lighting portfolio with new wired switches, Play lamps, and next-generation candle bulbs. The launch broadens the connected lighting lineup across key markets, strengthening ecosystem lock-in and subscription-like revenue potential through Hue platform.
- May 2026: Signify Philips Smart Lighting turns the home into an experience. The initiative enhances consumer engagement in connected lighting, reinforcing premium connected-lighting positioning and ecosystem traction.
- March 2026: Artemide opens its new Frankfurt flagship showroom. The move boosts brand presence in design-focused market, supporting premium and architectural lighting sales through flagship retail presence.
Table And Floor Lamps Market Report Scope and Research Methodology
Market Definition and Coverage
This market covers the revenues earned from selling finished table lamps and floor lamps that are used for task, ambient, or decorative lighting in residential and commercial spaces, across offline and online channels.
Scope exclusions: We exclude ceiling-mounted lighting, wall lights, and lighting control systems or smart home hubs when they are sold as standalone products.
Segments Covered in This Report
- By Product Type
- Table Lamps
- Floor Lamps
- Desk/Task Lamps
- Accent and Decorative Lamps
- Torchieres and Uplights
- Others
- By Material
- Metal
- Wood
- Glass
- Ceramic
- Plastic and Others
- By End-user
- Residential
- Commercial
- Hospitality
- Offices and Co-working Spaces
- Retail and Restaurants
- Healthcare Facilities
- Educational Institutions
- Others (Commercial)
- Institutional
- Industrial and Others
- By Distribution Channel
- Offline
- Specialty Lighting Stores
- Furniture and Home-center Chains
- Hypermarkets / Department Stores
- Online
- Brand-owned Webstores
- Marketplaces (Amazon, Wayfair, etc.)
- Offline
- By Geography
- North America
- Canada
- United States
- Mexico
- South America
- Brazil
- Peru
- Chile
- Argentina
- Rest of South America
- Asia-Pacific
- India
- China
- Japan
- Australia
- South Korea
- South East Asia (Singapore, Malaysia, Thailand, Indonesia, Vietnam, and Philippines)
- Rest of Asia Pacific
- Europe
- United Kingdom
- Germany
- France
- Spain
- Italy
- BENELUX (Belgium, Netherlands, and Luxembourg)
- NORDICS (Denmark, Finland, Iceland, Norway, and Sweden)
- Rest of Europe
- Middle East and Africa
- United Arab of Emirates
- Saudi Arabia
- South Africa
- Nigeria
- Rest of Middle East And Africa
- North America
Data Sources, Market Sizing, and Validation
Desk Research
Desk work started by mapping demand and supply signals that are publicly visible and easy to verify year over year. For trade direction, we used UN Comtrade and national customs portals, and we cross-referenced retail and household context using the US Census Bureau and Eurostat. To connect lighting to replacement cycles, we also reviewed International Energy Agency and US Energy Information Administration material on lighting and electricity efficiency trends.
To keep the model grounded, we reviewed company annual reports, investor presentations, and reputable press coverage to understand pricing moves, assortment shifts, and channel strategies. Where needed, we used paid subscriptions for company financials and news, shipment level import and export data, and a patent database to cross-check product activity and the timing of market changes. The sources listed above are illustrative, and many other public and paid references were also used for data collection and validation.
Primary Interviews and Surveys
Primary work was used to convert desk signals into practical market inputs, especially where product mix and pricing can change quickly with design trends. We spoke with a spread of manufacturers, brand owners, distributors, large retailers, and commercial buyers to confirm how table versus floor lamps are selling, how online share is moving, and what price bands are widening or narrowing across major regions.
Distribution of primary research fieldwork respondents
| Company type | Respondent position | Region |
|---|---|---|
| Top tier: 31% | CXOs: 14% | APAC: 51% |
| Mid tier: 47% | Functional/Unit leaders: 36% | EMEA: 30% |
| Smaller Players: 22% | Managers: 50% | Americas: 19% |
Market-Sizing & Forecasting
Sizing was built using a top-down approach. We reconstructed the addressable demand pool using household formation, home furnishing spend, and lighting replacement cycles, then split it into table and floor lamp portions using observed mix and channel patterns. To keep the totals realistic, we corroborated the top-down results with selective bottom-up checks, such as sampled average selling price ranges by material and end use, combined with unit movement checks from distributors and retailers.
A few inputs drove the model. We tracked the residential versus commercial buying split, the pace of online penetration for home decor, and average selling price shifts tied to materials like metal, wood, or glass. We also incorporated LED adoption effects on replacement timing. We considered seasonality around major retail events and housing turnover, since those factors can pull demand forward in specific quarters.
For forecasting, we used scenario analysis to reflect different paths for discretionary spending and housing activity, which affect demand for decorative lighting. When interview feedback showed gaps in unit visibility for smaller channels, we filled those portions using conservative penetration assumptions, then stress-tested them against trade flows and retail indicators.
Data Validation & Update Cycle
Outputs were checked against independent signals before finalization, including trade trends, category-level retail momentum, and the implied price per unit movement that the model produces. Any large variance by region or channel triggered a second review of assumptions, followed by re-contact with select interviewees when the gap could not be explained by a documented event.
A multi-step analyst review is followed so inputs, calculations, and narratives stay aligned, and unusual jumps are questioned before sign-off. Reports are refreshed annually, with interim updates when material events change demand, supply, or pricing, and a final pre-delivery sweep is completed so clients receive the latest updated view.
Mordor Intelligence's Table and Floor Lamps Market Size Compared With Other Published Estimates
Published market sizes for table and floor lamps often do not match because the boundary around what is counted can shift, even when the market name looks the same. Differences usually come from whether adjacent lighting categories are included, how online and offline pricing is treated, and how currency timing is handled in global totals.
By tracking channel mix and average selling price by material and end use, Mordor Intelligence keeps the total tied to finished table and floor lamp revenues and avoids folding in broader decorative lighting that inflates the number in some publications.
Benchmark comparison
| Source | Market Size | Gaps in Research Methodology |
|---|---|---|
| Mordor Intelligence | USD 26.41 B (2026) | |
| Global Consultancy A | USD 24.14 B (2024) | Uses an earlier base year and appears to lean more on broad retail lighting value, which can undercount specialty channels and miss recent ASP changes from material and freight normalization. |
| Trade Journal B | USD 25.86 B (2024) | Likely blends table and floor lamps with nearby portable lighting types and applies a simpler growth curve, which can shift totals when online penetration and product mix move at different speeds by region. |
The spread in the table is mainly explained by scope edges and timing, not by one single math step. When scope is kept strictly to finished table and floor lamps and the pricing logic is refreshed with channel level realities, the resulting market value becomes easier to reconcile and repeat year after year.
Key Questions Answered in the Report
What is the current size of the table and floor lamps market?
The table and floor lamps market size stands at USD 26.41 billion in 2026 and is projected to reach USD 33.08 billion by 2031.
Which product segment leads the market?
Desk/task lamps lead with 48.62% of revenue in 2025, reflecting widespread adoption in both home offices and corporate wellness programs.
How fast are floor lamps growing?
Floor lamps register the quickest expansion, forecast at a 14.02% CAGR through 2031 due to hospitality refurbishments and demand from short-term rental hosts.
Which region is expanding fastest?
Middle East & Africa shows the highest projected growth at 9.21% CAGR, propelled by large-scale urban developments and ambitious energy-efficiency mandates.
How is e-commerce affecting sales channels?
Online channels are forecast to grow at 13.68% CAGR, supported by augmented-reality visualization tools and direct-to-consumer brand strategies that enhance buyer confidence.