Home and Property Improvement
9th JuneA Leading Sanitaryware Company’s Journey in Saudi Arabia
4 Min Read
The Ceramic Tableware Market Report is Segmented by Product Type (Dinnerware, Drinkware, and More), by Material (Porcelain, Bone China, and More), by End User (Residential, and Commercial (HoReCa, and Institutional), by Distribution Channel (Supermarkets & Hypermarkets, Specialty Stores, and More) and by Geography (North America, South America, and More). The Market Forecasts are Provided in Terms of Value (USD).
Market Overview
| Study Period | 2019 - 2030 |
|---|---|
| Market Size (2025) | USD 18.82 Billion |
| Market Size (2030) | USD 26.13 Billion |
| Growth Rate (2025 - 2030) | 6.21 % CAGR |
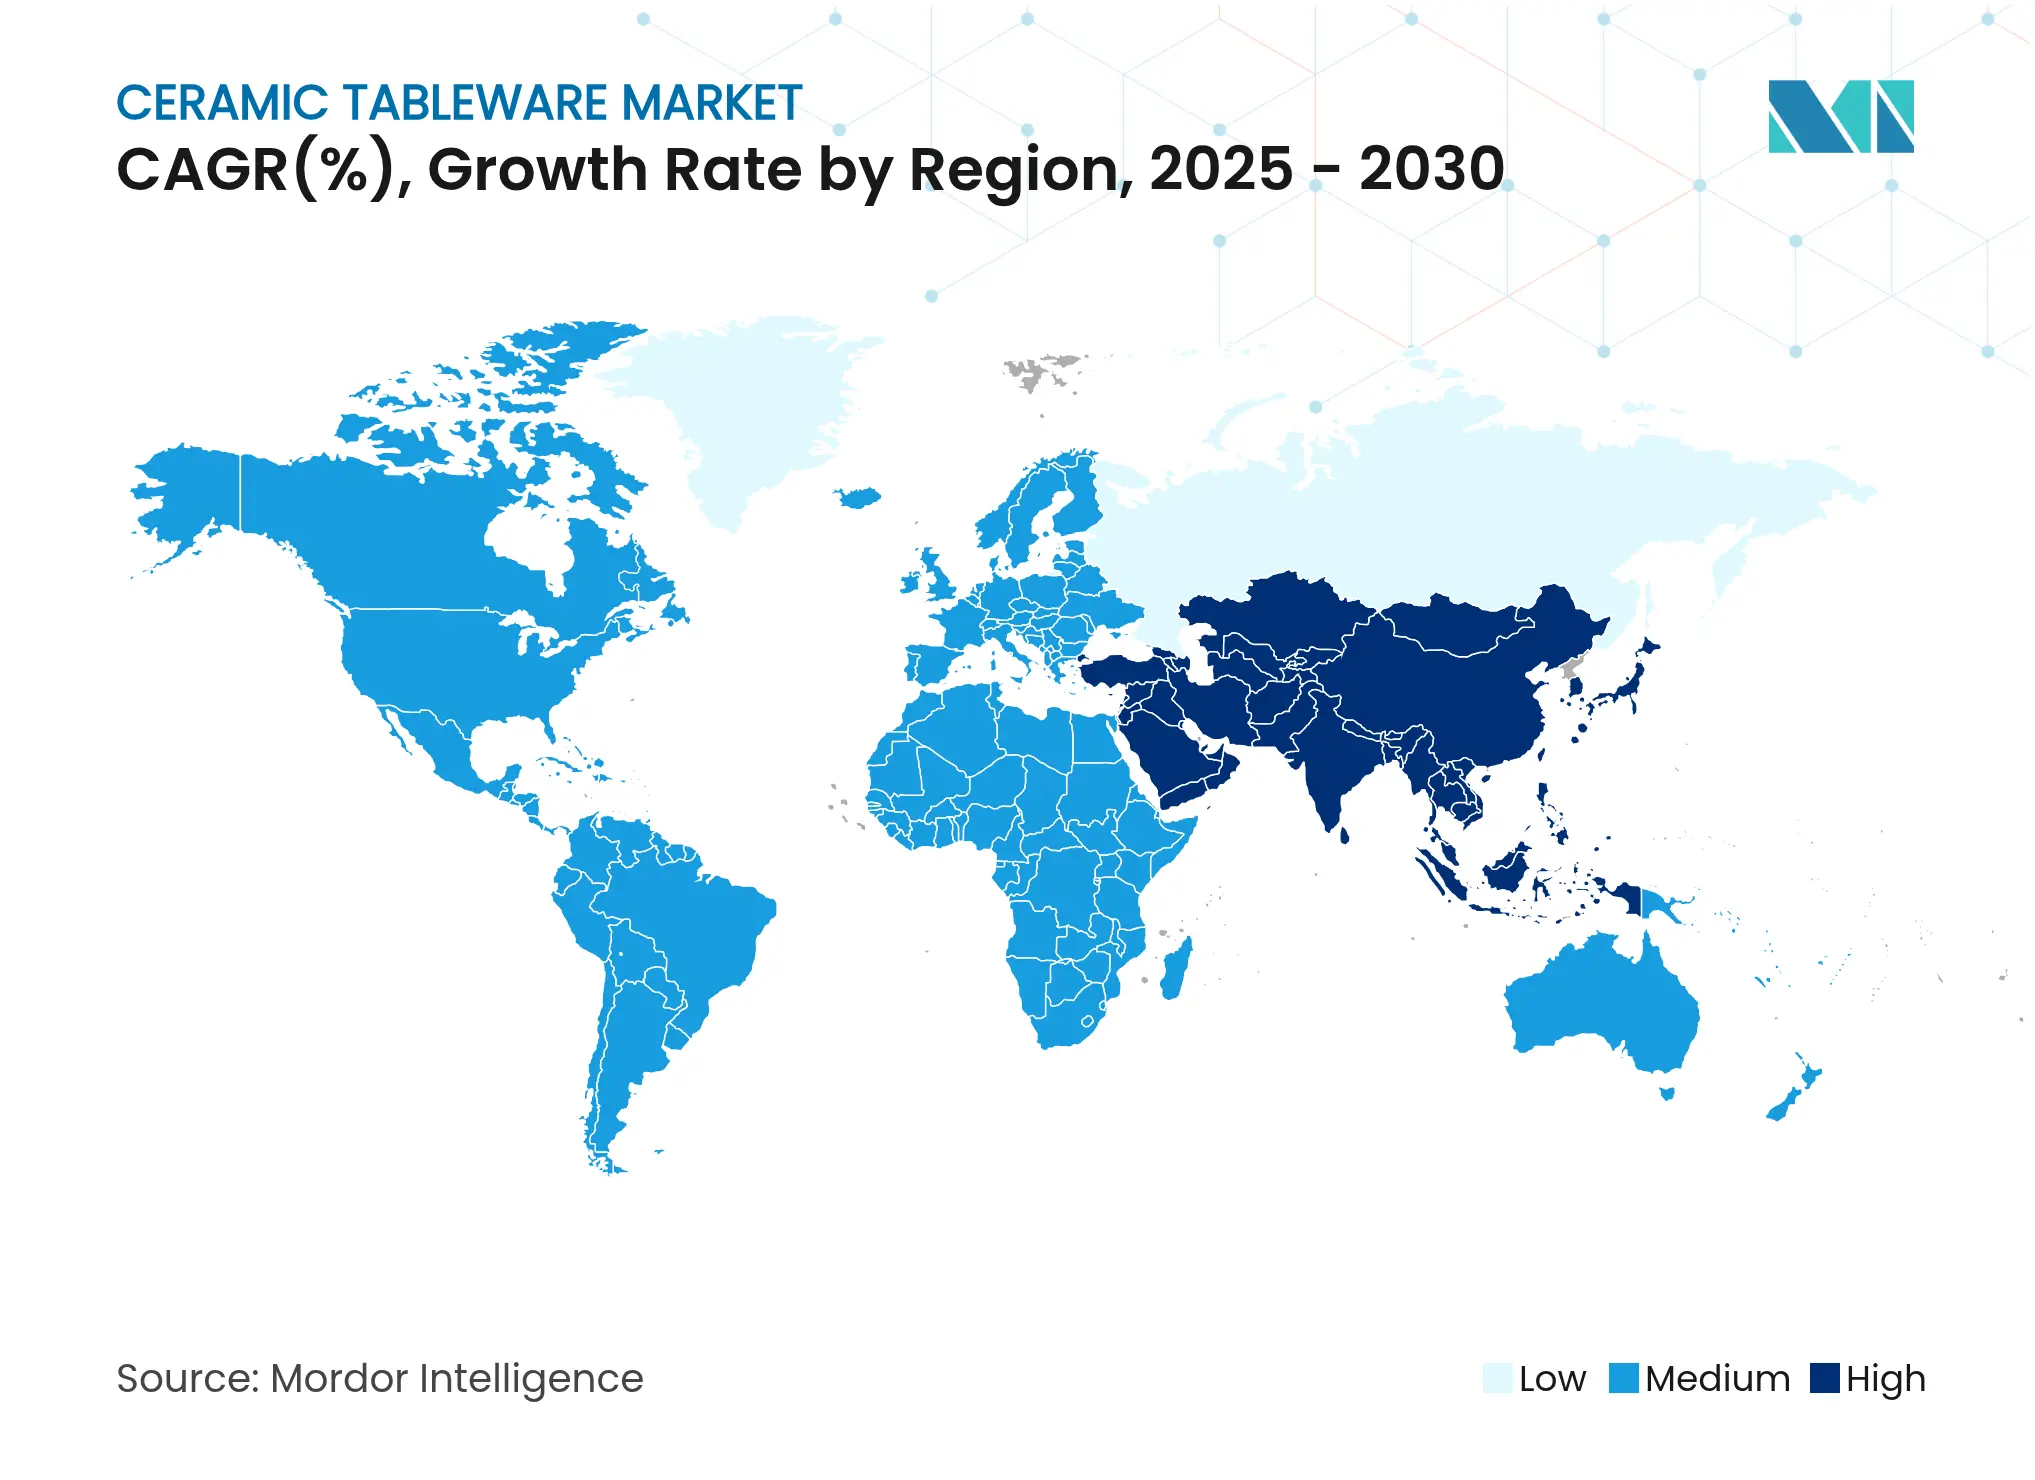
| Fastest Growing Market | Asia Pacific |
| Largest Market | Asia Pacific |
| Market Concentration | Low |
Major Players *Disclaimer: Major Players sorted in no particular order. Image © Mordor Intelligence. Reuse requires attribution under CC BY 4.0. |
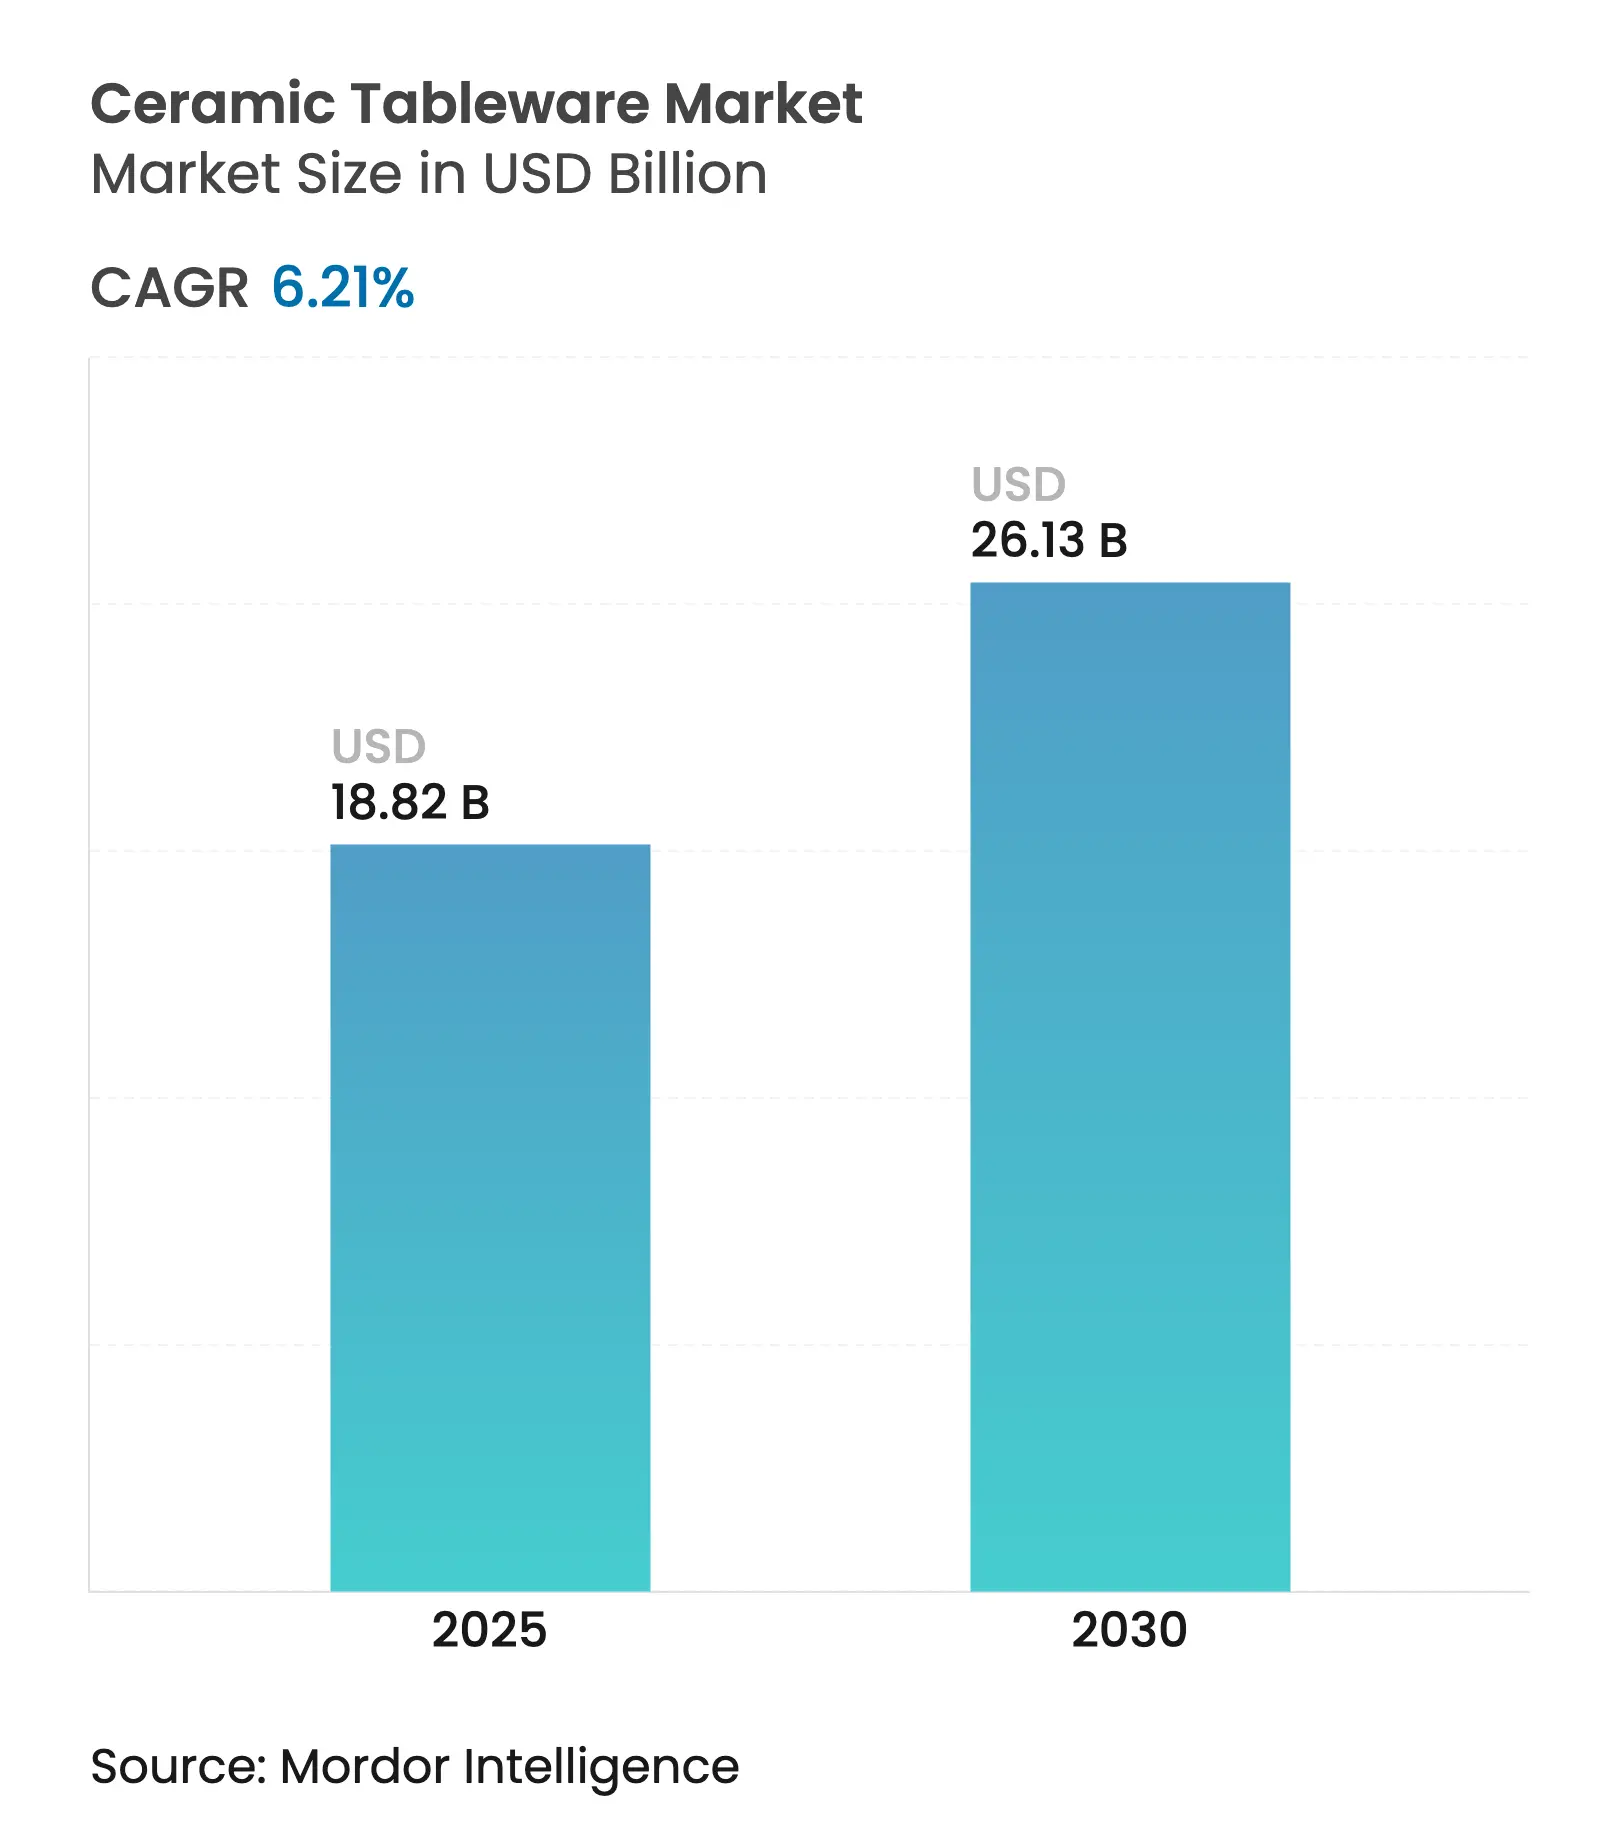
The ceramic tableware market size stands at USD 18.82 billion in 2025 and is projected to reach USD 26.13billion by 2030, advancing at a 6.21% CAGR. Expanding disposable incomes in emerging economies, sustained recovery across hotels and restaurants, and functional innovations such as induction-ready glazes keep demand resilient. The shift toward sustainable, lead-free products intensifies competitive differentiation, while e-commerce broadens access for both global brands and niche artisans. Industry players also benefit from tighter safety regulations that reward compliant, higher-value offerings and discourage low-grade imports.
Key Report Takeaways
Drivers Impact Analysis
| Driver | (~) % Impact on CAGR Forecast | Geographic Relevance | Impact Timeline | |||
|---|---|---|---|---|---|---|
Rising disposable incomes & home-décor
spending
Rising disposable incomes & home-décor
spending
| +1.2% | Global, strongest in Asia-Pacific and South America | Medium term (2-4 years) |
(~) % Impact on CAGR Forecast
:
+1.2%
|
Geographic Relevance
:
Global, strongest in Asia-Pacific
and South America
|
Impact Timeline
:
Medium term (2-4 years)
|
Growing hospitality &
food-service expansion
Growing hospitality &
food-service expansion
| +1.0% | Global, notably North America and Europe | Short term (≤ 2 years) | |||
Rapid growth of e-commerce home
& kitchen sales
Rapid growth of e-commerce home
& kitchen sales
| +1.5% | Global, led by North America and Asia-Pacific | Short term (≤ 2 years) | |||
Induction- & microwave-safe
ceramic innovations
Induction- & microwave-safe
ceramic innovations
| +0.8% | North America & EU, spill-over to Asia-Pacific | Medium term (2-4 years) | |||
On-demand 3-D printed bespoke
tableware uptake
On-demand 3-D printed bespoke
tableware uptake
| +0.3% | North America & EU premium segments | Long term (≥ 4 years) | |||
Stricter lead-/cadmium-free safety
regulations push
Stricter lead-/cadmium-free safety
regulations push
| +0.7% | Global, immediate in regulated markets | Short term (≤ 2 years) | |||
| Source: Mordor Intelligence | ||||||
Rising Disposable Incomes & Home-Décor Spending
Increasing middle-class incomes and the shift toward home-focused lifestyles are driving the demand for ceramic products as both functional and aesthetic household items. Consumers are reallocating discretionary spending, particularly from entertainment budgets, toward premium dinnerware that aligns with modern interior design trends. Urbanization across South and East Asia is expanding the customer base, compelling brands to introduce hybrid collections that integrate traditional craftsmanship with minimalist, contemporary designs. This trend is fostering a growing consumer inclination to invest in high-quality, premium-glazed ceramic products. Artisans are capitalizing on this demand by offering design-driven products that cater to evolving preferences while achieving higher profit margins. The ceramic tableware market is benefiting from the convergence of innovation, craftsmanship, and increasing consumer purchasing power.
Growing Hospitality & Food-Service Expansion
In 2024, China's food-service sector achieved over CNY 5 trillion in revenue, reflecting a 20.40% year-over-year growth and signaling robust demand for premium front-of-house solutions. The hospitality industry is leveraging ceramic presentations as a strategic tool for brand differentiation and enhanced customer engagement. Manufacturers are focusing on durable bone-China blends designed to meet the operational demands of commercial environments, ensuring product longevity and reliability. Companies like RAK Porcelain are investing in advanced kiln technologies to optimize production efficiency, increase throughput, and maintain consistent quality standards. Multi-year procurement contracts from hospitality buyers are providing manufacturers with predictable revenue streams, reducing market volatility. This financial stability is enabling greater investment in R&D, particularly in the development of chip-resistant glazes to align with evolving industry requirements.
Induction- & Microwave-Safe Ceramic Innovations
Innovative material formulations are transforming the cookware and tabletop market by integrating advanced functionality with visual appeal. Glazes engineered for electromagnetic compatibility facilitate seamless transitions from stovetop to table, enhancing operational efficiency. Microwave-safe materials, designed to resist thermal shock, further improve product reliability and versatility. SCHOTT’s CERAN Luminoir and Miradur surfaces highlight these advancements, offering exceptional durability and enhanced light transmission [1]SCHOTT AG, “CERAN Luminoir™ and Miradur® Fact Sheet,” schott.com. These attributes position the products as premium solutions, supporting higher price points. Furthermore, their superior performance expands their applicability across various consumer use cases.
Stricter Lead-/Cadmium-Free Safety Regulation Push
Regulatory authorities are increasingly tightening heavy-metal migration limits, transforming compliance into a critical strategic advantage for businesses. The European Union enforces rigorous thresholds under Directive 84/500/EEC, with consistent regulatory implementation driving the industry-wide transition toward safer colorants and more transparent, traceable supply chains. Companies that proactively allocate resources to develop robust testing protocols and source certified raw materials are better positioned to navigate regulatory landscapes efficiently. This approach not only facilitates smoother market entry but also strengthens brand reputation and fosters greater consumer trust, offering a competitive edge in a highly regulated market environment.
Restraints Impact Analysis
| Restraint | (~) % Impact on CAGR Forecast | Geographic Relevance | Impact Timeline | |||
|---|---|---|---|---|---|---|
Competition from plastic &
melamine alternatives
Competition from plastic &
melamine alternatives
| -0.9% | Global, price-sensitive segments | Short term (≤ 2 years) |
(~) % Impact on CAGR Forecast
:
-0.9%
|
Geographic Relevance
:
Global, price-sensitive segments
|
Impact Timeline
:
Short term (≤ 2 years)
|
Carbon-border tariffs on
energy-intensive ceramics
Carbon-border tariffs on
energy-intensive ceramics
| -0.6% | EU imports; knock-on global effects | Medium term (2-4 years) | |||
Artisan skills shortage for premium
hand-crafted lines
Artisan skills shortage for premium
hand-crafted lines
| -0.4% | Traditional manufacturing hubs | Long term (≥ 4 years) | |||
| Source: Mordor Intelligence | ||||||
Competition from Plastic & Melamine Alternatives
Consumers are evaluating the cost-benefit trade-off between the aesthetic appeal of ceramic dinnerware and the affordability and durability of synthetic alternatives. Budget-conscious businesses, such as family diners, are adopting plastic dinnerware to reduce operational costs. However, market analysis shows that households continue to invest in ceramic products due to their extended lifespan and perceived value. To remain competitive, brands need to emphasize the lifecycle advantages of ceramics in their marketing strategies. Promoting features like long-term warranties and enhanced durability can strengthen the product's value proposition. This approach can help brands align with evolving consumer demands and sustain market growth.
Artisan Skills Shortage for Premium Hand-Crafted Lines
Employment in Stoke-on-Trent’s potteries slid from 70,000 to 5,000 craftspeople, echoing declines in other heritage hubs [2]The Lead, “Stoke-on-Trent Potteries Face Skills Crunch,” the-lead.co.uk . With veteran sculptors retiring and no successors in sight, lead times are stretching, and output caps are tightening, putting a squeeze on high-end supply. In response, governments and industry bodies are introducing apprenticeship grants and creating digital archives to safeguard traditional techniques like throwing, glazing, and hand-painting. While automation takes over repetitive tasks, it allows artisans to focus on signature detailing, rather than replacing them entirely.
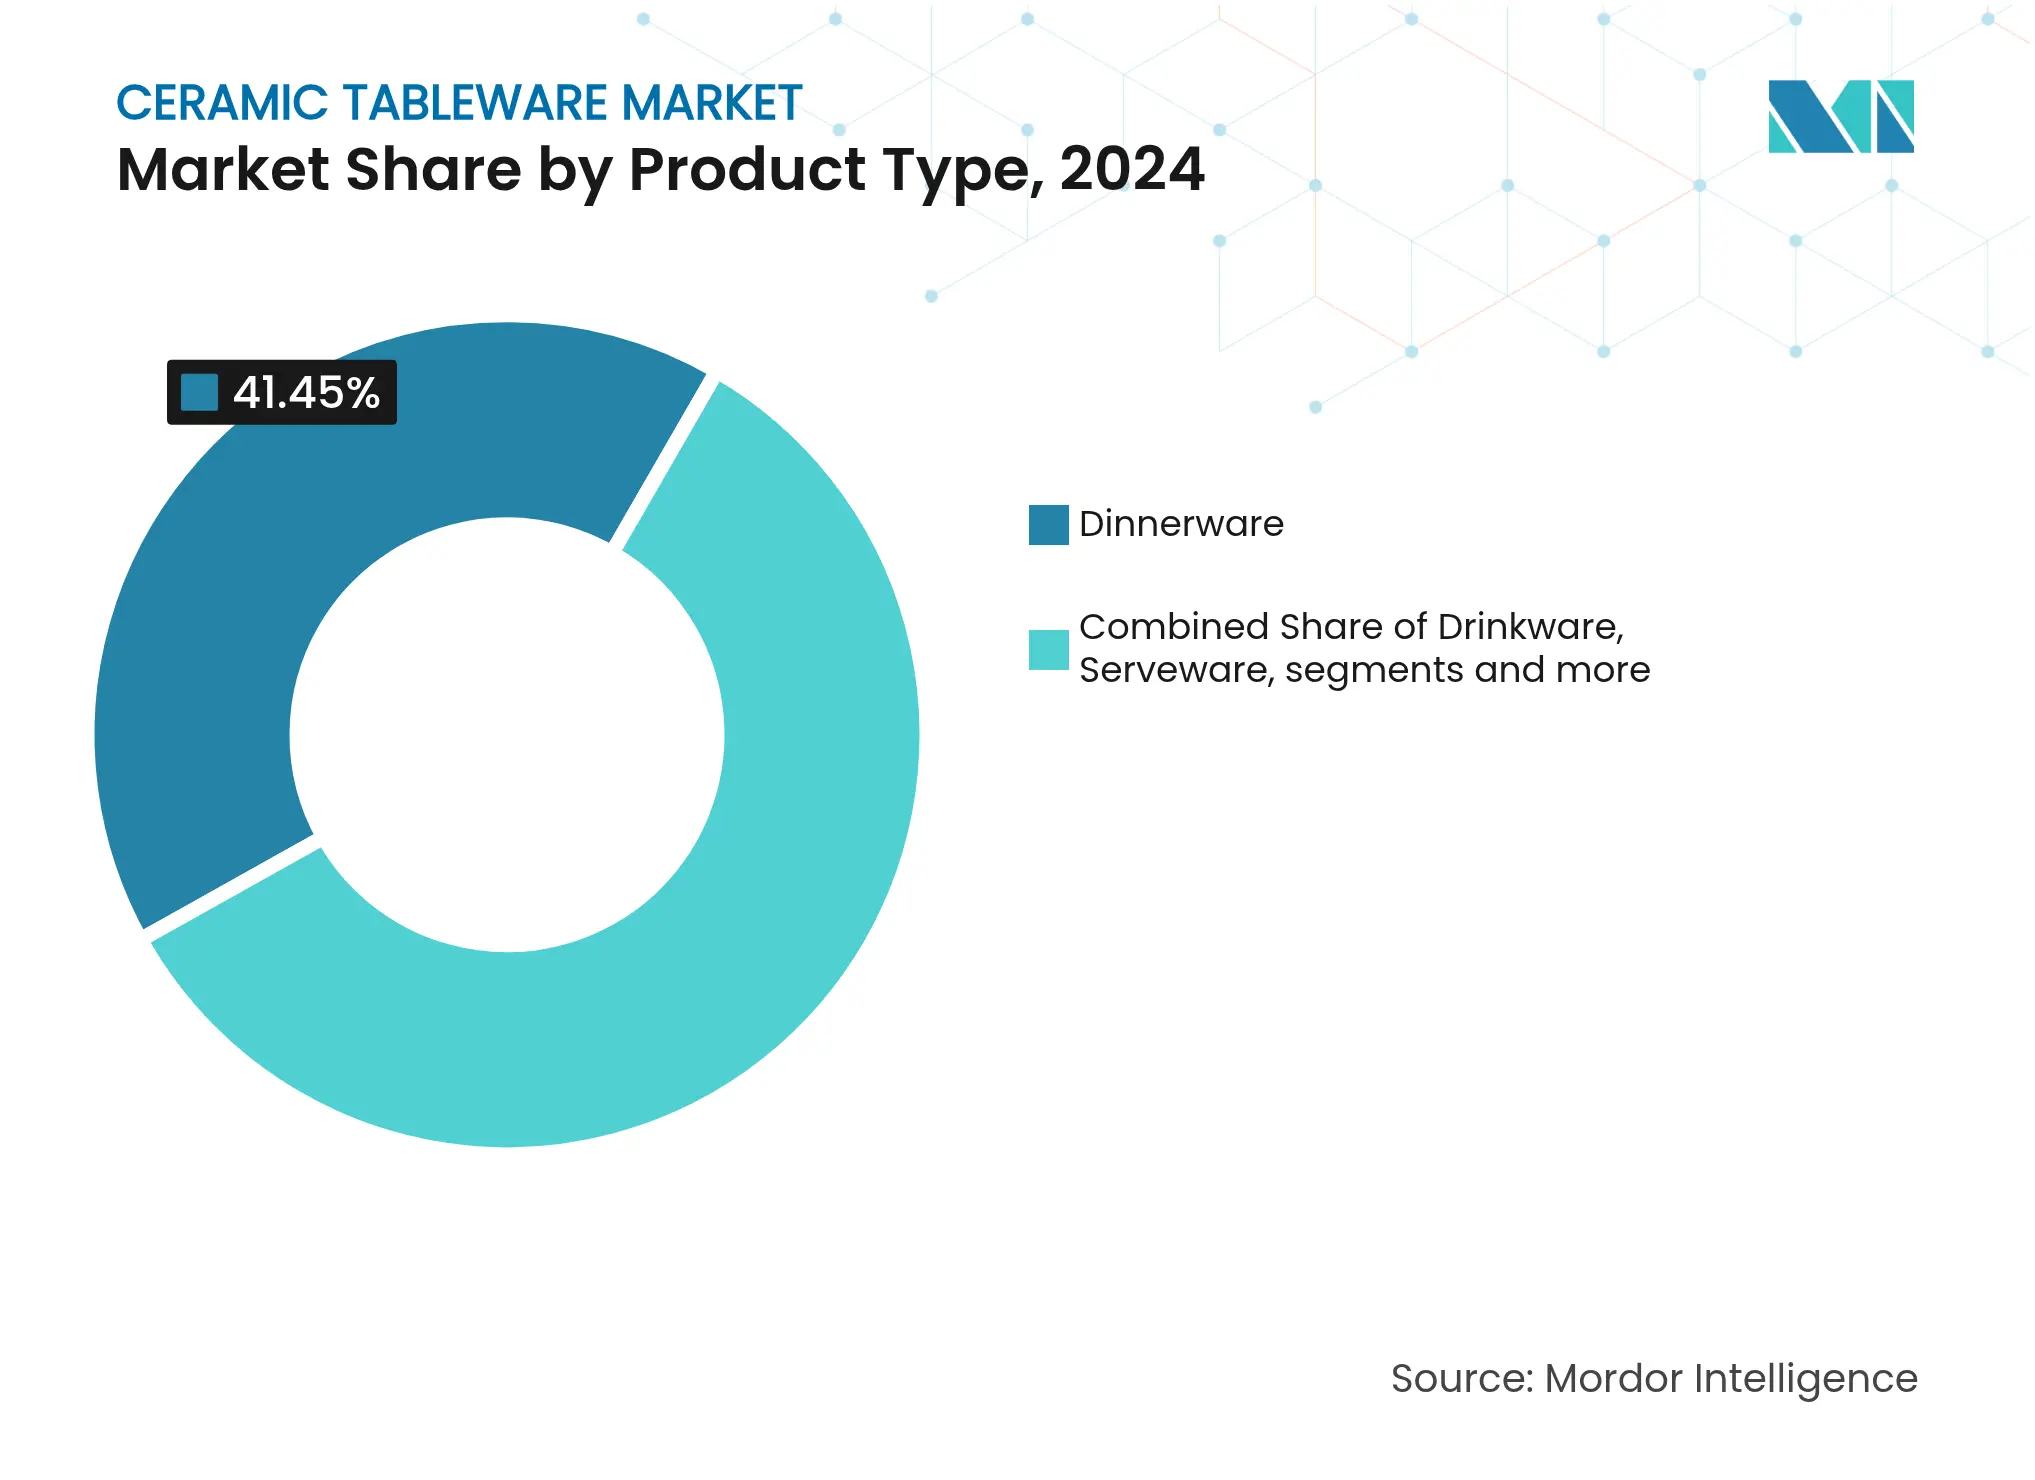
By Product Type: Dinnerware Dominance Drives Market Foundation
Dinnerware accounted for 41.50% revenue in 2024, cementing its role as the staple category that anchors production cycles and retail assortments. The ceramic tableware market benefits from predictable reorder volumes linked to household formation and hospitality refurbishment. Serveware’s 8.50% CAGR reflects social-media-fuelled styling that turns platters and bowls into visual centrepieces. Drinkware maintains tailwinds from café culture and craft beverages, while decorative pieces capture gifting spend during festivals and weddings. Matte glazes and organic silhouettes migrate from upscale restaurants to homes, propelling cross-segment experimentation.
Growing consumer interest in tablescaping is driving multi-piece product upselling, contributing to increased average order values. Retailers are strategically offering thematic bundles, including dinner plates, salad plates, and share platters, designed with cohesive color-blocked finishes to enhance purchase appeal. The ceramic tableware market for serveware is projected to witness significant growth, supported by the expanding premium casual dining and event catering segments. This growth is fostering stronger collaborations between chefs and manufacturers to align product designs with evolving consumer preferences. Retailers are leveraging these partnerships to introduce innovative and aesthetically appealing serveware collections. Consequently, the market is expected to benefit from the rising demand for curated and premium dining experiences.
By Material: Porcelain Leadership Faces Earthenware Innovation
Porcelain held a 58.50% share in 2024 owing to its blend of translucency, strength, and heritage associations. Continuous kiln improvements raise firing efficiency, allowing thin-walled shapes that reduce weight without sacrificing durability. Earthenware’s forecast 9.40% CAGR underscores a consumer leaning toward tactile, artisanal expressions and perceived environmental friendliness. Stoneware occupies a balanced position, targeting buyers who demand chip resistance at mid-market price points.
The earthenware segment of the ceramic tableware market is expected to grow as recycled clay slips and plant-based glazes gain certification, aligning with sustainability trends. Premium bone-china manufacturers are adopting advanced technologies, such as Computer-Controlled Roller Kilns and Ceramic Slip Rotary Moulding, to enhance production efficiency. These innovations streamline processes, reduce material wastage, and improve product quality. Additionally, they enable manufacturers to manage rising production costs, despite increasing energy tariffs driven by decarbonization policies. The integration of these technologies positions companies to remain competitive in a market influenced by sustainability and cost pressures.
By End User: Residential Strength Meets Commercial Acceleration
Residential buyers generated 64.60% of 2024 revenue, underpinned by cooking at home, gifting, and décor alignment with open-concept kitchens. Subscription-box models and limited seasonal palettes refresh demand beyond replacement cycles. Commercial channels, forecast at 7.10% CAGR, capitalize on the global travel rebound and hotel openings in Asia, the Middle East, and the Americas. Operators prioritize stackable, chip-resistant products that survive industrial dishwashers while preserving brand aesthetics.
Institutional segments, including airlines, cruise ships, and universities, are increasingly adopting lightweight vitrified tableware to enhance operational efficiency by reducing handling-related injuries and fuel costs. Bulk procurement agreements provide manufacturers with consistent production volumes, mitigating the impact of retail demand fluctuations. The ceramic tableware market is witnessing food-service distributors integrating value-added services, such as consulting on plate presentation and menu optimization, to strengthen client engagement. These strategic collaborations enable distributors to differentiate their offerings and build long-term partnerships. As a result, the industry is evolving to meet both functional and aesthetic demands of institutional clients.

Recognized by Experts. Trusted by Leaders.
A trusted intelligence partner to global decision-makers across 90+ countries.


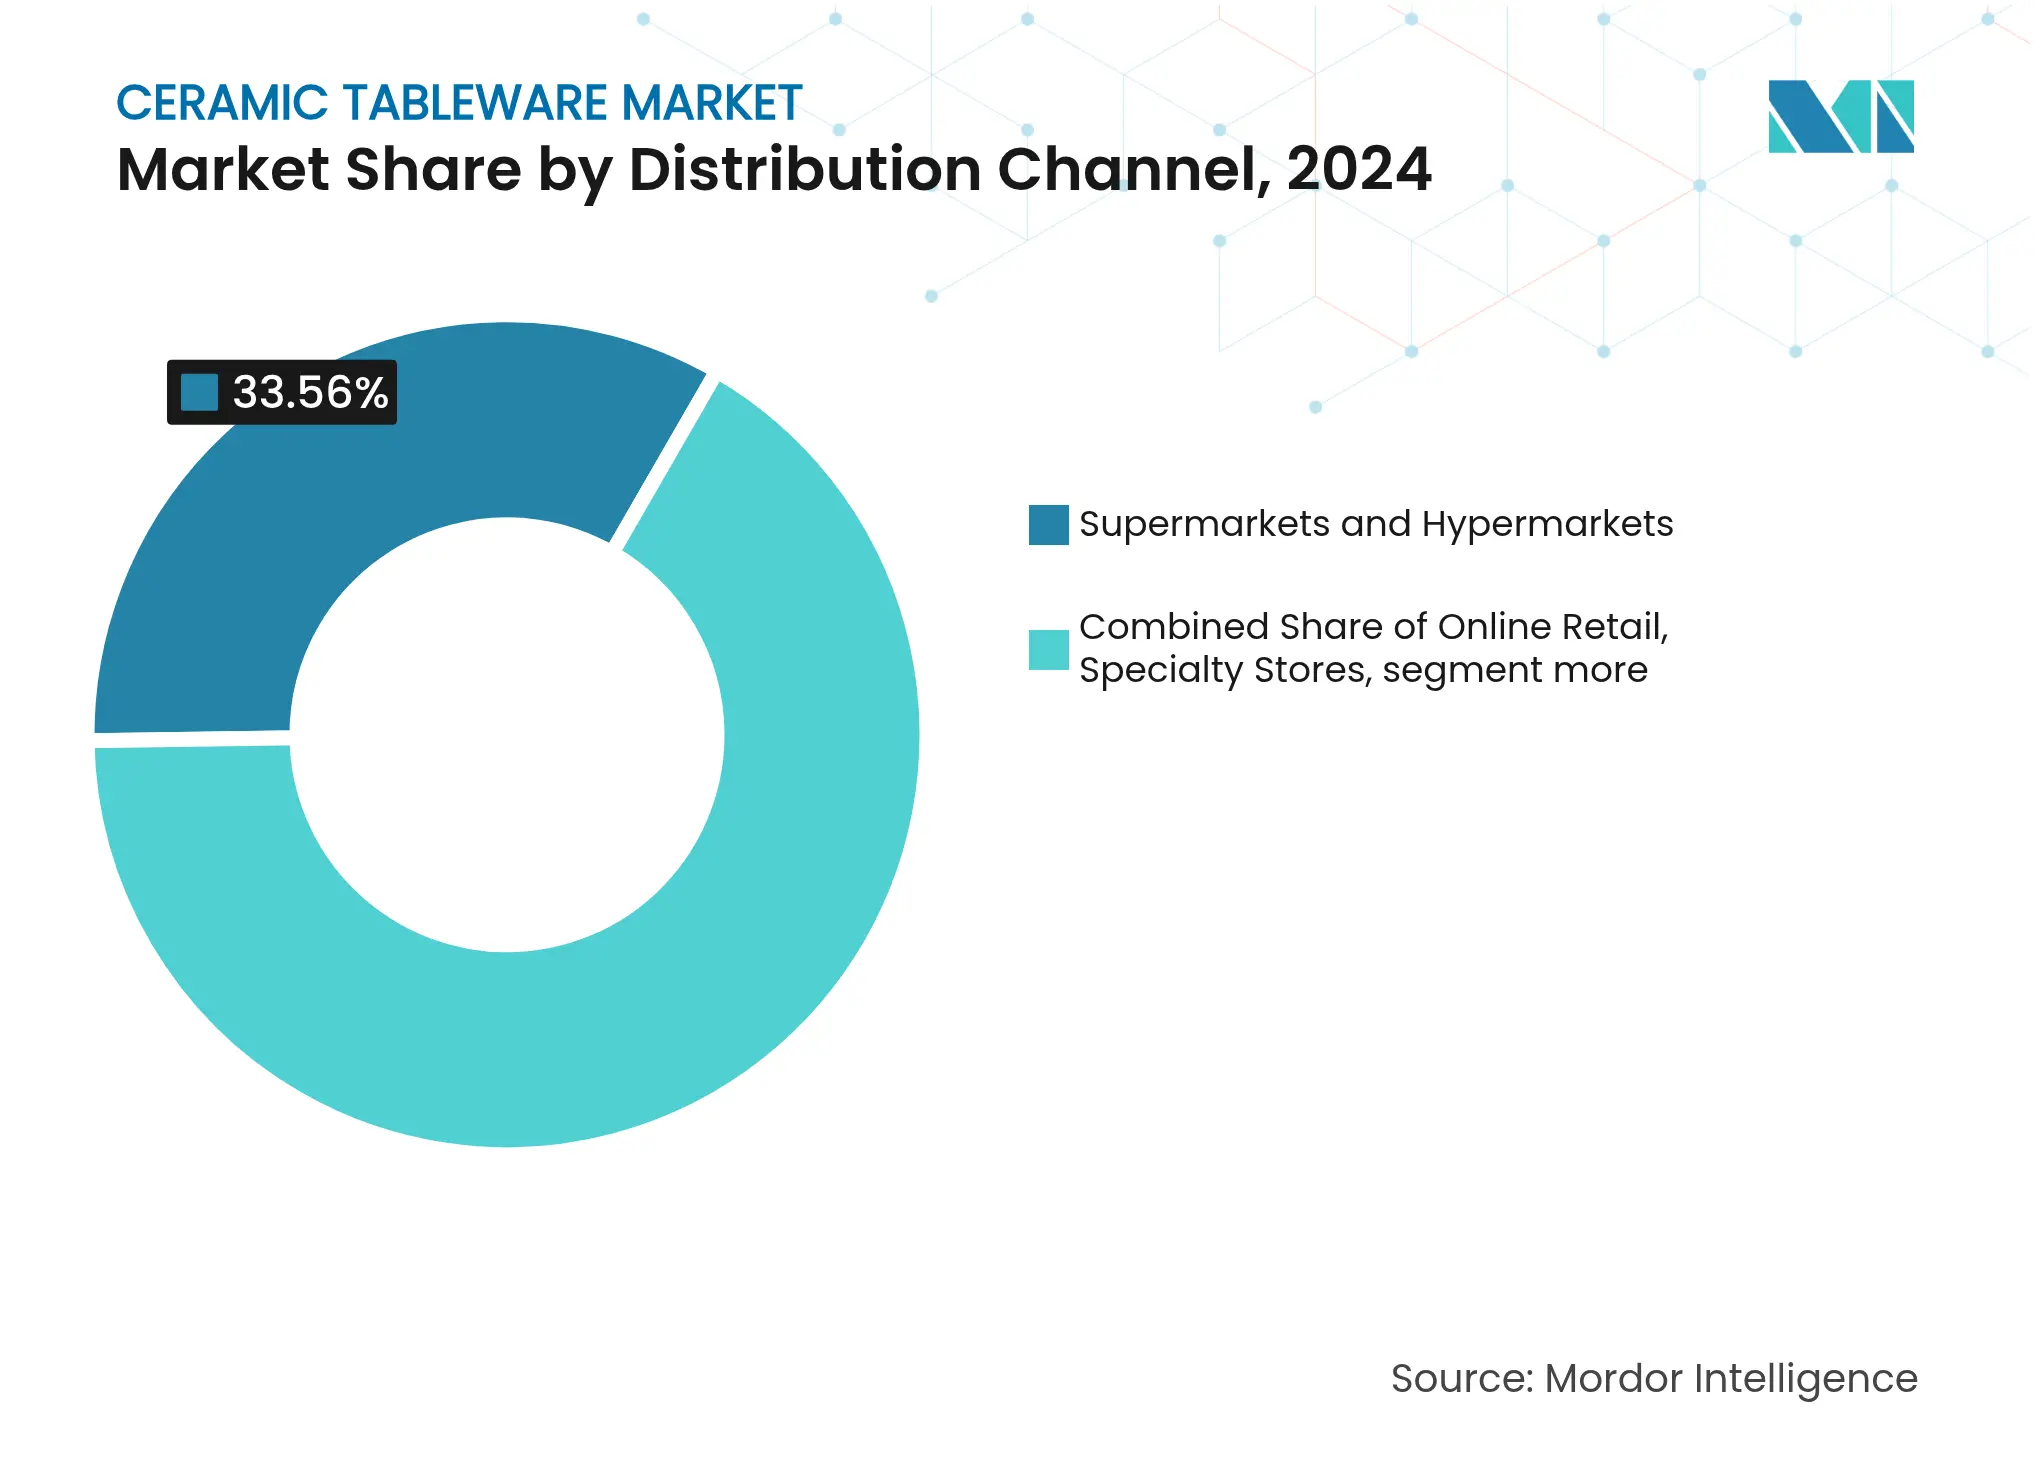
By Distribution Channel: Traditional Retail Resilience Meets Digital Acceleration
Supermarkets and hypermarkets held 33.6% of distribution in 2024, underscoring how ceramic tableware has become part of everyday grocery trips. These large stores keep their lead by offering mid-priced ranges that balance quality with affordability, letting shoppers compare sets side by side before heading to checkout. Wide aisles encourage impulse purchases, seasonal displays highlight coordinated collections, and long-standing shopper trust reinforces repeat visits. Scale and nationwide footprints further protect the format even as digital options grow.
Online retail is expanding the fastest, on track for a 10.1% CAGR through 2030. Rich product images, customer reviews, and tailored suggestions now compensate for the inability to touch the pieces. E-commerce also lets producers speak directly to buyers, sharing detailed care guides and styling tips that boost confidence. Specialty and department stores are responding with in-store demonstrations and curated assortments that justify premium prices. Meanwhile, small artisanal brands gain global reach without heavy investment, and established chains are blending physical showrooms with online ordering to match changing shopping habits.
Asia-Pacific generated 34.50% of 2024 revenue and is projected to grow at a 7.90% CAGR to 2030. Rising incomes in India, Vietnam, and Indonesia fuel domestic consumption, while governments invest in tourism infrastructure that boosts commercial demand. Japan and South Korea focus on design-led premium niches, blending traditional kilns with minimalist aesthetics.
North America is set to progress at a 4.50% CAGR. The United States annually imports ceramic tableware, with China serving as its primary supplier. Hospitality refurbishment cycles and e-commerce penetration underpin sales despite modest population growth. Canada and Mexico benefit from cross-border logistics and USMCA provisions, while Mexico emerges as a near-shoring alternative for US retailers seeking supply chain resilience.
Europe advances at a 3.50% CAGR amid market maturity and a premium-quality ethos. The EU’s CBAM will reshape sourcing decisions as carbon pricing narrows the landed-cost gap between local and Asian suppliers. Heritage clusters in Portugal and Italy leverage craftsmanship reputations, whereas UK producers lobby for energy subsidies to stay competitive. Eastern European facilities absorb scalable white-label contracts, taking advantage of lower labour costs within the single market.

Reports are available across multiple geographies.
Gain in-depth market insights across regions to support informed decisions.
Market Concentration
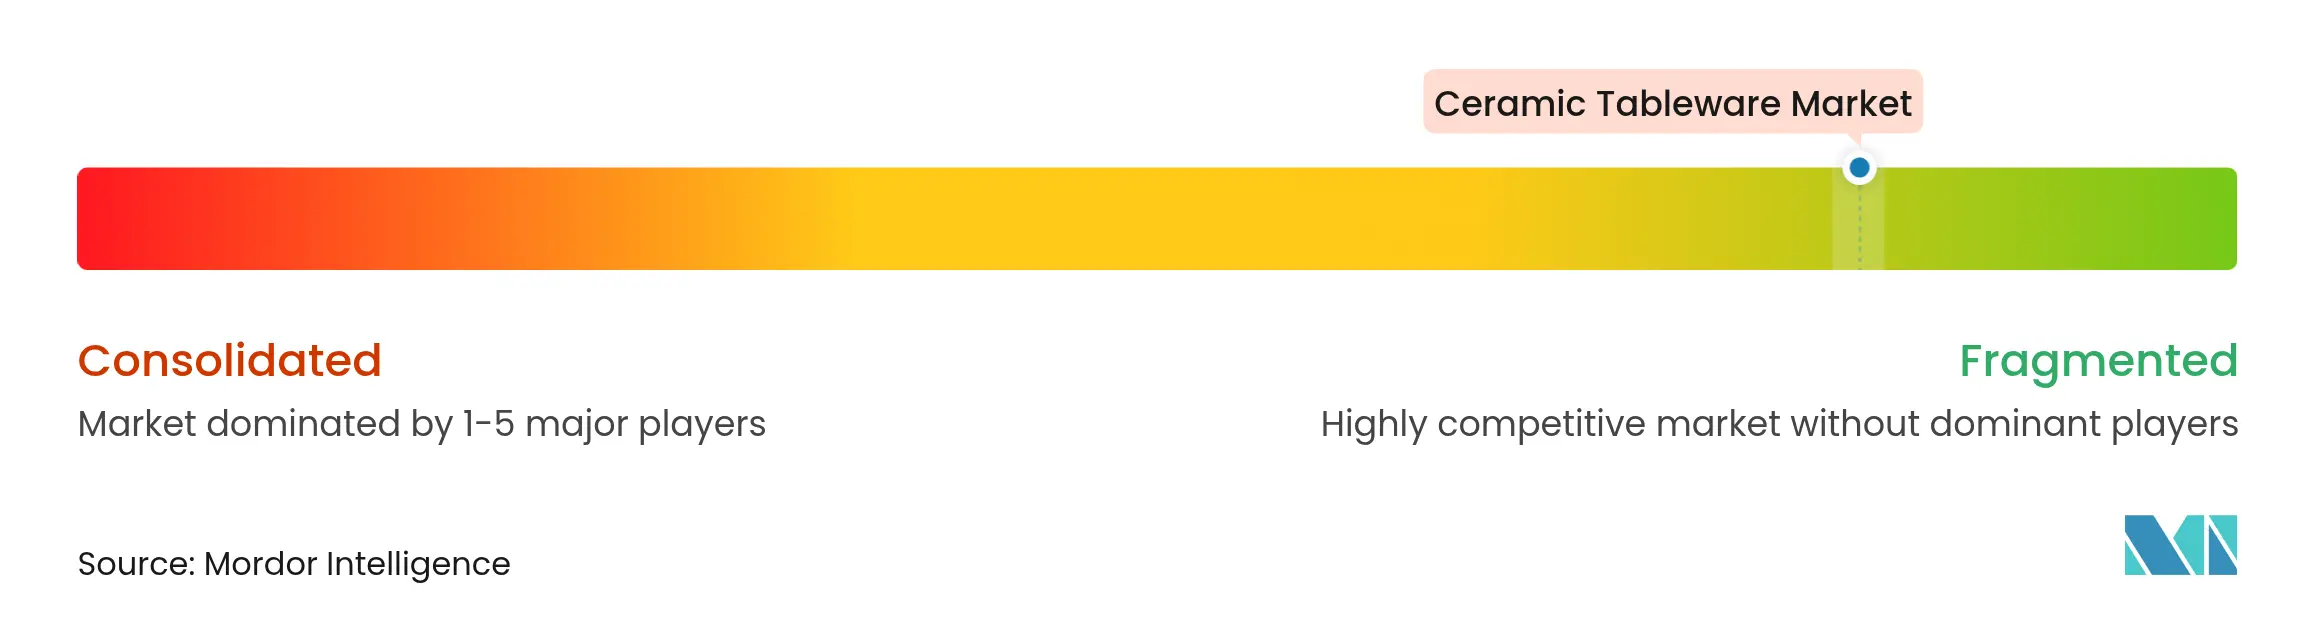
As of 2024, the ceramic tableware market remains highly fragmented, with the top five companies collectively accounting for a limited market share. Villeroy & Boch maintains its leadership position, capitalizing on over 200 years of established brand equity. Fiskars Group strengthens its market presence through its design-focused brands, including Wedgwood and Royal Doulton. Key strategic initiatives within the industry focus on optimizing product portfolios, advancing manufacturing technologies, and enhancing sustainability practices. Fiskars’ plan to spin off its Vita division by 2026 aims to sharpen category focus and unlock EUR 12 million in annual savings[3]Fiskars Corporation, “Strategic Separation of Vita Division,” fiskarsgroup.com .
Innovation themes include recycled-content bodies, water-based glazing, and digital firing control. Earth Tatva’s range, with 60.0% reclaimed waste clay, highlights circular opportunities. Established players integrate QR-coded authenticity tags that convey provenance and care instructions, strengthening direct consumer relationships. E-commerce newcomers exploit social media virality, but scaling challenges persist due to working-capital needs for stock and packaging. Partnerships with cloud-kitchen operators and designers extend brand visibility into new consumption occasions.
Private-label penetration intensifies as retailers use data analytics to identify style gaps and collaborate with OEMs in Thailand, Turkey, and Poland. Contract manufacturers invest in smart kilns that lower fuel cost per piece, allowing them to compete on both price and compliance. Intellectual-property disputes surface over pattern replication, prompting leading brands to diversify into textured solids and artisanal hand-painting that resist rapid copying.

*Disclaimer: Major Players sorted in no particular order
1. Introduction
2. Research Methodology
3. Executive Summary
4. Market Landscape
5. Market Size & Growth Forecasts (Value, USD Billion)
6. Competitive Landscape
7. Market Opportunities & Future Outlook
This report aims to provide a qualitative and quantitative assessment of the parent market. It focuses on the market dynamics, emerging trends in the segments and regional markets, and insights on various product and application types. Also, it analyzes the key players and the competitive landscape in the global ceramics tableware market.
A Leading Sanitaryware Company’s Journey in Saudi Arabia
4 Min Read
Strategic Expansion in the Russia Laundry Appliances Market
3 Min Read
US Market Entry for Taiwanese Machine Tool Manufacturers
5 Min Read
When decisions matter, industry leaders turn to our analysts. Let’s talk.