Home Decor Market Size and Share
Market Overview
| Study Period | 2020 - 2031 |
|---|---|
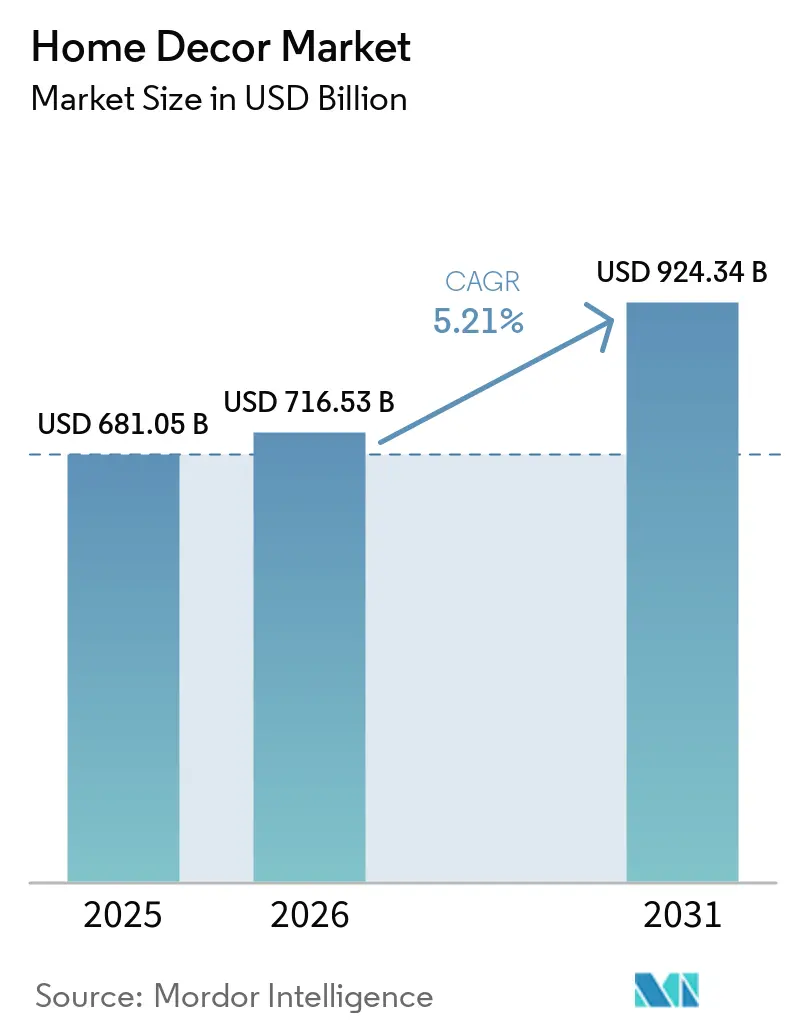
| Market Size (2026) | USD 716.53 Billion |
| Market Size (2031) | USD 924.34 Billion |
| Growth Rate (2026 - 2031) | 5.21% CAGR |
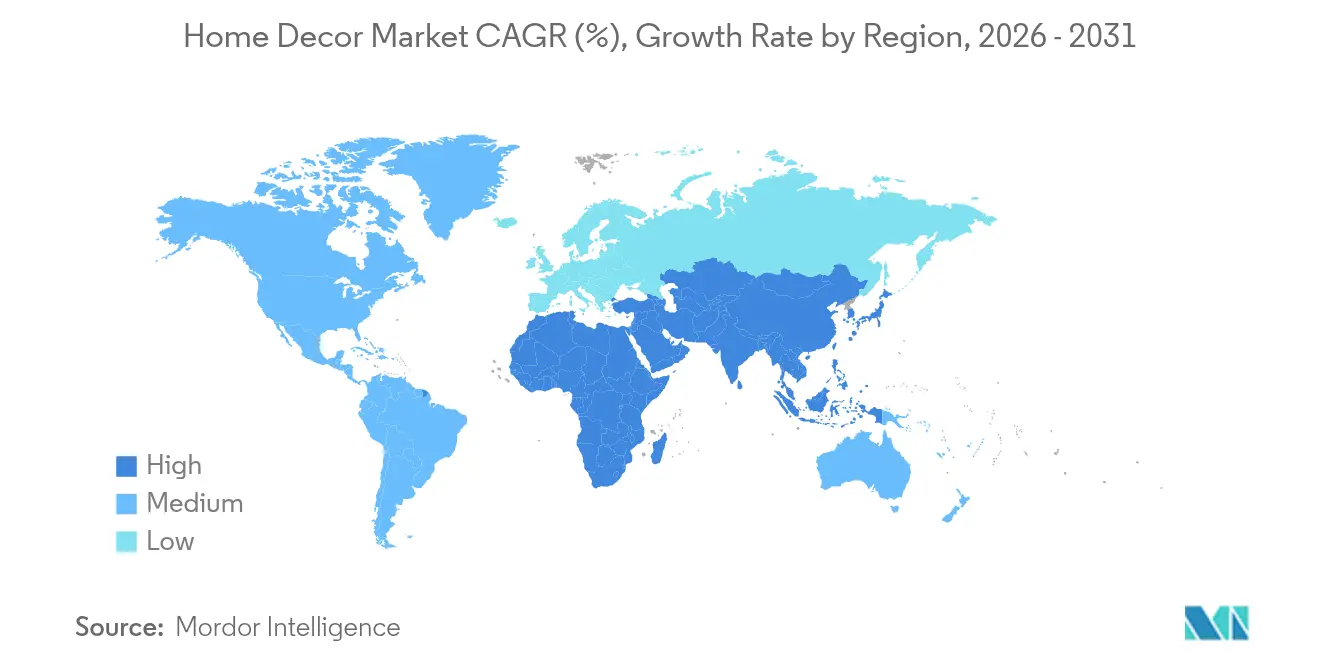
| Fastest Growing Market | Asia Pacific |
| Largest Market | North America |
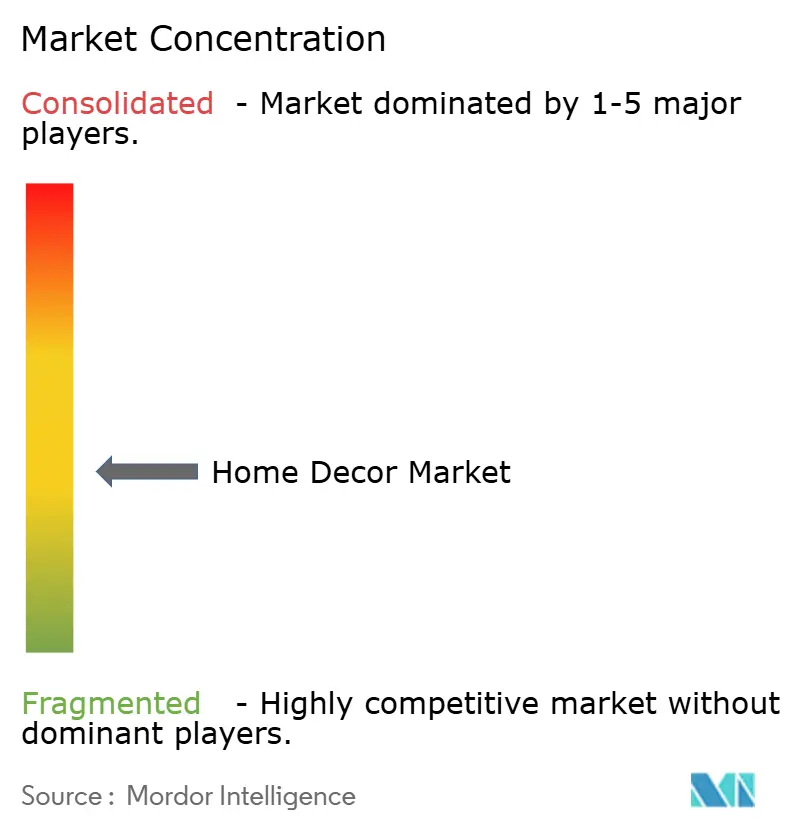
| Market Concentration | Medium |
Major Players *Disclaimer: Major Players sorted in no particular order Image © Mordor Intelligence. Reuse requires attribution under CC BY 4.0. | |
Home Decor Market Analysis by Mordor Intelligence
The Home Decor market size is expected to grow from USD 681.05 billion in 2025 to USD 716.53 billion in 2026 and is forecast to reach USD 924.34 billion by 2031 at 5.21% CAGR over 2026-2031.
A growing emphasis on sustainable materials, technology-enabled living spaces, and personalized aesthetics is reshaping demand patterns at scale. Price-led strategies underscore the mass segment’s appeal, yet premium brands continue to post strong margins, proving that aspirational design still commands a loyal audience despite inflationary pressure[1]Source: Inter IKEA Group, “IKEA Confirms Global Price Reductions,” inter.ikea.com. Retailers are also learning that socially responsible sourcing can coexist with cost competitiveness, encouraging wider adoption of circular design programs and take-back schemes. Meanwhile, high mobile penetration feeds a seamless discovery-to-purchase journey that boosts online conversion rates, accelerates trend cycles, and compresses product life spans. Vertical integration moves, such as Lowe’s acquisition of Artisan Design Group, signal a shift toward controlling more of the interior finishing value chain to stabilize margins against raw-material volatility.
Key Report Takeaways
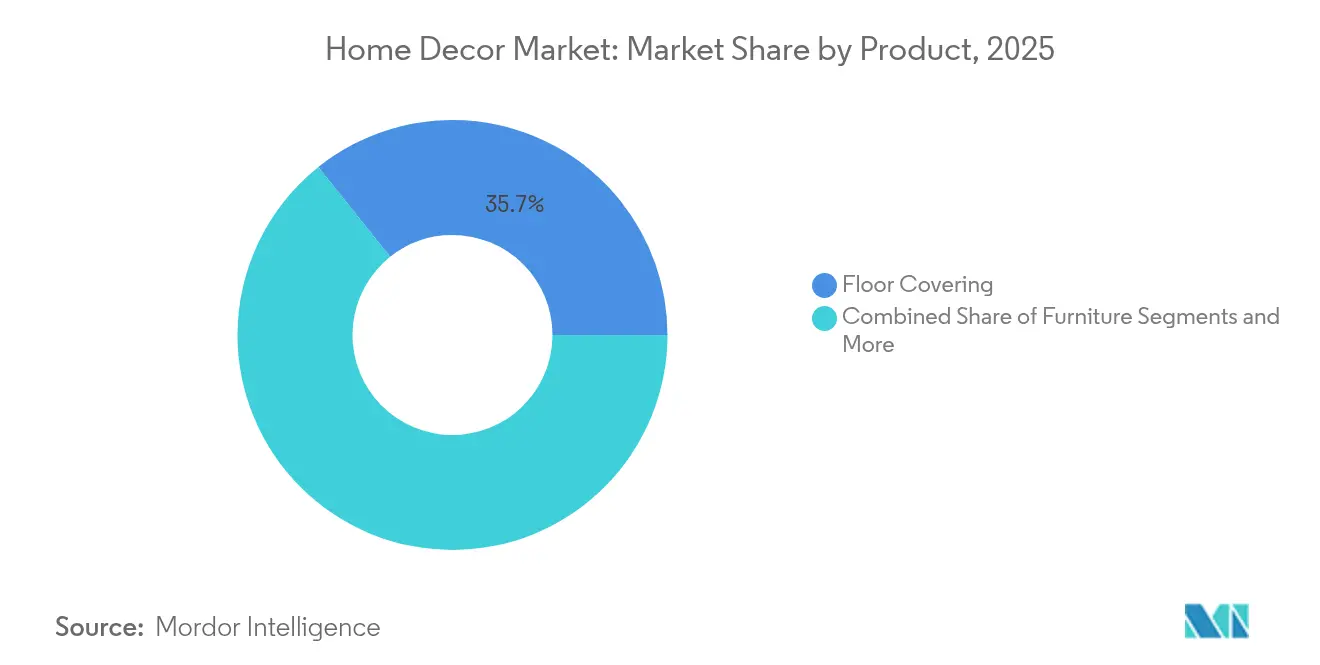
- By product category, floor coverings led with 35.72% of the home décor market share in 2025, while textiles are projected to expand at a 7.28% CAGR through 2031.
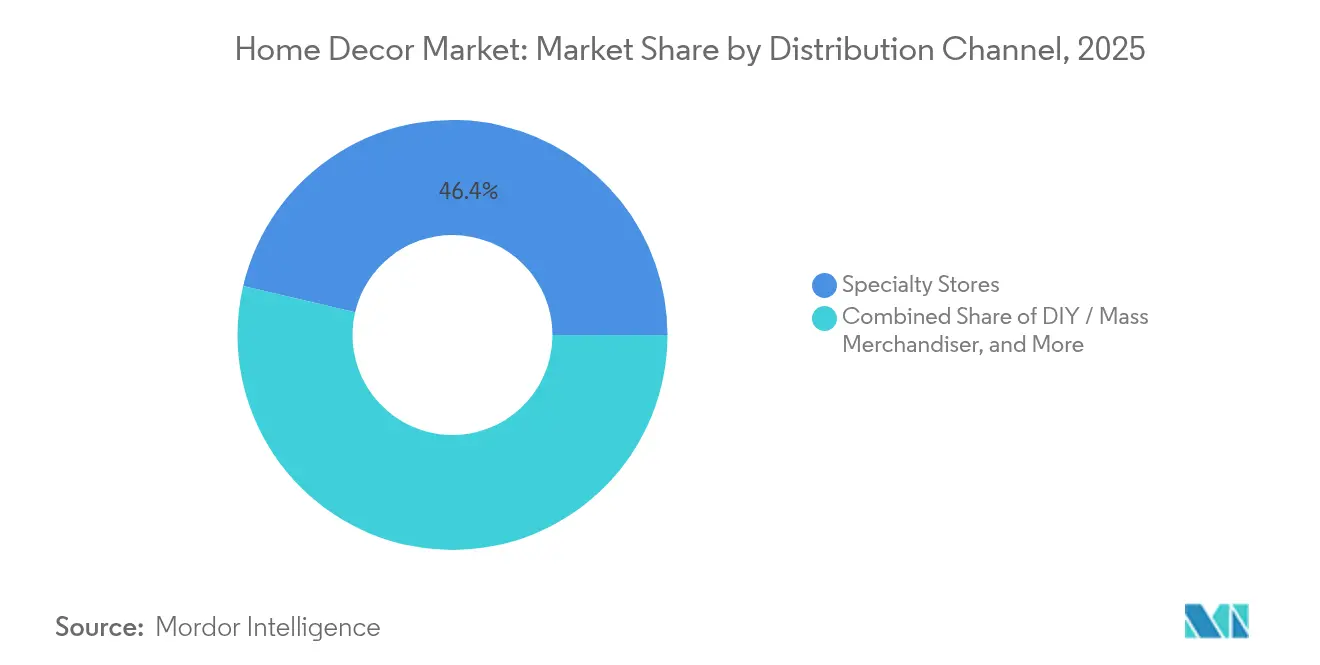
- By distribution channel, specialty stores held 46.35% share of the home décor market in 2025; DIY and mass merchandisers record the fastest projected CAGR at 7.91% through 2031.
- By price tier, the mass and value segment captured 60.58% share of the home décor market in 2025, whereas the premium tier is forecast to grow at 6.93% CAGR to 2031.
- By geography, North America retained 41.98% share of the home décor market in 2025, and Asia-Pacific is advancing at an 8.11% CAGR through 2031.
- Inter IKEA Systems B.V., Home Depot Product Authority LLC, Wayfair Inc., Ashley Global Retail LLC, and MillerKnoll Inc. leverage scale, logistics sophistication, and brand equity to remain top of mind with consumers, supporting significant market share in 2024.
Note: Market size and forecast figures in this report are generated using Mordor Intelligence’s proprietary estimation framework, updated with the latest available data and insights as of 2026.
Market Trends and Insights
Drivers Impact Analysis of Home Decor Market*
| Driver | (~) % Impact on CAGR Forecast | Geographic Relevance | Impact Timeline |
|---|---|---|---|
| Rising consumer interest in interior design and aesthetics | +0.8% | Global, with premium segments in North America & Europe | Medium term (2-4 years) |
| Growing influence of social media and digital platforms | +0.6% | Global, strongest in Asia-Pacific and North America | Short term (≤ 2 years) |
| Shift toward eco-friendly and sustainable materials | +0.7% | Europe & North America leading, expanding to Asia-Pacific | Long term (≥ 4 years) |
| Expansion of smart-home compatible décor | +0.5% | North America & Europe core, spill-over to Asia-Pacific | Medium term (2-4 years) |
| Urban micro-living spurring multifunctional furniture | +0.4% | Asia-Pacific urban centers, expanding globally | Medium term (2-4 years) |
| Emerging "phygital" AR/VR showroom adoption | +0.3% | North America & Europe early adopters | Long term (≥ 4 years) |
| Source: Mordor Intelligence | |||
Rising Consumer Interest in Interior Design and Aesthetics
Premiumization has moved from niche aspiration to mainstream expectation as households allocate larger portions of discretionary income to elevate interior spaces. Williams-Sonoma posted a Q4 2024 operating margin of 21.5% and a 3.1% comparable brand sales increase, confirming that design-centric positioning retains pricing power even in mixed macro conditions. Mass-oriented retailers, led by Home Depot, expanded their décor assortments to meet this design appetite, even though furnishings still account for only 4% of the chain’s USD 152 billion revenue base. Trade journals highlight 2025-2026 style themes that pair natural palettes with personalized accents, echoing consumer desire for meaningful products over legacy brand prestige. Gen Z singles out authenticity, sustainable origin, and multipurpose functionality, turning the home décor market into a canvas for self-expression that extends beyond traditional furniture purchases.
Growing Influence of Social Media and Digital Platforms
Visual-first channels compress the traditional discovery funnel: consumers spot a trend, validate it through peer content, and complete a purchase in minutes, often from a smartphone. Wayfair disclosed that 63% of its Q3 2024 orders arrived via mobile devices, and IKEA U.S. reported USD 1.9 billion in online revenue against USD 5.5 billion total sales, McKinsey found that more than half of consumers in Germany and the U.K. shop for home décor online, yet only one-fifth of SMEs sell through digital channels, leaving a sizable fulfillment gap that agile brands are beginning to fill. Fast-moving dynamics reward manufacturers capable of “drop” style launches that keep pace with social feeds, while extended development cycles risk shelving products that are no longer on trend.
Shift Toward Eco-Friendly and Sustainable Materials
Environmental commitment is quickly transforming from a brand differentiator into a market entry requirement. Eighty-six percent of European shoppers now consider sustainability pivotal to their home décor purchasing choices[2]Source: CBI, “European Market Potential for Home Decoration & Home Textiles,” cbi.eu. IKEA assessed 9,500 products for circularity and aims for 100% recycled polyester in textiles by 2030, while expanding Buy Back & Resell outlets across the United States. Second-hand furnishings already represent a USD 34 billion channel with a 7.7% growth outlook toward 2030, illustrating how circular models are becoming mainstream. Regulation accelerates the shift: forthcoming EU extended producer responsibility rules will require companies to manage end-of-life costs, pushing design teams to build for disassembly.
Expansion of Smart-Home Compatible Décor
Connected living is redefining what qualifies as furniture. North American households lead adoption with a 24.9% CAGR, integrating voice-activated lighting, hidden charging ports, and sensors that adjust ambiance to user preference. Furniture makers face a balancing act: embedding hardware and software without sacrificing the aesthetics that define the home décor market. Platform partnerships pose additional strategic questions. Proprietary ecosystems offer brand lock-in but limit interoperability; open standards broaden compatibility yet erode differentiation. Success now relies on blended teams of product designers and software engineers who can generate both unit sales and ongoing digital-service revenues.
Restraints Impact Analysis of Home Decor Market*
| Restraint | (~) % Impact on CAGR Forecast | Geographic Relevance | Impact Timeline |
|---|---|---|---|
| Raw-material price volatility | -1.2% | Global, acute in North America due to tariffs | Short term (≤ 2 years) |
| Skilled artisanal labor shortage | -0.8% | North America & Europe manufacturing regions | Medium term (2-4 years) |
| Costly cross-border e-commerce returns | -0.4% | Global e-commerce markets, highest in Europe & North America | Short term (≤ 2 years) |
| Stricter EPR / take-back mandates | -0.5% | Europe leading, expanding to North America & Asia-Pacific | Long term (≥ 4 years) |
| Source: Mordor Intelligence | |||
Raw-Material Price Volatility
Commodity swings create headline risk and margin erosion in the home décor market. Lumber prices climbed 16% year-over-year in May 2025 to USD 450 per thousand board feet. Tariffs amplify turbulence: Canadian softwood duties have lifted costs by up to 80%, while broader steel and aluminum tariffs added USD 2.5 billion in annual expenses across 463 construction inputs. Ocean freight spikes above USD 20,000 per container during supply chain crises have forced retailers to reassess sourcing footprints. Large players lock in long-term contracts or invest in upstream assets, whereas small and mid-size brands often absorb higher costs or risk lost shelf space if they attempt price increases. The situation pressures the sector to rethink material substitution, near-shoring, and collaborative procurement as viable hedging tactics.
Skilled Artisanal Labor Shortage
Production bottlenecks are no longer just about machinery; a shortage of trained craftspeople is slowing capacity in both basic and premium lines. Decades of offshoring hollowed out domestic skill bases in North America and parts of Europe, leaving an aging workforce with limited bench strength. Ashley Furniture’s USD 2 billion robotics program aims to automate repetitive manufacturing tasks, yet finishing, joinery, and bespoke upholstery still demand human judgment. Retraining pipelines require multi-year horizons, meaning labor availability will remain a medium-term drag on the home décor market until vocational initiatives scale.
*Our forecasts treat driver/restraint impacts as directional, not additive. The impact forecasts reflect baseline growth, mix effects, and variable interactions.
Home Decor Market Segment Analysis
By Product:
Floor Coverings Drive Volume, Textiles Capture GrowthFloor coverings held 35.72% of the home décor market share in 2025 on the back of renovation cycles, builder demand, and their relatively high ticket value. Textile items, meanwhile, are projected to expand the home décor market size for soft furnishings at a 7.28% CAGR through 2031, lifted by shorter replacement cycles and social-media-influenced styling. Consumers regard throw pillows, rugs, and curtains as low-risk tools for rapid room refreshment, which sustains frequent purchase intervals. By contrast, floor installations and upgrades often coincide with life events such as property acquisition or major remodels, ensuring large basket values but lower transaction velocity. Lowe’s USD 1.325 billion acquisition of Artisan Design Group highlights the strategic value of turnkey flooring solutions that bundle product, installation, and after-sales services.
A secondary product shift is unfolding in decorative accessories, wall art, and lighting. These smaller hardware items complement textiles to transform spaces without structural change. Manufacturers that unite a cohesive palette across categories improve cart conversions, as shoppers prefer streamlined color matches. Meanwhile, lighting upgrades intersect with smart-home adoption; voice-controlled bulbs and fixtures raise attachment rates for connected hubs. Floor covering vendors respond with under-floor heating compatibility, indicating a convergence of comfort, energy efficiency, and design. As category boundaries blur, retailers curate room-in-a-box bundles that simplify decision-making and raise the overall average order value across the home décor market.


By Distribution Channel:
Specialty Stores Hold Ground, DIY AcceleratesSpecialty retailers accounted for 46.35% of home décor market share in 2025, earning loyalty through expert guidance, curated assortments, and value-added services such as in-store design consultations. Their physical footprints encourage sensory evaluation of textures and finishes before purchase. However, DIY and mass merchandisers are expected to lead to the fastest 7.91% CAGR to 2031 by offering competitive prices, wide assortments, and immediate pickup or delivery. Home Depot’s growing décor aisles illustrate this pivot, even though the category still weighs lightly on its huge revenue base. Omnichannel players leverage “buy online, pick up in store” workflows to merge speed with tactile reassurance.
Pure-play e-commerce leaders like Wayfair enhance discovery with visualization tools that let consumers drag virtual couches into augmented-reality living rooms, reducing return rates and driving basket upsell. Smaller independents exploit social-commerce storefronts to run flash sales and micro-drops aligned with influencer campaigns. Contractors and interior designers form another specialized route-to-market; their share of the home décor market size for installation-heavy goods is projected to rise as households seek one-stop renovation services. Subscription décor boxes tap younger renters who crave frequent style rotations without long-term commitments, forging yet another micro-channel to capture discretionary spend.
By Price Tier:
Mass Market Dominates, Premium AcceleratesMass and value offerings commanded 60.58% of home décor market share in 2025 because scale efficiencies deliver reliable quality at wallet-friendly prices. IKEA’s decision to cut ticket averages by 10% worldwide while maintaining design integrity underscores how leaders can use logistics muscle to defend share. At the same time, the premium bracket is set to grow at a 6.93% CAGR, as post-pandemic consumers convert living spaces into wellness and productivity hubs. Williams-Sonoma’s margin outperformance confirms that many households will still pay a premium for artisanal craftsmanship and on-trend collaborations.
Polarization is squeezing the mid-tier, where brands neither match low-cost leaders on price nor premium peers on differentiation. Some mid-market players respond by launching diffusion labels or by elevating core ranges with limited-edition designer tie-ins. Others pursue private-label manufacturing for large chains to fill production lines while rebuilding consumer relevance. Retailers also experiment with rent-to-own and financing plans that make high-ticket couches attainable for younger buyers, blending volume economics with aspirational design cues.
Geography Analysis
North America Home Decor Market
North America’s 41.98% home décor market share in 2025 rests on mature housing stock, high household incomes, and a cultural affinity for DIY improvements. Builder confidence, while moderating, still supports annual single-family housing starts near 927,000 units despite recent declines. Tariff-driven material inflation challenges profitability, so retailers hedge by contracting local mills and extending private-label lines that carry higher margins. Technology uptake remains robust: AR visualization apps have become table stakes, and connected-home penetration fosters cross-selling of smart-compatible décor. Sustainability is also gaining ground as state regulations on recycling and energy efficiency converge with consumer values, nudging suppliers to certify lumber and upholster with recycled fibers.
APAC Home Decor Market
Asia-Pacific is the fastest riser, projected to deliver an 8.11% CAGR through 2031 and steadily close the gap with the current regional leader. India exemplifies demand momentum: its home and interior business climbed to USD 29.5 billion in 2023 and is expected to reach USD 48.1 billion by 2028 on an 11.4% furnishings CAGR. A young demographic profile, rapid urban growth, and widespread smartphone adoption create fertile ground for social-commerce-led discovery. Regional e-tailers such as HomeLane amplify growth by acquiring rivals like Design Café to scale design-to-installation offerings. China remains the dominant sourcing hub, but rising labor and compliance costs spur multinational brands to diversify toward Vietnam and Indonesia. Currency volatility, however, makes hedging strategies indispensable for maintaining stable landed costs.
EU Home Decor Market
Europe remains pivotal for sustainability leadership even as macro uncertainty tempers spending. The EU Green Deal’s forthcoming mandatory eco-design rules pressure firms to adopt circular strategies, from product passports to take-back logistics. Consumers increasingly favor brands that provide transparent carbon footprints, pushing marketing narratives to shift from style alone to style backed by science. Logistics-savvy players circumvent cross-border return costs by partnering with local refinishers who refurbish and resell returned items, cutting waste while improving margins.

Competitive Landscape
Competitive intensity in the home décor market remains high yet fragmented, with the top five companies influential but not dominant. Inter IKEA Systems B.V., Home Depot Product Authority LLC, Wayfair Inc., Ashley Global Retail LLC, and MillerKnoll Inc. leverage scale, logistics sophistication, and brand equity to stay top of mind among consumers. Still, regional specialists and digitally native brands find headroom in niches such as eco-luxury textiles and direct-to-consumer accent furniture. Lowe’s USD 1.325 billion acquisition of Artisan Design Group illustrates an ongoing tilt toward vertical integration that captures both product margin and installation revenue. Similar motives drove Consortium Brand Partners to purchase Jonathan Adler in December 2024, widening its lifestyle portfolio.
Technology now defines the competitive frontier. Ashley Furniture’s USD 2 billion automation program targets factory efficiency while freeing skilled artisans to concentrate on premium finishes. Wayfair invests in proprietary logistics and real-time inventory algorithms that reduce delivery times even for oversized SKUs, converting convenience into loyalty. Sustainability commitments also differentiate leaders: IKEA’s pledge to test all products for circularity and its buy-back kiosks lock in secondary market engagement. New entrants often position themselves as sustainable natives, touting closed-loop material flows and carbon-neutral shipping. However, scaling these promises proves expensive, nudging many start-ups toward strategic partnerships or acquisition.
Marketing tactics are evolving alongside technology. Cross-brand collaborations, exemplified by West Elm’s seasonal capsule with RHODE, refresh assortments rapidly and pull new audiences into store networks. Virtual showrooms, influencer-hosted live streams, and AR try-ons are replacing static catalogs, allowing firms to test demand with minimal inventory exposure. Loyalty ecosystems that reward sustainable behaviors—such as trading in old rugs for credits toward recycled options—build emotional resonance while recirculating product value. In such an environment, companies that blend design authority, supply-chain agility, and demonstrable environmental stewardship are best positioned to consolidate share within the evolving home décor market.
Home Decor Industry Leaders
Inter IKEA Systems B.V.
Home Depot Product Authority, LLC
Kimball International, Inc.
Ashley Global Retail, LLC
Wayfair Inc.
- *Disclaimer: Major Players sorted in no particular order
Home Decor Market Companies Covered in this Report
- Inter IKEA Systems B.V.
- Home Depot Product Authority LLC
- Wayfair Inc.
- Ashley Global Retail LLC
- MillerKnoll Inc.
- Williams-Sonoma Inc. (Pottery Barn, West Elm)
- Mohawk Industries Inc.
- Mannington Mills Inc.
- Shaw Industries Group Inc.
- La-Z-Boy Incorporated
- RH (Restoration Hardware)
- Ethan Allen Interiors Inc.
- Haverty Furniture Companies Inc.
- Crate & Barrel Holdings Inc.
- Lowe's Companies Inc.
- Walmart Inc. (Home & Living)
- Target Corporation (Threshold, Hearth & Hand)
- At Home Group Inc.
- Overstock.com Inc.*

Recent Industry Developments in Home Decor Market
- June 2025: Lowe’s Companies closed its USD 1.325 billion purchase of Artisan Design Group, adding 132 facilities and 3,200 installers to target a USD 50 billion interiors service pool.
- December 2024: Lowe’s Companies closed its USD 1.325 billion purchase of Artisan Design Group, adding 132 facilities and 3,200 installers to target a USD 50 billion interiors service pool.
- September 2024: HomeLane acquired Design Café via a share swap and raised INR 225 crore (USD 27 million) from Hero Enterprise and WestBridge Capital to deepen its reach into India’s tier-2 cities.
- June 2024: West Elm released a 120-piece summer collection co-created with lifestyle brand RHODE, continuing the partnership’s focus on vibrant textiles and playful accessories.


Home Decor Market Report Scope and Research Methodology
Market Definition and Coverage
According to Mordor Intelligence analysts, our study defines the global home decor market as the revenue generated by finished household items primarily intended to improve the look and basic usability of living, dining, bedroom, and outdoor spaces. It covers furniture, textiles, floor coverings, wall and table accents, decorative lighting, and plants sold through physical stores, e-commerce, and design professionals.
Scope Exclusions: We exclude construction materials, large appliances, interior design service fees, and disposable party supplies.
Segments Covered in This Report
- By Product
- Furniture
- Textiles (Curtains, Bedding, Cushions)
- Floor Coverings
- Wall Decor and Accessories
- Lighting
- By Distribution Channel
- Specialty Stores
- DIY / Mass Merchandiser
- Online / E-commerce
- Interior Designers and Contractors
- By Price Tier
- Mass / Value
- Premium
- Luxury / Designer
- By Geography (Value)
- North America
- Canada
- United States
- Mexico
- South America
- Brazil
- Peru
- Chile
- Argentina
- Rest of South America
- Europe
- United Kingdom
- Germany
- France
- Spain
- Italy
- BENELUX (Belgium, Netherlands, Luxembourg)
- NORDICS (Denmark, Finland, Iceland, Norway, Sweden)
- Rest of Europe
- Asia-Pacific
- India
- China
- Japan
- Australia
- South Korea
- South East Asia (Singapore, Malaysia, Thailand, Indonesia, Vietnam, and Philippines)
- Rest of Asia-Pacific
- Middle East & Africa
- United Arab Emirates
- Saudi Arabia
- South Africa
- Nigeria
- Rest of Middle East & Africa
- North America
Data Sources, Market Sizing, and Validation
Primary Research
Our analysts spoke with home fashion buyers, specialty-store merchandisers, marketplace managers, and textile mills across North America, Europe, and major Asian metros, refining average selling prices, channel markups, and style adoption that desk findings suggested.
Desk Research
We first mapped category revenues using UN Comtrade trade codes, the US Census furniture retail survey, Eurostat consumer-spend trackers, and OECD price files. Industry bodies such as the World Furniture Confederation and the European Carpet Association supplied shipment trends, while journals and patent digests highlighted eco materials and smart lighting developments.
Company 10-Ks, investor decks, and paid datasets, D&B Hoovers, Dow Jones Factiva, and Questel, plugged cost and margin gaps. The sources named are illustrative only; many additional open files supported cross checks and context building.
Market-Sizing & Forecasting
A top-down rebuild of household décor spend, split by product and channel, delivers the base year. We cross check it with bottom-up supplier roll ups where disclosure is strong to keep totals grounded. Drivers such as new dwelling completions, disposable personal income, e-commerce penetration, urbanization rate, and furniture price indices feed a multivariate regression that projects value to 2030. Then, scenario tweaks account for renovation cycles and price shifts while sampled margins patch occasional data gaps.
Data Validation & Update Cycle
Every output runs through variance filters, peer review, and a second analyst audit before release. Mordor refreshes estimates yearly and issues interim updates for material events, then rechecks all figures just prior to delivery so clients receive the latest view.
How Mordor Intelligence's Home Decor Market Size Compares to Other Published Estimates
Published estimates often differ because firms vary product baskets, currency dates, and update cadence. Mordor keeps to consumer retail scope and applies channel-level ASP × volume checks, whereas some publishers add commercial fit-outs or lean solely on price inflation.
Benchmark comparison
| Market Size | Anonymized source | Primary gap driver |
|---|---|---|
| USD 681.05 B | Mordor Intelligence | - |
| USD 1,037.14 B | Global Consultancy A | Includes repair and B2B fit-outs, limited channel granularity |
| USD 802.26 B | Industry Publisher B | Adds home improvement goods and applies flat price inflation |
| USD 654.84 B | Research House C | Omits decorative lighting, uses mid-2024 exchange rates |
These contrasts show that Mordor's balanced scope, channel checks, and disciplined refresh give decision makers a dependable baseline.


Key Questions Answered in the Report
What is the current value of the home décor market?
The home décor market is worth USD 716.53 billion in 2026 and is expected to reach USD 924.34 billion by 2031.
Which product category leads the home décor market?
Floor coverings hold the largest share at 35.72% of 2025 revenue, driven by renovations and new construction.
Who are the key players in Home Decor Market?
Inter IKEA Systems B.V., Home Depot Product Authority, LLC, Kimball International, Inc., Ashley Global Retail, LLC and Bed Bath & Beyond Inc. are the major companies operating in the Home Decor Market.
Which sales channel is growing the fastest?
DIY and mass merchandiser outlets are forecast to expand at an 7.91% CAGR through 2031 as value-seeking consumers favor one-stop formats.
Why is Asia-Pacific the fastest-growing region?
Rapid urbanization, rising disposable incomes, and expanding e-commerce infrastructure push Asia-Pacific toward an 8.11% CAGR to 2031.
How important is sustainability for home décor consumers?
In Europe, 86% of shoppers consider environmental impact essential, prompting brands to adopt recycled materials and circular design programs.
What role does technology play in future growth?
Smart-home compatibility and AR-enabled shopping experiences are merging décor with digital services, creating new revenue streams and differentiation paths in the home décor market.
Page last updated on:


