Market Overview
| Study Period | 2020 - 2031 |
|---|---|
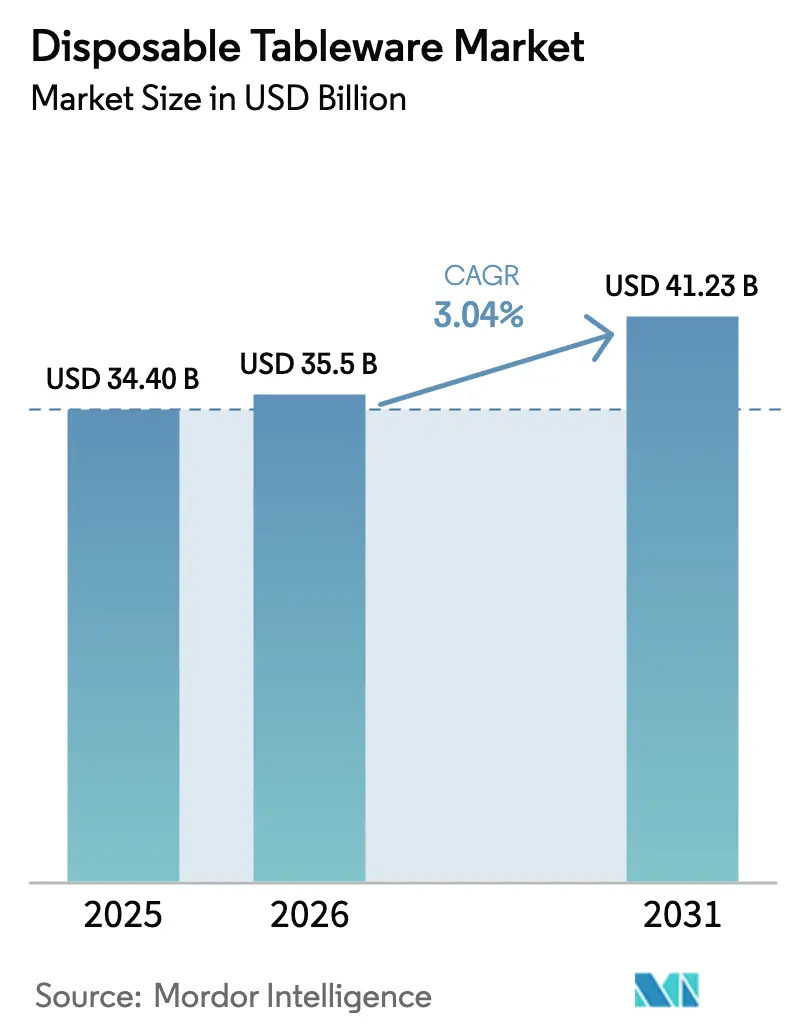
| Market Size (2026) | USD 35.5 Billion |
| Market Size (2031) | USD 41.23 Billion |
| Growth Rate (2026 - 2031) | 3.04% CAGR |
| Fastest Growing Market | Asia-Pacific |
| Largest Market | Asia Pacific |
| Market Concentration | Low |
Major Players *Disclaimer: Major Players sorted in no particular order Image © Mordor Intelligence. Reuse requires attribution under CC BY 4.0. | |
Disposable Tableware Market Analysis by Mordor Intelligence
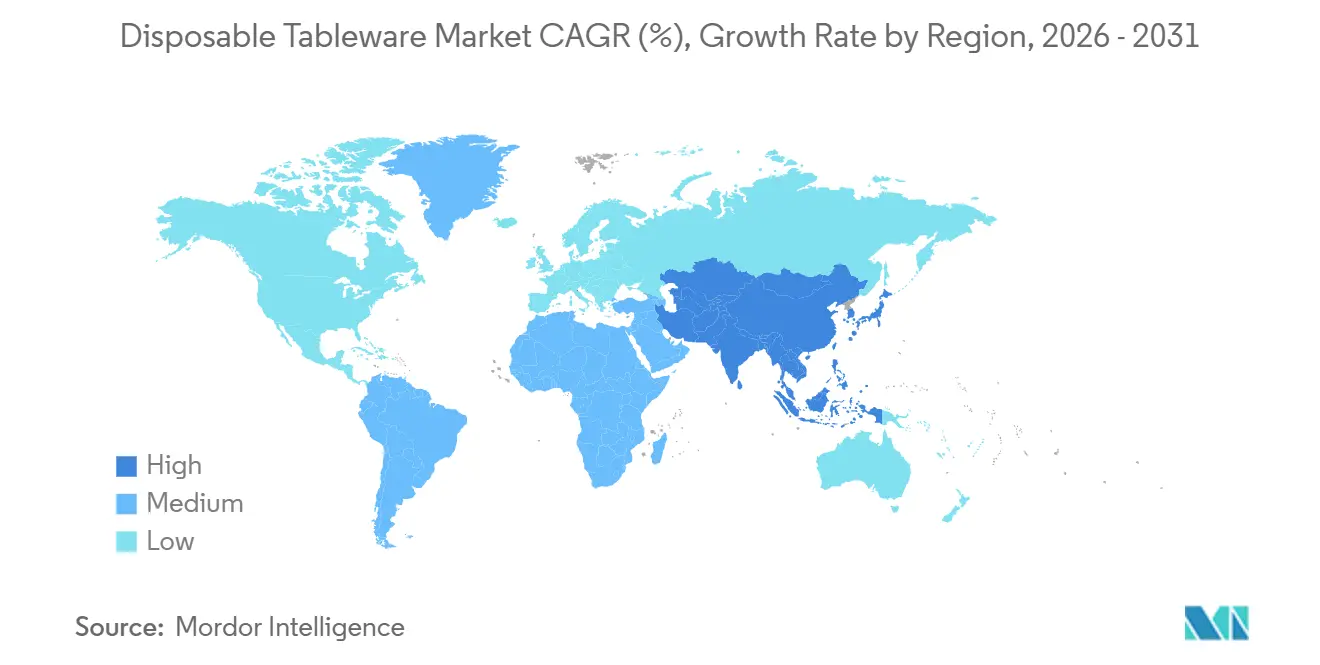
The global disposable tableware market size was USD 34.40 billion in 2025, is set to reach USD 35.5 billion in 2026, and is forecast to rise to USD 41.23 billion by 2031, reflecting a 3.04% CAGR during 2026-2031. A structural pivot is underway as regulatory pressure on expanded polystyrene and conventional plastics channels investment into molded-fiber formats and PFAS-free barrier systems, which is reshaping product development and supplier economics across the disposable tableware market. Asia-Pacific sustains leadership with revenue share and the fastest regional climb annually to 2031, supported by urbanization, delivery app usage in tier-2 cities, and quick-service-restaurant network expansion that boosts cups and bowls in the disposable tableware market.
Key Report Takeaways
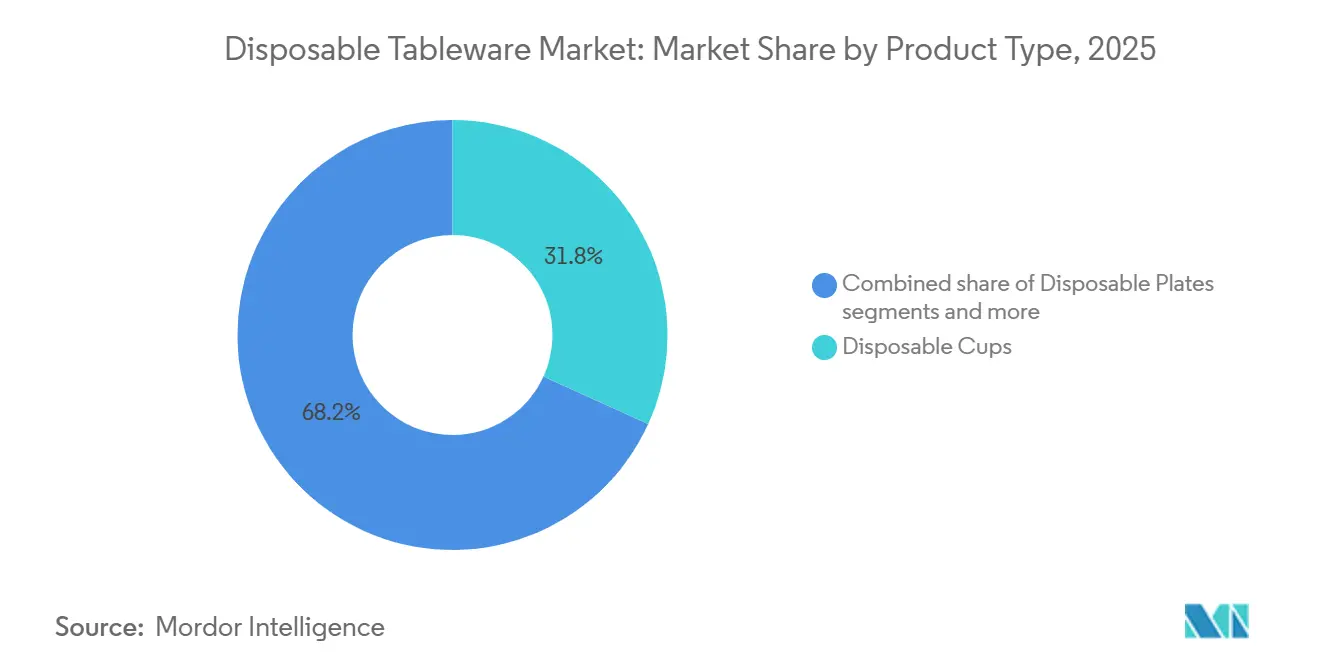
- By product type, disposable cups led with 31.80% of the global disposable tableware market share in 2025, while bowls are projected to expand at a 6.85% CAGR through 2031.
- By application, commercial end-users accounted for 68.25% of the global disposable tableware market share in 2025 and are forecast to grow at a 5.72% CAGR to 2031.
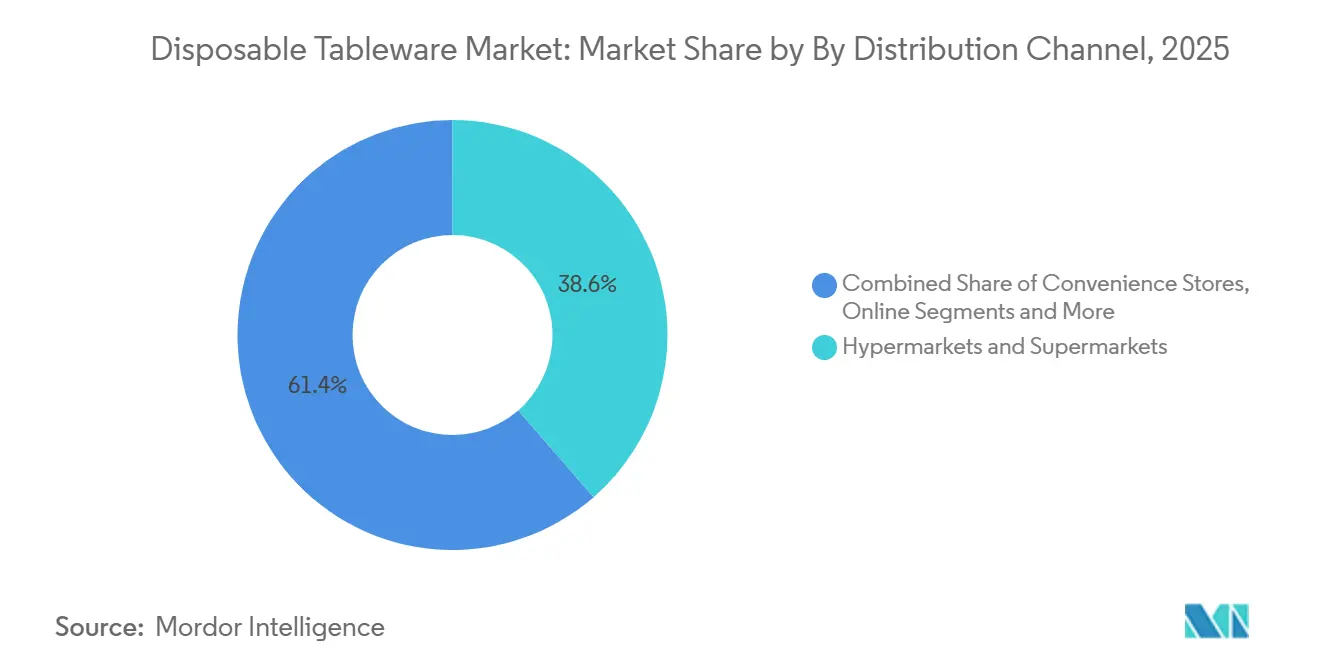
- By distribution channel, hypermarkets and supermarkets held 38.60% of the global disposable tableware market share in 2025, while online is projected to record an 8.95% CAGR through 2031.
- By geography, Asia-Pacific led with a 34.40% of the global disposable tableware market share in 2025 and is projected to expand at a 6.40% CAGR through 2031.
Note: Market size and forecast figures in this report are generated using Mordor Intelligence’s proprietary estimation framework, updated with the latest available data and insights as of 2026.
Global Disposable Tableware Market Trends and Insights
Drivers Impact Analysis*
| Driver | (~) % Impact on CAGR Forecast | Geographic Relevance | Impact Timeline |
|---|---|---|---|
| Food delivery, QSR, and quick-commerce expansion | +1.8% | Global, concentrated in Asia-Pacific tier-2 cities and North America metros | Medium term (2-4 years) |
| Restrictions on single-use plastics push fiber and compostables | +1.5% | European Union, North America, parts of the Middle East, and Asia | Short term (≤ 2 years) |
| Hygiene and convenience in institutional and catering settings | +0.9% | Global institutional buyers | Long term (≥ 4 years) |
| Retail modernization with fast-growing online channels | +0.7% | North America, Europe, Asia-Pacific | Medium term (2-4 years) |
| PFAS-free barrier advances for hot and greasy foods | +0.5% | European Union and North America leadership, with Canada's participation | Short term (≤ 2 years) |
| EPR fees and PPWR compliance drive mono-material redesign | +0.4% | European Union-27 and the United States, with EPR laws | Medium term (2-4 years) |
| Source: Mordor Intelligence | |||
Food Delivery, QSR, and Quick-Commerce Expansion Lifts Off-Premises Consumption
Commercial foodservice retains most of the demand and grows slightly ahead of the category, which keeps off-premises consumption central to the disposable tableware market. The commercial end-user base accounted for 68.25% of consumption in 2025 and is projected to expand at 5.72% through 2031, a trajectory that continues the shift to delivery-first menus and small-footprint outlets optimized for takeout. Asia-Pacific serves as the velocity pocket with a 34.40% share and a 6.40% annual rise, and that combination enlarges the installed base of cups and bowls in a region where app-led ordering has scaled in secondary cities. In North America, online distribution channels are rising at 8.95%, which embeds single-use packaging into grocery e-commerce and into ghost-kitchen routines that prioritize tamper-evident clamshells and reliable vessel seals. Form factors follow food trends, since deeper bowls travel better and accommodate sauces and toppings, which trims complaint rates and preserves operator ratings in aggregator ecosystems. Menu shifts to bowls, ramen, and grain formats reinforce purchasing for molded-fiber and coated-paperboard SKUs and support the uptake of PFAS-free options as those become more available in the disposable tableware market.
Restrictions on Single-Use Plastics Push Fiber and Compostables
New rules in the European Union reduce single-use plastics and raise reuse and recyclability expectations, which steer foodservice buyers to fiber, molded pulp, and recyclable mono-material designs across the disposable tableware market. In the United States, statewide measures such as California’s implementation under SB 54 have advanced bans on expanded polystyrene foodware, and compliance outreach accelerated during 2025 as the ban took effect. A wide group of states has enacted rules to curb polystyrene cups and containers, which compresses legacy foam share and allocates capital to molded-fiber capacity additions within the disposable tableware market [1]National Association of Convenience Stores, “California Reminds Businesses of EPS Foam Ban,” NACS, convenience.org . Capacity decisions in North America echo that pivot, including a new Georgia-Pacific Dixie site that adds significant plate and bowl output and supports foodservice and retail programs. Producers with pan-regional footprints have also targeted fiber and folding-carton investments to address phasedown timelines and to align with public procurement preferences for lower-plastic alternatives in the disposable tableware market.
PFAS-Free Barrier Breakthroughs Unlock Molded-Fiber Performance
Restrictions on PFAS in food-contact materials, alongside retailer policies, raised the bar for barrier performance without fluorinated chemistry, which has pushed suppliers to deploy water-based dispersions, bio-wax systems, and new coating technologies in the disposable tableware market. Company disclosures show consistent progress, including product lines that are positioned as PFAS-free molded fiber and a rising share of catalog items meeting compostability or recyclability certification criteria. Coating and paper-chemistry players have adapted processes that streamline barrier application and qualify for downstream recovery pathways, which support hot-fill and grease-intensive categories without reverting to plastic substrates in the disposable tableware market. As European Union timelines tighten and the United States continues to implement targeted chemical restrictions, brand specifications now lean on third-party certifications or supplier attestations for PFAS-free status, which is shaping procurement checklists and tender scoring. The net effect is a faster cycle of material substitution in tableware, with molded-fiber bowls, plates, and clamshells gaining more high-heat and high-grease use cases across the disposable tableware market.
EPR Fees and European Union PPWR Compliance Accelerate Redesign to Recyclable Mono-Materials
Mandatory producer-responsibility schemes in Europe, set within new packaging rules, link fees to recyclability and drive reengineering toward mono-material constructs that move through mechanical sorting with fewer losses, which matters for the disposable tableware market. The compliance model requires producer registration per member state and funding for collection and sorting, so suppliers look to lighter designs and material simplification to temper fee exposure in tenders that run multi-year cycles. In the United States, states such as California have enacted laws that pair source-reduction goals with infrastructure investment, which raises the premium on recycled-content pathways and on demonstrably recyclable formats within the disposable tableware market. Vendors are responding with lightweighting and recycled-content options for rigid polypropylene and coated paperboard, and company reports document progress toward higher shares of revenue from product lines that meet sustainability criteria. As procurement teams update specifications, table settings that meet recyclability and compostability rules can gain scoring advantages, helping them displace legacy plastic designs in recurring contracts across the disposable tableware market.
Restraints Impact Analysis*
| Restraint | (~) % Impact on CAGR Forecast | Geographic Relevance | Impact Timeline |
|---|---|---|---|
| On-premises reuse and refill mandates cut single-use volumes | -0.6% | The European Union focuses on targets and selected national measures | Medium term (2-4 years) |
| EPS foam prohibitions remove legacy cups and containers | -0.4% | Multiple United States, Canada, the European Union, selected Middle East, and Asia markets. | Short term (≤ 2 years) |
| Cost premiums and volatility for pulp and biopolymers | -0.5% | Europe and North America, with global ripple effects | Short term (≤ 2 years) |
| Composting access gaps and acceptance limits | -0.3% | North America and Europe variability | Long term (≥ 4 years) |
| Source: Mordor Intelligence | |||
On-Premises Reuse and Refill Mandates, and SUP On-Site Bans Reduce Unit Volumes
European rules introduce reuse targets and require food and beverage distributors to offer consumers refill options, which reduces dine-in single-use volumes and affects baseline unit demand within the disposable tableware market. The rules contemplate return systems and deposit frameworks for beverage containers, which pulls some share from one-way formats in on-premises HORECA settings. Large chains are piloting reuse in specific jurisdictions to align with national execution of the European Union framework, although off-premises consumption still dominates use cases in foodservice. In markets where reuse logistics remain complex, operators balance consumer expectations on hygiene and speed with compliance obligations, which can slow the shift away from single-use for takeaway. Over the medium term, reuse pilots and mandates could reshape dine-in unit volumes, but delivery and catering maintain a large portion of demand in the disposable tableware market.
Composting Access Gaps and Acceptance Limits
The number and capacity of full-scale, year-round food scrap composting facilities remain limited relative to demand for compostable packaging, which complicates end-of-life claims and slows broad substitution toward compostables in the disposable tableware market. A 2024 analysis of composting infrastructure in the United States indicates that acceptance of compostable packaging varies by facility and program, and contamination management is a material cost line item that strains operators [2]Closed Loop Partners, “Unleashing the Economic and Environmental Potential for Food Waste Composting in the U.S.,” Closed Loop Partners, closedlooppartners.com . Many curbside and drop-off programs have not standardized acceptance of certified compostable materials, which reduces consumer access and undermines consistent recovery. Converters and brands, therefore, face an adoption gap, since labeling a product as compostable does not guarantee a realistic pathway to industrial composting in many communities. Until local infrastructure expands and acceptance rules converge, compostable tableware will grow, but at a pace defined by access and operational capacity, not only by consumer intent, in the disposable tableware market.
*Our forecasts treat driver/restraint impacts as directional, not additive. The impact forecasts reflect baseline growth, mix effects, and variable interactions.
Segment Analysis
By Product Type: Cups Lead Volume, But Bowls Outpace in Growth
Disposable cups held 31.80% of the category in 2025, while bowls are the fastest climber at a 6.85% CAGR to 2031 as menus shift toward grain bowls, ramen, and layered entrees that favor deeper vessels in the disposable tableware market. This mix reflects operational needs for stacking efficiency, leak resistance, and customer experience during transit, which gives bowls an edge over plates in delivery-heavy channels. Suppliers that scale molded-fiber and coated-paperboard bowls gain exposure to these formats and can pair barrier innovation with tamper-evident lids to address delivery risks across the disposable tableware market. Legacy foam cups and plates continue to decline where bans are active or imminent, which reallocates share to fiber-based SKUs and to recyclable mono-material designs in foodservice programs. Capacity additions for premium paper plates and bowls in North America support this transition by easing supply constraints and improving lead times for national accounts in the disposable tableware market.
Within product types, the disposable tableware market size for bowls is projected to expand at a 6.85% CAGR between 2026 and 2031, which signals continued menu innovation and off-premises optimization around heat, grease, and portability. Paper and molded-fiber cups also benefit from recyclability and compostability credentials where acceptance exists, and sustainability reports document growing shares of certified SKUs year over year in the disposable tableware market. Suppliers are investing in coatings and form factors that retain structural integrity under hot-fill and delivery stress, which supports bowl-led growth and stabilizes cup demand as reusable mandates concentrate mainly on dine-in. As operators standardize packaging for consistency and speed, cups and bowls retain premium shelf space in procurement catalogs that prioritize reliable performance in the disposable tableware market.


By Application: Commercial Dominates, Driven by Institutional Scale
Commercial end-users accounted for 68.25% of consumption in 2025 and are projected to grow at 5.72% toward 2031, keeping foodservice procurement in the lead across the disposable tableware market. This segment covers quick-service, catering, institutional cafeterias, and event venues, where hygiene, throughput, and consistency favor one-way packaging in many settings. Procurement practices in education, healthcare, and corporate dining now add sustainability scoring to specifications, and supplier disclosures show sustained expansion of SKUs that meet compostability or recyclability criteria in the disposable tableware market. Where accepted, molded-fiber and coated-paperboard vessels with verified barrier performance continue to substitute for plastics and foam, while reusable pilots concentrate on dine-in trays or cups.
The Disposable Tableware market size aligned to commercial use cases is set to rise at a 5.72% pace, which reflects structural demand from off-premises formats even as some dine-in settings test reuse. Residential use keeps a smaller share focused on gatherings and home entertaining, with lower purchase frequency and lower influence on product development cycles. In contrast, institutional buyers move large volumes with defined specifications for stacking, leak resistance, and environmental labeling, which gives them leverage over materials and certifications across the disposable tableware market. As extended producer responsibility and recyclability rules evolve, commercial accounts prioritize suppliers that can validate compliance and end-of-life pathways at scale, which narrows vendor lists and raises the quality bar in the disposable tableware market.
By Distribution Channel: Hypermarkets Anchor Volume, Online Surges
Hypermarkets and supermarkets held 38.60% of the distribution share in 2025, which reflects the channel’s breadth and bulk purchasing benefits for consumers and small operators in the disposable tableware market. Convenience stores fill impulse needs, while wholesalers and direct contracts cover pallet volumes for caterers and institutions with predictable delivery schedules and negotiated SKUs. Shelf space and private-label programs in major retailers continue to shape assortment and price points, and fiber-based alternatives gain visibility as packaging rules and retailer policies advance.
The Disposable Tableware market size tied to online channels is set to expand at an 8.95% CAGR to 2031, which triples the footprint from its 2025 base and deepens direct-to-consumer and business-to-business reach. Digital marketplaces allow side-by-side comparisons on certifications and lead times, which reward transparent disclosures and clear environmental claims in the disposable tableware market. Company-run storefronts and business portals shorten feedback loops on sustainable materials, which speeds iteration on lids, clamshells, and molded-fiber bowls. Supplier sustainability reports also link a growing share of new product launches to environmental criteria, which aligns with search filters and procurement checklists online.
Geography Analysis
Asia-Pacific opened 2026 with a 34.40% revenue share and the steepest regional rise at 6.40% to 2031, anchoring growth through urbanization, delivery app penetration in secondary cities, and expanding quick-service footprints that scale cups and bowls in the disposable tableware market. Public and private investment in hospitality and foodservice logistics sustains demand for molded-fiber and coated-paperboard vessels that can tolerate heat and grease in delivery. Suppliers with regional capacity or sourcing ties to fiber and paperboard maintain cost and service advantages that help them win foodservice bids across Asia-Pacific in the disposable tableware market. Regulatory initiatives in several countries are tightening plastic-use standards, which nudges procurement toward recyclable and compostable alternatives in the region. With rising household incomes and digital ordering habits, Asia-Pacific’s structural trends continue to favor a larger installed base of single-use tableware in off-premises channels.
North America combines a mature base with channel change, since online distribution grows at 8.95% and embeds single-use packaging into grocer and ghost-kitchen operations in the disposable tableware market. Ongoing state-level bans on expanded polystyrene compress legacy foam share and support fiber growth, which realigns capital expenditure toward molded-fiber and recyclable rigid formats. New production capacity in plates and bowls has come online at major United States producers, which supports both retail and away-from-home segments and underpins supply chain resilience in the disposable tableware market. Companies with North American and European footprints have tuned portfolios to align with customer sustainability roadmaps, which support a broader transition to PFAS-free barriers and to designs compatible with recyclability.
Europe advances the most stringent framework for reuse, recyclability, and waste reduction, and those rules set the tone for product design and end-of-life claims across the disposable tableware market. Producers face EPR-aligned fees that reward recyclability and penalize hard-to-sort composites, which pushes redesign toward mono-material solutions for trays, bowls, and cups. Pulp and paper markets in 2025 showed pressure from energy and cost dynamics, and industry data point to moderate resilience, which influences fiber-based tableware input costs and supply in the region. Suppliers are investing in PFAS-free molded fiber and barrier-coated paperboard to comply with evolving rules and to meet customer expectations on safe, food-contact packaging in the disposable tableware market. In the Middle East and Africa, as well as South America, regulatory measures on plastics are expanding, and tourism and urban events add intermittent spikes in demand, which create targeted opportunities for compostable and recyclable tableware within local rules and infrastructure realities.

Competitive Landscape
The disposable tableware market is moderately fragmented, and consolidation has accelerated among scale players that manage multi-material portfolios and pan-regional supply chains. Suppliers with broad product catalogs are focusing on molded-fiber alternatives, recyclable rigid options, and PFAS-free barriers to align with customer procurement and with evolving regulatory conditions in key markets. New production assets in North America have strengthened supply positions in premium paper plates and bowls, which reduces lead times and supports large foodservice contracts in the disposable tableware market. Public company disclosures and roadshow materials highlight targeted investments in folding cartons and molded fiber to capture share from phasedown plastic categories, and to meet demand from institutional buyers with sustainability criteria.
Strategic moves emphasize product innovation and certification, where suppliers document a rising portion of revenue from SKUs that meet sustainability benchmarks, which helps them win bids that prioritize verified end-of-life outcomes in the disposable tableware market. Paper-chemistry and coating innovators have aligned barrier properties with recyclability and compostability pathways, which expands molded-fiber use cases into hotter and greasier foods and narrows the performance gap with plastics for many applications [3]Solenis, “Solenis to Showcase Sustainable Paper and Packaging Solutions at FACHPACK 2025 and PACK EXPO Las Vegas 2025,” Solenis, solenis.com . As EPR schemes expand and reuse targets take hold for dine-in, suppliers that can validate recyclability, compostability, and chemical safety stand to benefit from procurement filters that screen for compliance in the disposable tableware market[4]European Parliament, “New EU Rules to Reduce, Reuse and Recycle Packaging,” European Parliament, europarl. europa.eu .
Channel strategy also shapes competition, as hypermarkets and supermarkets rely on private-label assortments while online portals favor transparent certification disclosures and rapid product updates across the disposable tableware market. Companies that run strong direct-to-customer and business portals gain faster feedback on PFAS-free and recyclable designs, which compresses time-to-market for new bowls, cups, and clamshells. Institutional buyers continue to request proof of sustainability attributes and regulatory compliance at the bid stage, which locks in suppliers with verifiable credentials and consistent quality control. This dynamic, together with targeted capacity additions and portfolio shifts, defines competition from 2026 to 2031 in the disposable tableware market.
Disposable Tableware Industry Leaders
Dart Container Corporation
Huhtamaki Oyj
Pactiv Evergreen Inc.
Novolex Holdings (Eco-Products)
Genpak LLC
- *Disclaimer: Major Players sorted in no particular order


Recent Industry Developments
- February 2026: European pulp and paper manufacturers reported 2025 operating trends that reflected cost pressures and competitive dynamics, informing fiber availability and pricing contexts for packaging value chains.
- May 2025: Huhtamaki presented portfolio and capacity updates, including investments to double folding-carton capacity in Paris, Texas, and acquisitions that expand North American molded-fiber capability, aligned to foodservice growth.
- January 2025: California’s statewide ban on expanded polystyrene foodware took effect under SB 54 following compliance reviews, with ongoing agency reminders issued to support enforcement.
- January 2025: California’s statewide ban on expanded polystyrene foodware took effect under SB 54 following compliance reviews, with ongoing agency reminders issued to support enforcement.


Global Disposable Tableware Market Report Scope
Disposable tableware products are made up of coated and plastic resins used in dining utensils, such as drinkware and dishware, including cups, plates, bowls, and serving platters designed for one-time use only.
The Disposable Tableware Market Report is Segmented by Product Type (Cups, Plates, Bowls, Silverware, and Other), Application (Residential and Commercial), Distribution Channel (Hypermarkets & Supermarkets, Convenience Stores, Online, and Other), and Geography (North America, South America, Europe, Asia-Pacific, and Middle East & Africa). Market Forecasts are Provided in Terms of Value (USD).
By Product Type
| Disposable Cups |
| Disposable Plates |
| Disposable Bowls |
| Disposable Silverware |
| Other Product Types |
By Application
| Residential |
| Commercial |
By Distribution Channel
| Hypermarkets & Supermarkets |
| Convenience Stores |
| Online |
| Other Distribution Channels |
By Geography
| North America | Canada |
| United States | |
| Mexico | |
| South America | Brazil |
| Peru | |
| Chile | |
| Argentina | |
| Rest of South America | |
| Europe | United Kingdom |
| Germany | |
| France | |
| Spain | |
| Italy | |
| BENELUX (Belgium, Netherlands, Luxembourg) | |
| NORDICS (Denmark, Finland, Iceland, Norway, Sweden) | |
| Rest of Europe | |
| Asia-Pacific | India |
| China | |
| Japan | |
| Australia | |
| South Korea | |
| South-East Asia | |
| Rest of Asia-Pacific | |
| Middle East & Africa | United Arab Emirates |
| Saudi Arabia | |
| South Africa | |
| Nigeria | |
| Rest of Middle East & Africa |
| By Product Type | Disposable Cups | |
| Disposable Plates | ||
| Disposable Bowls | ||
| Disposable Silverware | ||
| Other Product Types | ||
| By Application | Residential | |
| Commercial | ||
| By Distribution Channel | Hypermarkets & Supermarkets | |
| Convenience Stores | ||
| Online | ||
| Other Distribution Channels | ||
| By Geography | North America | Canada |
| United States | ||
| Mexico | ||
| South America | Brazil | |
| Peru | ||
| Chile | ||
| Argentina | ||
| Rest of South America | ||
| Europe | United Kingdom | |
| Germany | ||
| France | ||
| Spain | ||
| Italy | ||
| BENELUX (Belgium, Netherlands, Luxembourg) | ||
| NORDICS (Denmark, Finland, Iceland, Norway, Sweden) | ||
| Rest of Europe | ||
| Asia-Pacific | India | |
| China | ||
| Japan | ||
| Australia | ||
| South Korea | ||
| South-East Asia | ||
| Rest of Asia-Pacific | ||
| Middle East & Africa | United Arab Emirates | |
| Saudi Arabia | ||
| South Africa | ||
| Nigeria | ||
| Rest of Middle East & Africa | ||


Key Questions Answered in the Report
What is the Disposable Tableware Market size and growth outlook to 2031?
The disposable tableware market size is projected to be USD 34.4 billion in 2025, USD 35.5 billion in 2026, and reach USD 41.23 billion by 2031 at a 3.04% CAGR, supported by regulatory-driven material shifts and rising delivery-led demand.
Which region leads the disposable tableware market in 2026, and how fast is it growing?
Asia-Pacific holds leadership with a 34.40% revenue share and is projected to expand at a 6.40% CAGR through 2031, reflecting urbanization and delivery app penetration in tier-2 cities.
What customer segment drives the most demand in the disposable tableware market?
Commercial end-users, including quick-service chains, caterers, and institutional cafeterias, account for 68.25% of consumption and are projected to grow at 5.72% to 2031 as off-premises formats scale.
Which product types are winning within the disposable tableware market?
Cups lead in 2025 share at 31.80%, but bowls are the fastest growing at a 6.85% CAGR because they handle layered menus and transit better in delivery workflows.
How are regulations shaping the disposable tableware market between 2026 and 2031?
European Union packaging rules tighten reuse and recyclability requirements while United States state actions restrict expanded polystyrene, shifting spend to molded-fiber and recyclable mono-material options and accelerating PFAS-free barrier innovation.
What distribution channels will grow fastest in the disposable tableware market?
Online channels are projected to grow at an 8.95% CAGR through 2031, which will more than triple their 2025 footprint and broaden certified product access for business and consumer buyers.
Page last updated on:


