
Ceiling Lights & Chandeliers Market Size and Share
Market Overview
| Study Period | 2020 - 2031 |
|---|---|
| Market Size (2026) | USD 42.18 Billion |
| Market Size (2031) | USD 54.69 Billion |
| Growth Rate (2026 - 2031) | 5.33 % |
| Fastest Growing Market | Asia Pacific |
| Largest Market | North America |
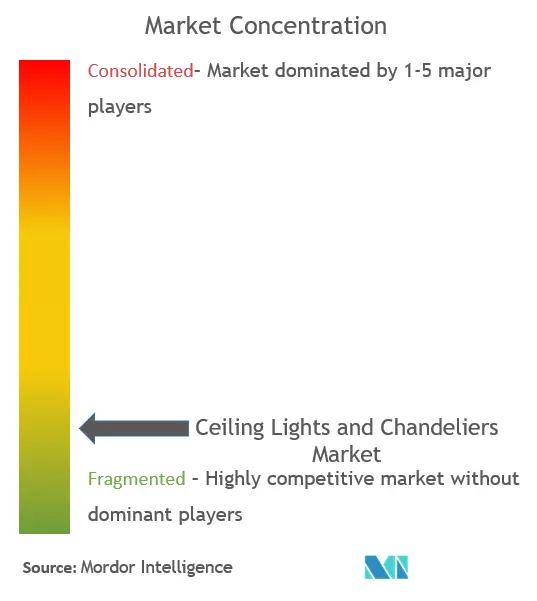
| Market Concentration | Low |
Major Players *Disclaimer: Major Players sorted in no particular order Image © Mordor Intelligence. Reuse requires attribution under CC BY 4.0. | |
Ceiling Lights & Chandeliers Market Analysis by Mordor Intelligence
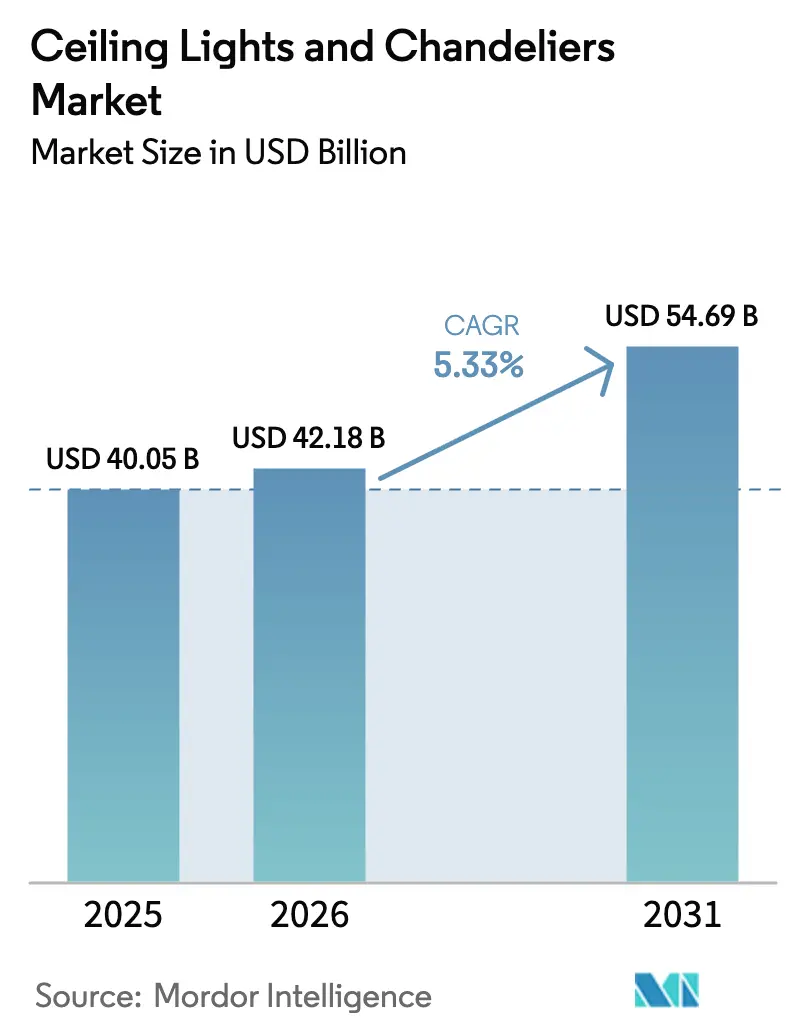
The Ceiling Lights & Chandeliers Market size was valued at USD 40.05 billion in 2025 and estimated to grow from USD 42.18 billion in 2026 to reach USD 54.69 billion by 2031, at a CAGR of 5.33% during the forecast period (2026-2031).
Demand is underpinned by rapid LED adoption, the rising appeal of connected fixtures, and steady residential renovation outlays. Smart luminaires now account for more than one-third of the leading vendors’ portfolios, a share that expanded quickly after 2024 as interoperability standards matured. North America retains the largest regional share thanks to high smart-home penetration and an aging housing stock that drives retrofit activity, whereas Asia-Pacific is the fastest-growing region on the strength of urban housing starts and expanding middle-class incomes. Product substitution remains brisk—traditional sources continue to cede ground to LEDs, and ceiling lights command a 62.9% revenue share even as decorative chandeliers post the briskest growth.
Key Report Takeaways
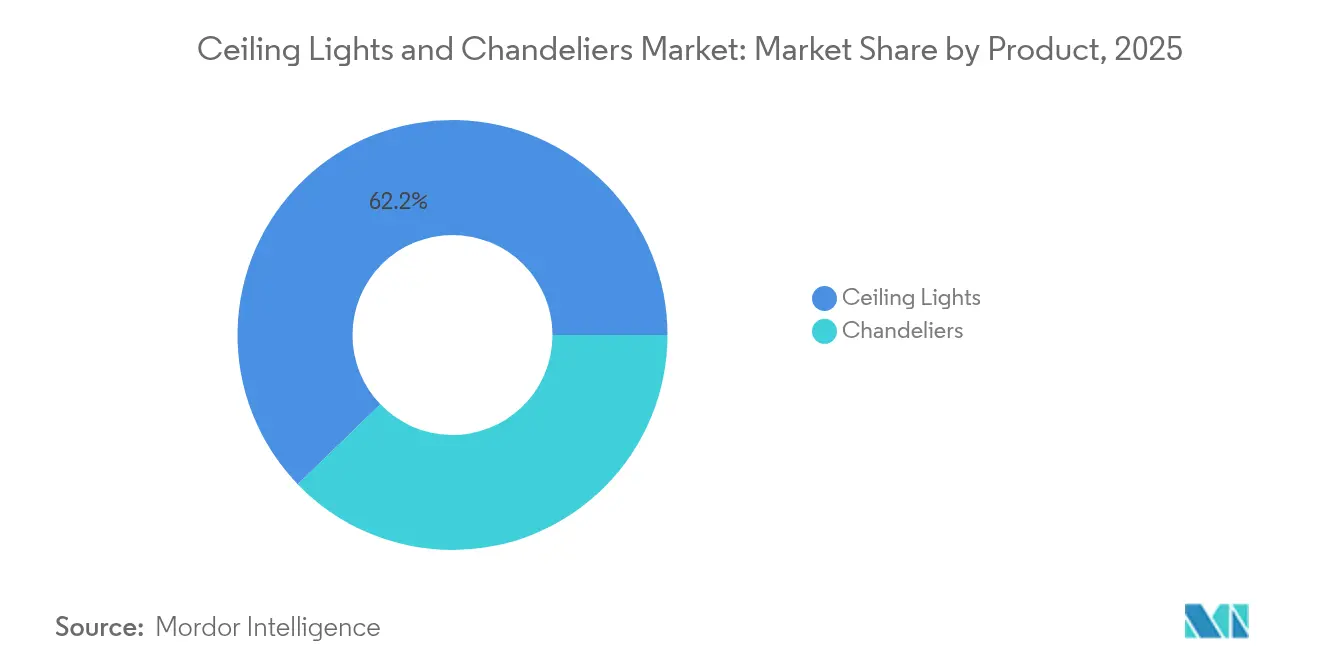
- By product type, ceiling lights led with 62.20% of the ceiling lights & chandeliers market share in 2025; chandeliers are projected to expand at a 6.12% CAGR through 2031.
- By lighting technology, LED solutions captured 53.51% of the ceiling lights & chandeliers market size in 2025, while smart/connected LED systems are projected to grow at an 10.95% CAGR to 2031.
- By material, metal frameworks accounted for 39.59% of the ceiling lights & chandeliers market size in 2025; crystal components are set to grow at a 7.25% CAGR through 2031.
- By end-user, residential applications held 57.56% of the ceiling lights & chandeliers market share in 2025, whereas commercial installations are advancing at a 6.86% CAGR through 2031.
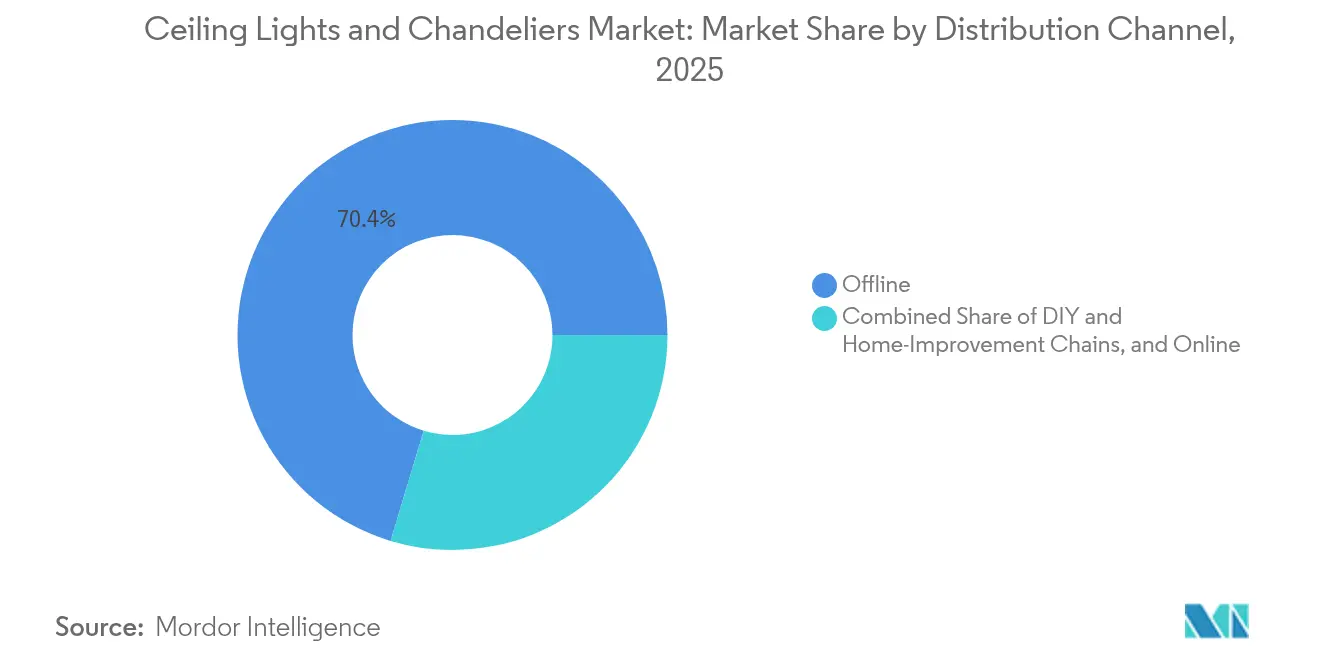
- By distribution channel, offline showrooms and home-center outlets retained 70.35% of 2025 sales; the online segment is expanding at an 8.52% CAGR to 2031.
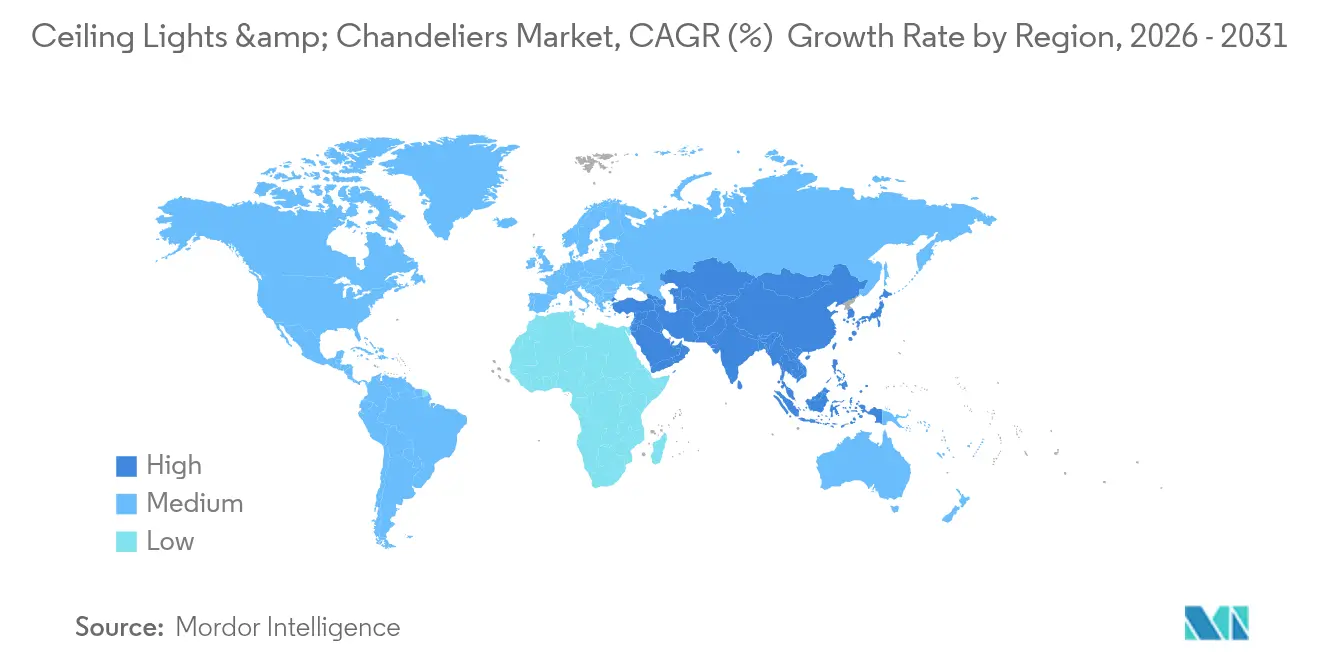
- By region, North America remains the largest geographic contributor around 34.50% of market share in 2025, while Asia-Pacific is forecast to advance at a 8.78% CAGR between 2026-2031.
- Signify, Acuity Brands Lighting, OSRAM GmbH, Eglo Leuchten, and Kichler Lighting collectively held major market share in the 2024 global market.
Note: Market size and forecast figures in this report are generated using Mordor Intelligence’s proprietary estimation framework, updated with the latest available data and insights as of 2026.
Market Trends and Insights
Drivers Impact Analysis of Ceiling Lights & Chandeliers Market*
| Driver | (~) % Impact on CAGR Forecast | Geographic Relevance | Impact Timeline |
|---|---|---|---|
| Increasing Demand for Home Aesthetics & Interior Design | + 3.8% | Global, with emphasis on North America and Europe | Medium term (2-4 years) |
| Urbanization and Rising Residential Construction | + 4.2% | Asia Pacific, Middle East, Latin America | Long term (≥ 4 years) |
| Technological Advancements (Smart & Energy-Efficient Lighting) | + 3.5% | North America, Europe, developed Asia Pacific | Medium term (2-4 years) |
| Growth in Hospitality & Commercial Real Estate Sectors | + 2.1% | Global, with concentration in urban centers | Medium term (2-4 years) |
| Expanding E-Commerce & Online Retail Channels | + 1.7% | Global, with higher impact in developed economies | Short term (≤ 2 years) |
| Source: Mordor Intelligence | |||
Rising home aesthetics and interior design
Lighting has shifted from a purely functional commodity to a defining design element, encouraging homeowners to replace basic fixtures with statement pieces that deliver both ambience and efficiency. Residential lighting still consumes roughly 10% of household electricity, and ENERGY STAR now lists more than 60,000 certified models that blend design and low wattage [1]Source: U.S. Department of Energy, “Solid-State Lighting Program,” energy.gov. Americans spend close to 90% of their time indoors, so improved visual environments consistently rank among the top five home improvement projects. Around 3.7 million United States households upgraded lighting in 2024, underlining steady replacement demand.
Urbanization and Rising Residential Construction
Rapid city growth across Asia-Pacific, the Middle East, and Latin America fuels new-build demand for ceiling-mounted illumination. United Nations data shows 56.2% of the global population lived in urban areas in 2024, with the share tracking toward 68.4% by 2050. Countries will need roughly 2.5 billion new housing units, each requiring multiple fixtures. In the United States, privately owned housing starts hit an annualized 1.56 million in 2024, a 7.2% rise that directly lifts fixture sales.
Technological Advances in Smart and Energy-Efficient Lighting
Internet-enabled luminaires are turning ceilings into nodes for sensing, communications, and efficiency optimization. The U.S. Department of Energy estimates LEDs could trim national lighting energy use by 75% by 2035. Laboratory efficacy already exceeds 200 lumens per watt, and federal guidance promotes occupancy sensing and daylight harvesting in connected fixtures. Standards under development at NIST support cross-brand interoperability, accelerating mainstream adoption.
Growth in Hospitality and Commercial Real Estate Sectors
Commercial landlords target lighting upgrades for both energy savings and experiential value. Lighting represents about 17% of electricity in U.S. commercial buildings. LEED-certified spaces that integrate high-quality fixtures achieve rental premiums near 11%. Employment growth of 1.9 million jobs in leisure and hospitality through 2030 will spur hotel and restaurant openings, each requiring decorative yet efficient ceiling installations.
Restraints Impact Analysis of Ceiling Lights & Chandeliers Market*
| Restraint | (~) % Impact on CAGR Forecast | Geographic Relevance | Impact Timeline |
|---|---|---|---|
| High Cost of Premium and Designer Fixtures | -1.9% | Global, with higher impact in emerging markets | Medium term (2-4 years) |
| Energy Regulations & Compliance Standards | -1.2% | North America, Europe, developed Asia markets | Long term (≥ 4 years) |
| Installation Complexity & Maintenance Issues | -0.8% | Global | Short term (≤ 2 years) |
| Volatility in Raw Material Prices (Glass, Crystal, Metal) | -1.1% | Global, with manufacturing hubs most affected | Medium term (2-4 years) |
| Source: Mordor Intelligence | |||
High Cost of Premium and Fixtures Designer
Statement chandeliers can cost several multiples of standard flush mounts, limiting penetration in price-sensitive segments. Household spending on durable goods is highly elastic above certain thresholds, and tariffs have lifted landed costs for imported components by up to 25% since 2024. Top-income United States households spend 4.7 times more on home furnishings than middle-income peers, illustrating the income asymmetry that caps addressable volume.
Energy Regulations and Compliance Standards
Minimum efficacy rules push lagging technologies out of the market yet also raise compliance costs. California’s Title 24 and U.S. DOE appliance standards demand high lumens-per-watt and quality metrics such as flicker control and CRI ≥90. Manufacturers fund iterative redesign cycles to comply, raising R&D overhead that can pressure pricing.
*Our forecasts treat driver/restraint impacts as directional, not additive. The impact forecasts reflect baseline growth, mix effects, and variable interactions.
Ceiling Lights & Chandeliers Market Segment Analysis
By Product Type:
Ceiling Lights Retain Volume Leadership While Chandeliers AccelerateCeiling lights represented 62.20% of 2025 revenue and remain the default choice across living rooms, kitchens, corridors, and commercial settings. Average United States homes host 12.3 fixtures, two-thirds of which are ceiling mounted . Flush and surface mounts ship in the highest volumes, but pendants show faster growth, reflecting consumer interest in bespoke aesthetics. Chandeliers occupy a smaller slice yet are projected to post a 6.12% CAGR, bolstered by rising installations in dining rooms and hotel lobbies. Imports of decorative fixtures climbed 18.3% in 2024, confirming a resilient appetite for standout designs even when traditional categories mature.
Second-order effects ripple through the ceiling lights & chandeliers market as design expectations converge with smart-home functionality. Leading chandelier makers now experiment with embedded Bluetooth-mesh drivers and tunable-white LEDs, features previously reserved for utilitarian luminaires. New United States single-family builds featuring at least one chandelier rose to 68% in 2024, up 12 points from 2020. These shifts foreshadow a future where decorative form and networked intelligence coexist, widening consumer choice and nudging average selling prices higher.



By Lighting Technology:
LED Supremacy Underpins Smart GrowthLED captured 53.51% of sales in 2025 and is on track to exceed 80% penetration by 2030, displacing fluorescent and halogen incumbents. Efficacy gains of nearly 90% over incandescent lamps deliver compelling paybacks for both homeowners and facility managers. Crucially, smart or connected LEDs register an 10.95% medium-term CAGR, reinforcing the ceiling lights & chandeliers market as an IoT on-ramp. Network-ready drivers, integrated sensors, and firmware upgrades transform fixtures into data points for occupancy analytics and asset management.
Fluorescent lighting maintains a presence in certain commercial and institutional applications, though its market share continues to decline as LED retrofits offer compelling returns on investment with payback periods typically under two years.
By Material:
Metal Frameworks Anchor the Industry, Crystal Outpaces in Luxury TierMetal frames account for 39.59% of revenue because aluminum and steel remain indispensable for structural integrity across price points. The sector consumed about 287,000 tons of aluminum and 143,000 tons of steel in 2024, with recycled content approaching 48% as sustainability goals spread. Rising metal prices—aluminum rose 12.3%—drive manufacturers to adopt precision stamping and additive methods that reduce scrap.
Crystal elements, while smaller in absolute volume, expand at 7.25% CAGR as aspirational homeowners and hospitality operators seek high-impact optics. Imports of crystal parts rose 22.7% in 2024, sourced mainly from Europe’s long-established artisan clusters. Glass diffusers remain mainstream, aided by tempered and borosilicate innovations that improve light distribution and durability. Sustainable-specification projects increasingly specify wood accents, responding to green-building procurement guidelines that favor renewable materials.
By End-user:
Residential Holds Majority; Commercial Gains MomentumHomeowners commanded 57.56% of global revenue in 2025, reflecting steady do-it-yourself upgrades and professional remodels. Lighting ranks among the top five renovation tasks, with 3.7 million United States households performing fixture updates last year. Energy codes embedded in mortgage insurance guidelines further motivate efficient replacements. Digital dimming and color-tuning features, once restricted to commercial niches, now reach the living room, boosting ticket sizes.
Commercial installations grow faster at a projected 6.86% CAGR. Offices, retail, healthcare, and hospitality properties target lighting to lower operating costs and enhance occupant well-being. LEED and WELL building standards reward optimal lux levels, glare control, and circadian-supportive spectra, raising specification complexity and value. Government facility standards, echoed by private developers, increasingly dictate integrated controls, propelling demand for network-ready ceiling-mounted luminaires.
By Distribution Channel:
Showrooms Still Dominate, Online Sales AccelerateBrick-and-mortar showrooms and home centers process 70.35% of 2025 transactions. Tactile evaluation—finish, scale, brightness—remains critical for many buyers, and roughly 3,200 United States lighting showrooms continue to draw foot traffic. However, the 8.52% CAGR online segment steadily chips away, powered by enriched content, free returns, and last-mile capacity improvements. Furniture and décor e-commerce outpaced overall retail growth by a factor of three in 2024, with AR overlays easing visualization hurdles for large fixtures.
Marketplace convergence is inevitable: leading vendors pursue omnichannel strategies such as buy-online-pickup-in-store and virtual consultations. Regulations like the FTC’s merchandise delivery rule safeguard consumer rights, fostering trust in web-based purchases that include fragile or oversized items. Over time, channel lines will blur as physical stores evolve into experiential hubs while online platforms excel at assortment breadth.
Geography Analysis
North America Ceiling Lights & Chandeliers Market
North America retains the greatest chunk of the ceiling lights & chandeliers market revenue with 34.50% of market share in 2025. United States households spent USD 457 billion on improvements in 2024, with lighting upgrades a large beneficiary . Around 2.1 billion ceiling fixtures are installed nationally, and replacement rates sit near 8.3% each year. Canadian policy leans heavily on energy performance, advancing LED share beyond United States levels. Mexico’s domestic factories saw lighting output rise 12.7% in 2024 as exporters diversified away from Asia.
APAC Ceiling Lights & Chandeliers Market
Asia-Pacific is the fastest-growing territory, set for 8.78% CAGR to 2031. China added 106 million new urban residents between 2020-2024, swelling demand for residential fixtures. India needs 25 million additional homes by 2030, and lighting typically equals 2.7% of construction budgets. Japan’s domestic LED output climbed 15.3% in 2024 as renovation cycles accelerated. Korea reached 78% LED penetration in 2024 on the back of stringent energy codes. Singapore’s Green Mark program pushes Southeast Asian developers toward efficient luminaires.
Europe Ceiling Lights & Chandeliers Market
Europe remains influential owing to its design heritage and tight regulation. The Ecodesign Directive fully phased out most halogen lamps by 2024, focusing sales on high-efficacy LEDs. Eurostat shows households spend EUR 213 (USD 187.21) yearly on lighting products and power, with daylight variability shaping regional differences. The UK cites lighting as 18% of commercial electricity load, spurring retrofit projects. Germany’s fixture manufacturing rose 3.7% in 2024 as suppliers pivoted to premium lines. France’s strict light-pollution rules strengthen demand for controlled-beam optics.

Regulatory Landscape
Energy-efficiency and product-performance rules continue to shape fixture design choices and compliance costs, reinforcing the shift toward high-efficacy LED ceiling lights and connected controls. In the United States, California Title 24 and U.S. Department of Energy lighting-related requirements emphasize lumens-per-watt, flicker control, and high color quality (often specified around CRI 90 for premium applications), which affects driver selection and optical design for recessed downlights, panels, and decorative luminaires.
In Europe, policy emphasis is broadening from energy use toward lifecycle transparency and circularity. The Ecodesign Directive has already pushed most halogen lamps out by 2024, concentrating the market on LED-based luminaires, and the EU Ecodesign for Sustainable Products Regulation (ESPR) introduces Digital Product Passport requirements with phased enforcement through 2027. Implementing Regulation (EU) 2026/1189 (June 17, 2026) adds EPD and lifecycle carbon footprint labeling requirements for smart lighting beginning October 1, 2026, which increases documentation and data-management steps for manufacturers selling connected ceiling fixtures across the region.
Value Chain Analysis
The value chain begins with upstream inputs such as LED packages and chips, drivers and controls (including wireless modules), optics and diffusers (glass and polymers), and structural materials such as aluminum and steel. Component supply remains concentrated in established Asian electronics and lighting clusters, while final luminaire fabrication and assembly increasingly follow a multi-country model to balance cost, lead time, and exposure to trade, especially for bulky and fragile ceiling fixtures and chandeliers that face higher logistics and damage risk.
In the midstream, OEMs and contract manufacturers integrate electronics, thermal management, and housings, then validate safety and performance to meet region-specific requirements. Supply risk centers on driver and controller availability, particularly where trailing-edge semiconductor capacity (roughly 28 nm to 90 nm nodes) is contested by automotive and data-center demand, and on raw-material volatility for metals and specialty glass or crystal elements. Downstream, products move through offline showrooms and home-improvement chains (still the majority channel) and through faster-growing e-commerce, where packaging engineering, returns handling, and after-sales support can materially affect margins for decorative and premium connected ceiling fixtures. Intellectual property and licensing also operate as a parallel value-chain layer, with programs such as Signify's EnabLED involving about 1,700 participating companies and shaping market access for LED and control implementations.
Competitive Landscape
Giants such as Signify, Acuity Brands, and OSRAM leverage scale to integrate lighting with broader smart-building platforms. Signify is piloting LiFi networks that convert fixtures into data-transmission nodes. Acuity Brands’ USD 1.115 billion acquisition of QSC brings cloud-managed audio-video systems under one roof, aligning with its “Intelligent Spaces” strategy. Mid-tier players pursue specialization—Eglo thrives on European-centric decorative portfolios, while Kichler targets North American residential upgrades.
White-space emerges at the crossroads of daring design and embedded intelligence. Agile newcomers combine artisanal crystal craft with Bluetooth-mesh drivers to capture design-led but tech-savvy buyers. Digitally enabled manufacturing lets incumbents cut lead times by 40%, unleashing mass customization that addresses varied ceiling heights, color temperatures, and control protocols. Supply-chain resilience also shapes strategies: Signify shifted production out of China to mitigate tariff and geopolitical risks, partnering with Dixon Technologies in India in 2025 to serve both local and export demand.
Ceiling Lights & Chandeliers Industry Leaders
Signify (Philips Lighting)
Acuity Brands Lighting
OSRAM GmbH
Eglo Leuchten
Kichler Lighting
- *Disclaimer: Major Players sorted in no particular order
Ceiling Lights & Chandeliers Market Companies Covered in this Report
- Signify (Philips Lighting)
- OSRAM GmbH
- Eglo Leuchten GmbH
- Kichler Lighting LLC
- Hubbell Lighting Inc.
- Generation Brands (Visual Comfort & Co.)
- Zumtobel Group
- FLOS S.p.A.
- Hudson Valley Lighting Group
- Artemide S.p.A.
- Feilo Sylvania
- Panasonic Life Solutions
- Cree Lighting
- Lutron Electronics
- Hinkley Lighting
- Savoy House
- Schonbek Worldwide Lighting
- Currey & Company
- Foscarini*

Market Opportunities and Future Outlook
The clearest opportunity is where premium design overlaps with embedded intelligence, as suppliers expand portfolios in connected, human-centric ceiling fixtures and modular ceiling systems. Signify's June 2026 Philips Skylight launch, positioned around bringing a daylight-like experience indoors, highlights the direction of ceiling-mounted luminaires that combine ambience, wellness-oriented lighting concepts, and smart control compatibility. At the same time, customization-led ceiling formats (modular, configurable, and architect-specified systems) are being commercialized through offerings such as Signify myCreation (including the 3D-printed, modular myCreation Puzzle launched in July 2025), which targets shorter lead times, made-to-order aesthetics, and sustainability narratives.
Regulatory and procurement changes create additional whitespace for manufacturers that operationalize lifecycle reporting and circularity at the SKU level. EU initiatives, including Digital Product Passports under ESPR and carbon footprint and EPD labeling requirements for smart lighting starting October 1, 2026 under Implementing Regulation (EU) 2026/1189, encourage investment in traceability, recycled content strategies, and product documentation that can be differentiators in specification-heavy commercial and premium residential segments. On the supply side, trade frictions and tariffs are also reinforcing regionalization, with final assembly and sourcing diversification toward ASEAN and Mexico to reduce landed-cost volatility for ceiling fixtures sold into North America and other tariff-sensitive markets.
Recent Industry Developments in Ceiling Lights & Chandeliers Market
- August 2026: Signify (Philips Lighting) unveils Philips Skylight designed to bring the feeling of daylight indoors. The daylight-mimicking ceiling skylight integration enhances human centric lighting and expands the smart ceiling ecosystem.
- June 2026: Signify (Philips Lighting) launches Philips Skylight designed to bring the feeling of daylight indoors. The daylight-mimicking ceiling skylight integration strengthens premium, daylight aligned ceiling solutions and interoperability with smart lighting platforms.
- July 2025: Signify (Philips Lighting) launches myCreation Puzzle, a modular, 3D-printed linear lighting system. The modular, sustainable lighting system supports configurable installations in ceiling spaces and encourages use of recycled materials.


Ceiling Lights & Chandeliers Market Report Scope and Research Methodology
Market Definition and Coverage
This market covers the sales value of ceiling-mounted light fixtures and chandeliers that are installed in residential and commercial buildings, including new builds and replacement demand. Sizing follows revenue generated across the value chain at the point of sale to customers, captured in USD.
Scope exclusions: We exclude non-ceiling fixtures (such as table, floor, and wall lights) and building-integrated architectural lighting that is typically priced and procured as a separate system.
Segments Covered in This Report
- By Product Type
- Ceiling Lights
- Flush/Surface Mount
- Semi-Flush
- Recessed Downlights
- Pendant & Drop Lights
- Chandeliers
- Traditional
- Transitional
- Modern / Contemporary
- Ceiling Lights
- By Lighting Technology
- LED
- Fluorescent
- Incandescent & Halogen
- HID & Others
- By Material
- Metal
- Crystal
- Glass
- Wood & Natural Materials
- Plastics & Composites
- By End-user
- Residential
- Commercial
- Offices and Co-Working Spaces
- Hospitality (Hotels, Resorts, Restaurants)
- Retail & Shopping Malls
- Healthcare Facilities
- Educational Institutions
- Industrial
- By Distribution Channel
- Offline/Showrooms & Specialty Stores
- DIY and Home-Improvement Chains
- Online/E-commerce Platforms
- By Geography
- North America
- Canada
- United States
- Mexico
- South America
- Brazil
- Peru
- Chile
- Argentina
- Rest of South America
- Asia-Pacific
- India
- China
- Japan
- Australia
- South Korea
- South East Asia (Singapore, Malaysia, Thailand, Indonesia, Vietnam, and Philippines)
- Rest of Asia Pacific
- Europe
- United Kingdom
- Germany
- France
- Spain
- Italy
- BENELUX (Belgium, Netherlands, and Luxembourg)
- NORDICS (Denmark, Finland, Iceland, Norway, and Sweden)
- Rest of Europe
- Middle East And Africa
- United Arab Emirates
- Saudi Arabia
- South Africa
- Nigeria
- Rest of Middle East And Africa
- North America
Data Sources, Market Sizing, and Validation
Desk Research
Desk research is used to set the outer boundaries for demand, supply, and pricing so the model remains tied to real installation activity. We rely on public sources such as US Census Bureau construction and housing releases, Eurostat building indicators, UN Comtrade trade flows for lighting products, and lighting and electricity context from IEA, along with standards and program guidance from groups such as the International Commission on Illumination (CIE).
We also reviewed company annual reports, investor presentations, and reputable trade press to understand product-mix shifts (for example, LED penetration and decorative premiumization) and channel dynamics across online and offline retail. Where needed, paid subscriptions were used for company financials and intelligence, patent databases, and shipment-level import and export records to sanity-check supplier concentration and regional pricing ranges. These examples are not exhaustive, and many other public sources were also consulted for data collection, validation, and clarification.
Primary Interviews and Surveys
Primary work focused on validating how ceiling lights and chandeliers are specified, priced, and replaced across regions, then checking whether secondary indicators align with on-the-ground demand. We spoke with a mix of manufacturers, distributors, retailers, installers, and commercial specifiers across APAC, EMEA, and the Americas so gaps around channel margins, product mix, and project cycles could be closed. In a few cases, we re-contacted select participants when early model outputs showed unusual swings in LED pricing, renovation timing, or import dependency assumptions.
Distribution of primary research fieldwork respondents
| Company type | Respondent position | Region |
|---|---|---|
| Top tier: 25% | CXOs: 18% | APAC: 51% |
| Mid tier: 57% | Functional/Unit leaders: 35% | EMEA: 30% |
| Smaller Players: 18% | Managers: 47% | Americas: 19% |
Market-Sizing & Forecasting
The core sizing uses a top-down demand reconstruction that starts from building activity and replacement cycles, then translates those drivers into fixture demand using penetration and mix assumptions. We corroborate totals with selective bottom-up checks, such as sampled ASP-by-type multiplied by estimated unit volumes in key countries, plus channel checks to ensure margins and discounting do not inflate value.
Inputs were chosen because they are observable and explain ceiling-mounted fixture demand even when the data is uneven. Common anchors include housing starts and completions, renovation spend signals, commercial floor-space additions, LED adoption and price progression, import and export movement for relevant lighting categories, and the shifting share of online retail for decorative fixtures. For forecasting, scenario analysis was used to reflect different paths for construction cycles and price mix, and assumptions were stress-tested with interview feedback on lead times, project postponements, and replacement frequency. When bottom-up evidence was missing for smaller countries, we used proxy ratios tied to construction intensity and income bands, and adjusted the proxies only after the variance was explained in notes.
Data Validation & Update Cycle
Model outputs were checked against independent signals, including trade flow direction, construction indicators, and reported revenue movement patterns that point to pricing or mix changes. If a country output showed an abrupt jump that could not be explained by housing activity, imports, or price trends, it was flagged for a second pass and then re-validated through follow-up calls. We also run internal peer reviews where another analyst challenges key assumptions like replacement timing, LED share, and channel pricing before sign-off.
Reports are refreshed annually, and interim updates are triggered when material events occur, such as sharp construction slowdowns, unusual tariff changes, or large pricing resets in LED components. Before delivery, we do a fresh scan of major public indicators and news so clients receive the latest updated view of the market.
Mordor Intelligence's Ceiling Lights and Chandeliers Market Size Versus Other Published Estimates
Published market values can differ more than people expect because each publisher draws the boundary of what counts as a ceiling fixture, and then applies its own pricing and channel assumptions. Timing also affects comparability, since LED ASPs and home improvement demand can shift quickly, changing base-year value even when volumes look stable.
Key gaps usually come from whether architectural downlights and broader luminaires are included, how online discounts and installer markups are treated, and whether trade values are used as a proxy for consumption. The year used for currency conversion and how often the base case is refreshed also adds spread when the same product mix is being discussed.
Benchmark comparison
| Source | Market Size | Gaps in Research Methodology |
|---|---|---|
| Mordor Intelligence | USD 40.05 B (2025) | |
| Trade Journal A | USD 47.96 B (2024) | Combines ceiling fixtures with adjacent architectural lighting categories and applies higher list-price assumptions, so value expands beyond typical transaction pricing for installed ceiling products. |
| Regional Consultancy B | USD 38.00 B (2025) | Uses a narrower product basket and treats some chandelier-related trade flows as a separate decorative segment, which reduces the counted revenue in markets with higher import shares. |
The table shows a spread that mainly comes from category overlap and price treatment, and then secondarily from base-year timing. In Mordor Intelligence's model, revenue is counted only for ceiling-mounted fixtures sold for residential and commercial use, and the pricing is anchored to transaction-level ranges validated through channel interviews rather than full list prices. This keeps the total traceable to clear demand drivers like building activity and replacement cycles, and it also makes annual refresh updates easier to reproduce.


Key Questions Answered in the Report
What is the current size of the ceiling lights & chandeliers market?
The market is valued at USD 42.18 billion in 2026 and is projected to reach USD 54.69 billion by 2031.
Which region leads the ceiling lights & chandeliers market?
North America holds the largest regional share, supported by high renovation spending and smart-home adoption.
How fast are smart LED fixtures growing within the ceiling lights & chandeliers industry?
Smart or connected LED systems are forecast to register an 10.95%CAGR between 2026-2031.
What share of sales still moves through physical stores?
Offline showrooms and home-center chains captured 70.35% of global revenue in 2025, though e-commerce is expanding at a 8.52% CAGR.
Who are the top companies in this space?
Signify, Acuity Brands Lighting, OSRAM GmbH, Eglo Leuchten, and Kichler Lighting together controlled major market share of worldwide revenue in 2024.
Page last updated on:





