Market Overview
| Study Period | 2020 - 2031 |
|---|---|
| Forecast Data Period | 2026 - 2031 |
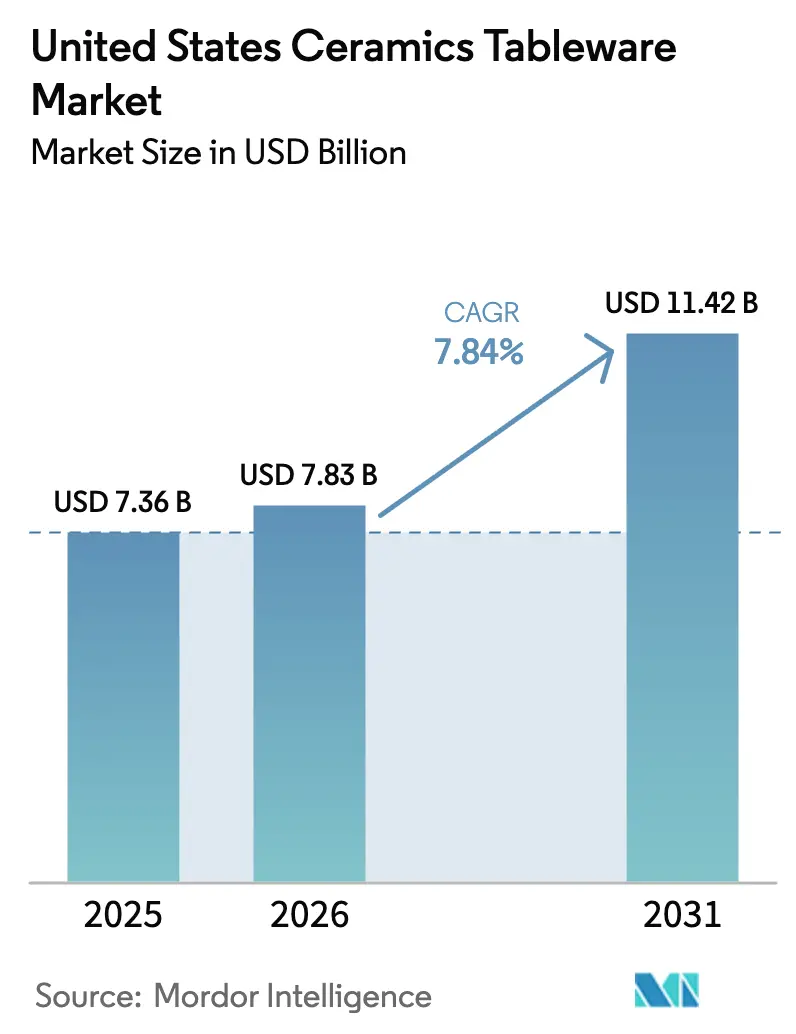
| Base Year Market Size (2025) | USD 7.36 Billion |
| Market Size (2026) | USD 7.83 Billion |
| Market Size (2031) | USD 11.42 Billion |
| Growth Rate (2026 - 2031) | 7.84% CAGR |
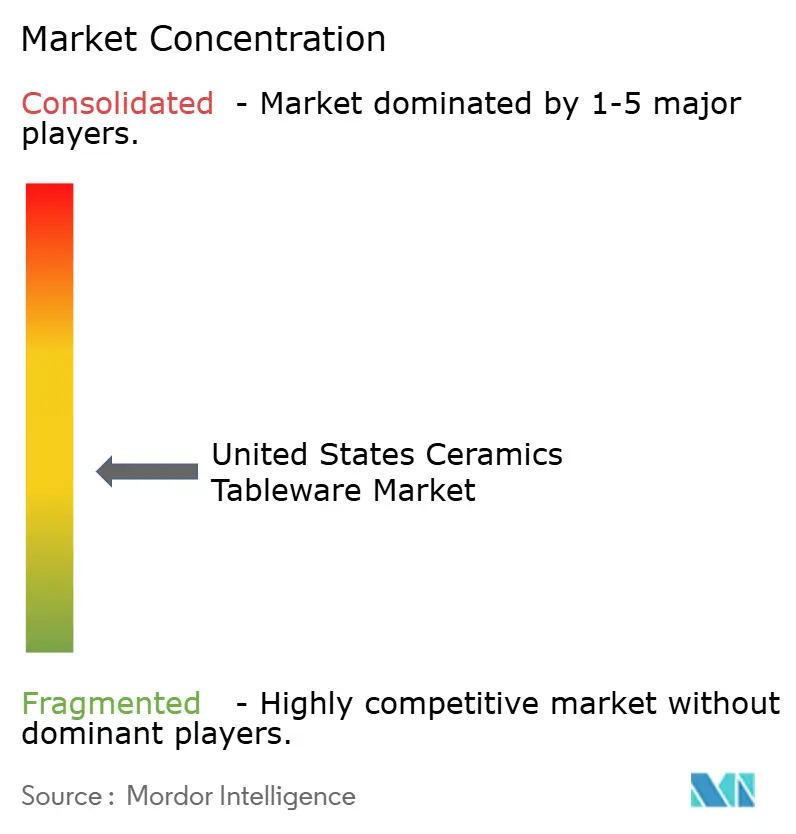
| Market Concentration | Medium |
Major Players *Disclaimer: Major Players sorted in no particular order Image © Mordor Intelligence. Reuse requires attribution under CC BY 4.0. | |
United States Ceramics Tableware Market Analysis by Mordor Intelligence
The United States Ceramics Tableware Market size was valued at USD 7.36 billion in 2025 and is estimated to grow from USD 7.83 billion in 2026 to reach USD 11.42 billion by 2031, at a CAGR of 7.84% during the forecast period (2026-2031).
The United States ceramic tableware market is experiencing steady growth, driven by a structural shift in consumer behavior and renewed activity across commercial end-use sectors. Following the pandemic, household consumption patterns have reset, with increased emphasis on home entertaining, lifestyle upgrades, and gifting. This has supported sustained demand for durable, design-oriented ceramic dinnerware across both premium and mass-market price segments. Growth is further reinforced by renovation and refurbishment cycles within the hospitality sector. Hotels, restaurants, and catering operators are increasing bulk replacement purchases as dining traffic normalizes and experiential dining concepts expand. These commercial upgrades continue to contribute meaningfully to market expansion through the forecast period. On the supply side, evolving trade policies and energy cost dynamics are reshaping sourcing strategies and margins. Tariff pressures have accelerated the diversification of supply chains away from China, while domestic manufacturers are adapting to higher natural gas and electricity costs. Despite these challenges, producers are leveraging operational efficiencies and selective pricing strategies to maintain competitiveness. Additionally, the expansion of direct-to-consumer and online distribution channels has improved market accessibility and transparency. Shorter lead times, clearer compliance standards, and greater visibility into sourcing and product provenance have strengthened buyer confidence and widened the customer base.
Key Report Takeaways
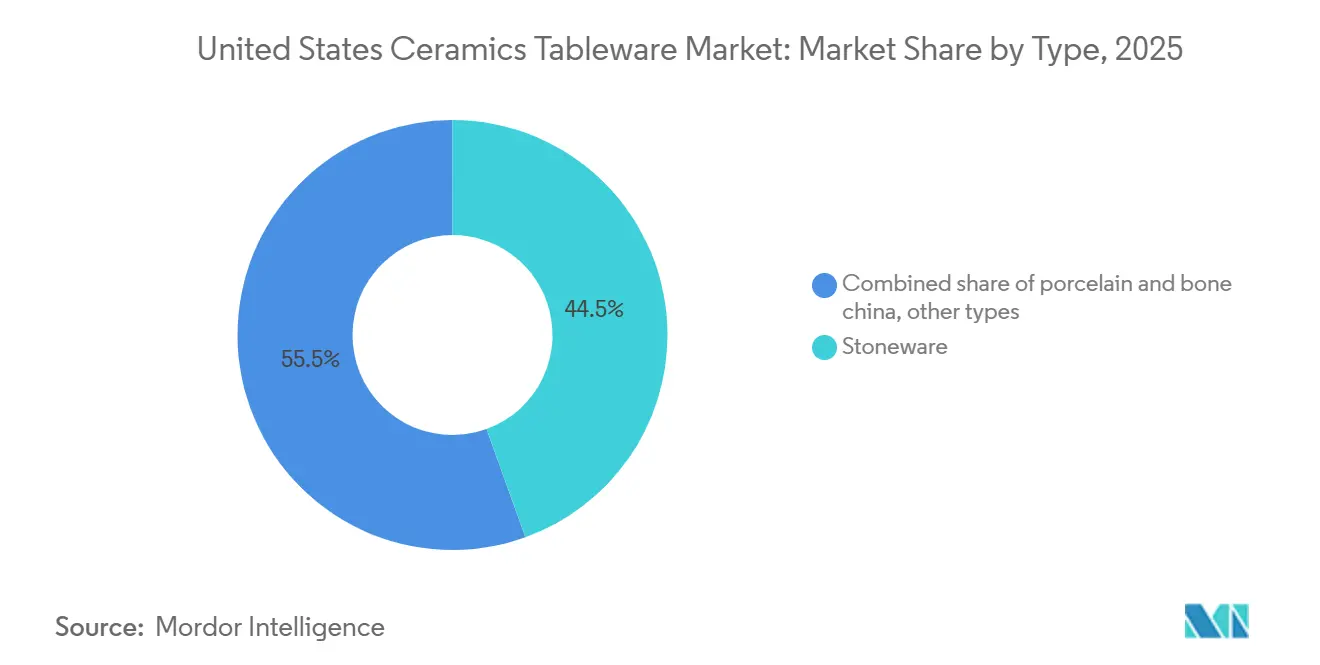
- By type, stoneware held 44.48% of the United States ceramic tableware market share in 2025, while porcelain and bone china are projected to grow at a 7.44% CAGR through 2031.
- By end user, households accounted for 58.38% of the United States ceramic tableware market share in 2025, while the food service subsegment within commercial is projected to expand at 11.76% CAGR through 2031.
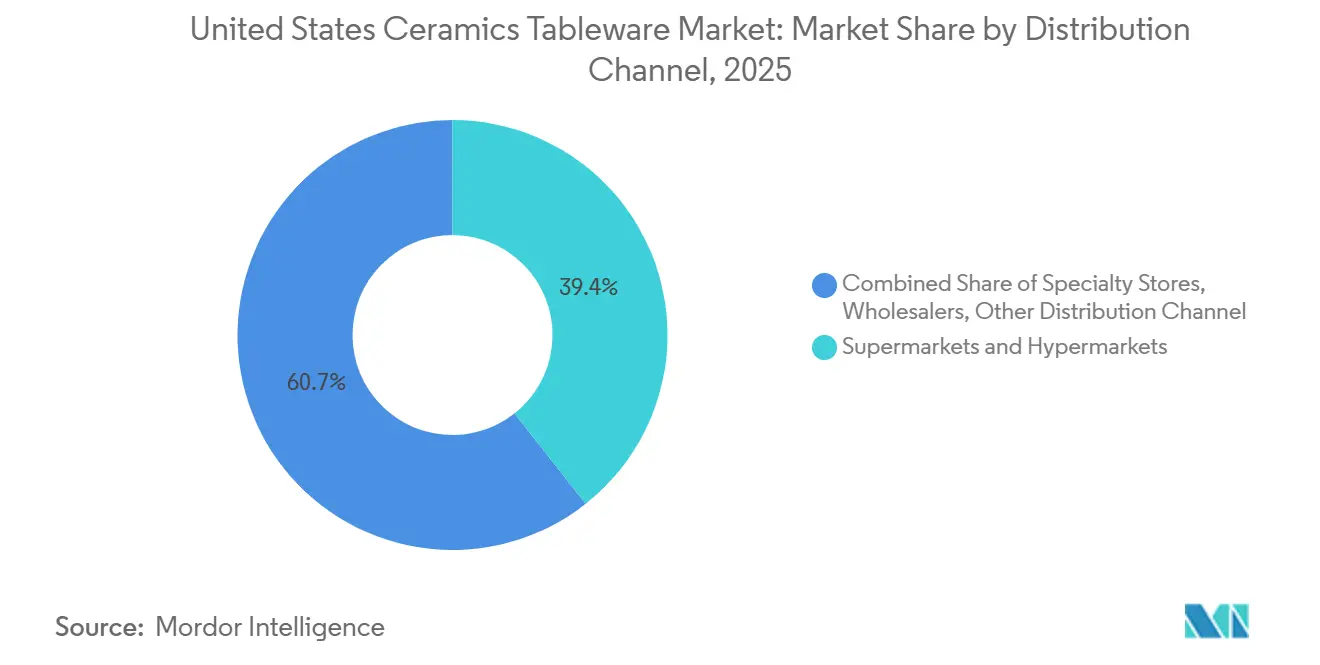
- By distribution channel, supermarkets and hypermarkets represented 39.35% of the United States ceramic tableware market share in 2025, while online is set to grow at 15.39% CAGR to 2031.
- By geography, the South led with 33.49% of the United States ceramic tableware market share in 2025, while the West is the fastest growing at 7.44% CAGR through 2031.
Note: Market size and forecast figures in this report are generated using Mordor Intelligence’s proprietary estimation framework, updated with the latest available data and insights as of January 2026.
United States Ceramics Tableware Market Trends and Insights
Drivers Impact Analysis*
| Driver | (≈) % Impact on CAGR Forecast | Geographic Relevance | Impact Timeline |
|---|---|---|---|
| Post-pandemic resurgence of home entertaining & gifting | +1.2% | National, with early gains in the West and the Northeast | Short term (≤ 2 years) |
| Hospitality renovation cycle spurs commercial replacement demand | +2.1% | South and West | Medium term (2-4 years) |
| Social-media-led demand for distinctive stoneware aesthetics | +1.5% | National, peaking in the West and the Northeast | Short term (≤ 2 years) |
| 3-D printing and digital decals enable micro-batch custom lines | +0.8% | West and Northeast | Long term (≥ 4 years) |
| Retail private-label near-shoring cuts lead times | +1.3% | South and Midwest | Medium term (2-4 years) |
| Stricter state heavy-metal rules favor certified United States makers | +1.5% | West and Northeast | Medium term (2-4 years) |
| Source: Mordor Intelligence | |||
Post-Pandemic Resurgence of Home Entertaining Drives Premium Tableware Purchases
The post-pandemic revival of home entertaining and social gatherings remains a central growth driver for the United States ceramic tableware market, underpinning elevated consumer demand for durable, design-forward dinnerware, serving ware, and entertaining essentials. As households prioritize hosting and gifting occasions, preferences have shifted toward higher-quality stoneware and vitrified porcelain tailored to both everyday use and aesthetic versatility. Design heritage and brand narratives are increasingly influential, with heritage labels and curated collections resonating with consumers seeking premium, emotionally compelling products. Domestic manufacturing momentum further reflects this demand trend. For example, Asheville-based East Fork Pottery announced a USD 2.5 million investment to expand its production capacity, adding 30,000 square feet of manufacturing space and creating approximately 40 new skilled production jobs while sustaining over 125 existing positions as it ramps up output to double current volume over the next three years[1]Source: Asheville Area Chamber of Commerce, “East Fork Pottery Leading Creative Manufacturing Revival in Asheville,” Asheville Area Chamber of Commerce, ashevillechamber.org. This expansion underscores how sustained national demand for high-quality ceramic tableware encourages capacity growth among United States makers, reinforcing premium positioning and supply resilience.
Hospitality Renovation Cycle Spurs Bulk Commercial Replacement Orders
The ongoing renovation and reinvestment cycle within the United States hospitality sector is a key demand driver for the United States ceramic tableware market. After several years of deferred capital expenditure during the pandemic, hotel operators are prioritizing property improvement plans focused on guest-facing venues, particularly food-and-beverage outlets. According to CBRE, hotel F&B departments emerged as a bright spot in 2025, with operators increasing spending to refresh dining concepts, improve service quality, and align offerings with evolving guest expectations. This reinvestment is translating directly into higher commercial tableware procurement. United States hotels reported a 17.3% year-over-year increase in the other expenses category in the first half of 2025, covering China, silverware, linens, and related equipment, outpacing broader cost inflation across the sector[2]Source: CBRE Research, “Hotel Food and Beverage – A Bright Spot in 2025,” CBRE, cbre.com. As dining rooms are refurbished, operators are revisiting tabletop specifications to meet updated brand standards, withstand intensive dishwashing conditions, and support contemporary plating requirements across formats ranging from all-day dining to chef-driven concepts. Replacement cycles are also being compressed as properties synchronize tabletop procurement with broader renovation timelines to minimize downtime and stabilize unit costs. This effect is amplified by geographic concentration of hotel openings and refurbishments in the South and West, where Sunbelt and coastal markets continue to attract new investment.
Social-Media-Led Demand for Distinctive Stoneware Aesthetics
Visual storytelling around plating and tablescapes has increased the perceived value of unique glazes, textures, and forms, which supports premium price realization in the United States ceramic tableware market. Momentum around legacy designs has prompted reissues that resonate with collectors and new buyers, exemplified by Lenox’s Spice Village relaunch that aligned with renewed appetite for curated tabletop sets. Restaurants that anchor regional dining scenes have also influenced household preferences as guests seek to replicate on-premises experiences at home, a trend reflected in the breadth of venues recognized across the 2025 Northeast selection of the MICHELIN Guide[3]Source: Michelin Media, “MICHELIN Guide Reveals 2025 Northeast Cities Selection,” Michelin, michelinmedia.com. Brand extensions into community and circular economy programs have further increased engagement, illustrated by Heath Ceramics’ resale initiative that brings legacy pieces back into use while reinforcing product longevity. These consumer behaviors reinforce the appeal of stoneware’s tactile finishes and the role of design collaborations in guiding purchase decisions across retail and online channels for the United States ceramic tableware market.
Retail Private-Label Near-Shoring Cuts Lead Times and Inventory Risk
Ongoing diversification away from China under evolving Section 301 tariffs is accelerating near-shoring and multi-country sourcing strategies within the United States ceramic tableware market[4]Source: Institute for Supply Management, “Tariffs and Trade Wars: Supply Chain Effects,” Institute for Supply Management, ism.ws. Retailers and importers are prioritizing closer-to-home manufacturing partnerships to stabilize lead times, reduce logistics volatility, and limit working-capital exposure. These advantages are particularly important for private-label and seasonal assortments that require frequent refresh cycles and faster time-to-shelf. Near-shoring enables more responsive replenishment and tighter alignment with social, gifting, and promotional calendars, while improving oversight of compliance and quality standards. Large private-label suppliers benefit from scale efficiencies in fast-turn assortments, supporting mass-retail demand across price points. In parallel, consolidation activity and investments in distribution infrastructure are strengthening regional reach and synchronizing production schedules with retailer demand windows, reinforcing private-label sourcing optimization as a structural growth driver for the market.
Restraints Impact Analysis*
| Restraint | (≈) % Impact on CAGR Forecast | Geographic Relevance | Impact Timeline |
|---|---|---|---|
| High kiln-firing energy costs | -1.8% | Midwest and South | Short term (≤ 2 years) |
| Low-cost Asian imports pressure margins | -2.3% | National, acute in the South and West | Medium term (2-4 years) |
| Volatile kaolin and ball-clay supply | -0.9% | South and National | Medium term (2-4 years) |
| Proposition 65 recall risk uncertainty | -1.2% | West and National | Medium term (2-4 years) |
| Source: Mordor Intelligence | |||
High Kiln-Firing Energy Costs Erode Domestic Manufacturing Margins
Elevated and volatile energy costs represent a key restraint for domestic manufacturers in the United States ceramic tableware market. Ceramic production is highly energy-intensive, with kiln firing and drying processes relying heavily on natural gas and electricity. Through 2025, uneven increases in natural gas prices for industrial users have raised delivered energy costs, complicating production planning and limiting manufacturers’ ability to pass through price increases without affecting demand. Broader energy market dynamics have further intensified cost pressures. Expanding United States LNG export capacity has increased competition for domestic gas supply, affecting both contracted volumes and spot-market exposure. At the same time, higher electricity prices for industrial consumers have compounded the overall input-cost burden for facilities that depend on both fuel sources across firing, glazing, and finishing stages. These pressures are particularly acute in key production hubs across the Midwest and parts of the South, where exposure to seasonal price swings and transportation constraints can lead to abrupt unit-cost variability. As a result, manufacturers are adopting more cautious production schedules and tighter throughput management to preserve margin stability.
Low-Cost Asian Imports Pressure Margins Across Price Tiers
Persistent import competition from Asian manufacturers continues to constrain pricing flexibility across entry-level and mid-tier segments of the United States ceramic tableware market. Lower production costs in select Asian sourcing hubs limit the ability of domestic producers to fully pass through rising energy, labor, and compliance expenses, particularly in product categories that depend on labor-intensive forming, glazing, and decorative processes. While adjustments to Section 301 tariffs have prompted partial sourcing diversification, cost advantages remain pronounced in high-volume formats. Retailers with established private-label programs leverage global supplier networks and large-volume commitments to maintain stable landed costs, sustaining price pressure on domestic suppliers and reinforcing aggressive promotional calendars during peak gifting and holiday cycles. Efficient port access through Western and Southern gateways further supports rapid inland distribution of imported assortments, intensifying competition with United States-manufactured lines. In response, domestic manufacturers are increasingly emphasizing brand equity, verified compliance, and service-level differentiation to defend margins and preserve mix.
*Our forecasts treat driver/restraint impacts as directional, not additive. The impact forecasts reflect baseline growth, mix effects, and variable interactions.
Segment Analysis
By Type: Porcelain Gains on Chip-Resistant Vitrification While Stoneware Holds Household Share
Stoneware held 44.48% of the United States ceramic tableware market share in 2025, aided by durable vitrified bodies and a wide palette of glazes that serve both daily use and display needs. This segment appeals to households that value dishwasher and microwave compatibility alongside color variety, which supports repeat purchasing of open-stock plates, bowls, and mugs across channels. Commercial buyers also maintain steady orders of vitrified stoneware for banquet and high-turn operations, where resistance to chipping in dish rooms is essential. Within the United States ceramic tableware market, stoneware benefits from curated aesthetics that align with social content trends and modern casual dining formats. As live events and gatherings stabilize, stoneware’s balance of price and durability remains central to both replacement and incremental set building in the United States ceramic tableware market.
Porcelain and bone china are the fastest-growing types with a projected 7.44% CAGR through 2031, supported by fine-dining requirements and household trade-up behavior into brighter whites and thinner profiles. The category’s vitrification and glaze performance factor into high-temperature dishwashing scenarios, which improves lifecycle economics in hotels and restaurants. Brand releases have leveraged heritage and limited editions to reintroduce porcelain narratives to younger buyers, with Lenox’s Spice Village relaunch reinforcing appetite for cohesive sets at accessible premium price points. Other types, including earthenware and niche formulations, continue to play a supporting role where specific finishes or price thresholds are required across retail assortments. Over the forecast, porcelain’s gains are expected to complement stoneware’s large base, with both formats remaining core to the United States ceramic tableware market.


By End User: Food-Service Subsegment Eclipses Household Growth on Renovation-Driven Capex
Household retained a 58.38% share in 2025, reflecting the depth of use occasions that sustain core dinnerware and serveware purchases across the United States ceramic tableware market. Consumers prioritize complete sets that coordinate color and form, with seasonal refreshes often tied to gifting and home updates that require replacements or expansions. Online discovery has added variety to household assortments, as direct-to-consumer brands highlight material safety and manufacturing provenance in product pages and marketing. The channel also supports color and glaze experimentation in small batches, which aligns with décor cycles without forcing large inventory commitments. These elements underpin the household’s baseline strength while providing pathways to premiumization in the United States ceramic tableware market.
The commercial segment is set to outpace household, led by the food-service subsegment, which is projected to grow at 11.76% CAGR through 2031, while accommodation and hospitality track slightly lower. The rebound in property improvement plans and dining-room renovations is moving tabletop choices to the forefront as operators refresh guest experiences. Spending momentum within hotel food-and-beverage departments included a significant year-over-year increase in other expenses during the first half of 2025, a category that encompasses China and related front-of-house items. Operators seek chip resistance, verification of compliance, and clarity on long-run availability when consolidating SKU lists under tighter inventory disciplines. These needs support volume orders, predictable replenishment, and vendor partnerships that can meet service-level targets in the United States ceramic tableware market.
By Distribution Channel: Online Surges on D2C Bypass While Supermarkets Retain Transaction Volume
Supermarkets and hypermarkets held 39.35% of the United States ceramic tableware market share in 2025 with a mix of everyday sets, open-stock essentials, and seasonal rotations that capture high-traffic occasions. Private-label programs feature heavily within these retailers, which helps anchor value-price points while expanding style breadth during gifting and holiday peaks. Specialty stores deliver curated selections and in-store experiences that support visual merchandising and brand collaborations, which help defend margins against discounting cycles. Wholesalers continue to serve independent outlets and smaller commercial accounts, although direct buying from manufacturers has increased where volumes justify it. These channels collectively support the broad reach of the United States ceramic tableware market while accommodating varied buying preferences.
Online is the fastest-growing channel with a projected 15.39% CAGR through 2031 as brands and studios expand direct storefronts and subscriptions. The United States ceramic tableware market benefits from a digital shelf that can present compliance, material science, and care instructions alongside creative content that influences purchase decisions. Scale-up investments reflect this channel strength, highlighted by East Fork’s expansion program to meet sustained direct-to-consumer demand. Heritage retailers also extend reach via ecommerce and omnichannel offerings, with in-store exclusives complemented by online discovery and pre-order windows for limited editions. Over the forecast period, the balance between brick-and-mortar and online will remain a core dynamic as consumers weigh immediacy, selection, and confidence in sourcing within the United States ceramic tableware market.
Geography Analysis
The South led with a 33.49% share in 2025, reflecting the region’s hotel and restaurant footprint and the pace of household formation in fast-growing metropolitan areas that reinforce long-run demand in the United States ceramic tableware market. The regional profile also benefits from proximity to near-shored supply, which shortens lead times for private-label and seasonal collections that rely on replenishment consistency. As operators execute renovations and reopen dining formats, the South continues to show healthy front-of-house investments that include tabletop refresh and expansion projects. Distribution advantages through major ports and logistics corridors support speed-to-shelf for import and domestic flows, which helps stabilize availability across retail and commercial outlets. These dynamics underpin the South’s role as a growth anchor for the United States ceramic tableware market through 2031.
The West is the fastest growing region with a 7.44% CAGR through 2031 on a base that includes large hospitality clusters and a strong artisan presence that drives premiumization in the United States ceramic tableware market. Compliance scrutiny is intense, which raises the bar for documentation and glaze safety across assortments and incentivizes stronger vendor qualification. The region’s culinary leadership reinforces household preferences for distinctive shapes and finishes as diners translate dining-room inspirations into at-home purchases, a pattern visible in the breadth of venues highlighted by the MICHELIN Guide. Brand investment in showroom and retail presence complements online demand, including new locations that expand access to design-led assortments and trade programs. Over the forecast, the region’s innovation and design culture will continue to elevate the United States ceramic tableware market mix.
The Northeast accounted for a significant share in 2025, anchored by dense urban markets with high tableware replacement needs across households and hospitality in the United States ceramic tableware market. Fine-dining density across major cities elevates design standards for plating and tabletop selection, which tends to cascade into household buying behaviors as guests translate restaurant experiences to home. The region’s recognition within the 2025 MICHELIN Guide underscores the continued influence of chef-led programs on glass, cutlery, and porcelain selection alongside core dinnerware. Retailers here blend heritage labels with contemporary studios, while compliance and quality assurances remain essential for multi-state distribution. Looking forward, the Northeast is positioned to benefit from periodic refurbishment cycles and a stable base of premium buyers who sustain higher per-setting spending in the United States ceramic tableware market.
Competitive Landscape
The United States ceramic tableware market remains moderately concentrated, with the largest manufacturers holding a significant portion of the overall market share in 2025. Corelle Brands leads the competitive landscape, followed by Gibson Homewares, Lenox Corporation, The Fiesta Tableware Company, and Libbey Inc., together shaping pricing and distribution dynamics across major channels. Despite this concentration, the market continues to offer meaningful opportunities for design-led studios and specialized private-label suppliers that compete on agility, assortment curation, and speed to market. Retailers and commercial buyers increasingly favor suppliers that demonstrate strong compliance capabilities, including end-to-end traceability and consistent product testing. These expectations are influencing product development priorities, with greater emphasis on durable ceramic bodies, stable glaze performance, and verified raw-material sourcing. As a result, compliance rigor has become a competitive differentiator rather than a baseline requirement.
Leading vendors are actively investing to expand geographic reach, improve speed-to-market, and strengthen channel partnerships across household and commercial segments. Strategic acquisitions have been used to broaden portfolios and enhance service capabilities, particularly in hospitality-focused tableware, where reliability and scale are critical. Distribution expansion within North America has enabled faster fulfillment for commercial accounts and reduced lead-time sensitivity. At the same time, design-focused manufacturers are increasing their physical and digital retail presence to improve brand visibility and customer engagement. Capacity expansion among direct-to-consumer studios highlights confidence in sustained demand while preserving craftsmanship and quality control. Collectively, these initiatives reflect a practical emphasis on footprint optimization, distribution alignment, and channel accessibility.
Product differentiation strategies increasingly center on provenance, material safety, and sustainability, shaping purchasing decisions across both residential and commercial end users. Brands are refining assortment narratives to highlight durability, responsible sourcing, and long-term value, reinforcing trust and repeat purchasing. Circular initiatives, including branded resale and product life-extension programs, are gaining traction as sustainability becomes more embedded in consumer expectations. Heritage manufacturers are also leveraging archival designs and legacy collections to appeal to both established customers and newer audiences seeking authenticity. Over the forecast period, the balance between imported products and near-shored manufacturing is expected to continue evolving. Vendors that combine responsiveness, documentation, and regional service capabilities are best positioned to defend market share as demand shifts between household and commercial channels.
United States Ceramics Tableware Industry Leaders
Corelle Brands (Instant Brands)
Gibson Homewares
Lenox Corporation
The Fiesta Tableware Company
Libbey Inc.
- *Disclaimer: Major Players sorted in no particular order

Recent Industry Developments
- December 2025: East Fork Pottery announced a USD 2.5 million expansion of its Asheville production facility to double output, create about 40 new skilled jobs, and sustain more than 125 existing positions, reflecting strong national demand for its ceramic products. The company will increase capacity while supporting local economic growth and living‑wage employment.
- October 2025: The Pioneer Woman dinnerware collection at Walmart has been relaunched to mark its 10th anniversary with refreshed designs and expanded pieces, including new dinnerware, drinkware, and barware. The updated line blends timeless rustic charm with durable stoneware suited for everyday use, offered in refined colourways that enhance versatility and appeal.
- July 2025: Heath Ceramics launched “Pass the Plate,” a branded resale marketplace for pre‑owned pieces that generated about USD 200,000 in resale value in its first 10 months, delivered a strong ROI, kept thousands of pounds of product out of landfills, and strengthened customer engagement and lifetime value.
- May 2025: Heath Ceramics opened its first showroom outside California in Austin’s Bouldin Creek neighborhood, providing visitors an opportunity to explore its handcrafted tableware within the Swedish Hill café setting.


United States Ceramics Tableware Market Report Scope
This report aims to provide a detailed analysis of the US ceramic tableware market. It focuses on the market dynamics, emerging trends in the segments and regional markets, and insights into various product and application types. Also, it analyzes the key players and the competitive landscape in the US ceramic tableware market. The United States Ceramics Tableware Market is segmented by Type (Porcelain and Bone China, Stoneware (Ceramic), and Other Types), By End User (Household, Commercial[Accomodation and Hospitality Segment, Food Service Segment, and Other End Users]), By Distribution Channel (Supermarkets and Hypermarkets, Specialty Stores, Wholesalers, Online, and Other Distribution Channels). The report offers market size and forecasts for the United States Ceramics Tableware Market in value (USD Million) for all the above segments.
By Type (Value)
| Porcelain & Bone China |
| Stoneware (Ceramic) |
| Other Types |
By End User (Value)
| Household | |
| Commercial | Accommodation & Hospitality Segment |
| Food Service Segment | |
| Other End Users |
By Distribution Channel (Value)
| Supermarkets & Hypermarkets |
| Specialty Stores |
| Wholesalers |
| Online |
| Other Distribution Channels |
By Geography (Value)
| Northeast |
| Midwest |
| South |
| West |
| By Type (Value) | Porcelain & Bone China | |
| Stoneware (Ceramic) | ||
| Other Types | ||
| By End User (Value) | Household | |
| Commercial | Accommodation & Hospitality Segment | |
| Food Service Segment | ||
| Other End Users | ||
| By Distribution Channel (Value) | Supermarkets & Hypermarkets | |
| Specialty Stores | ||
| Wholesalers | ||
| Online | ||
| Other Distribution Channels | ||
| By Geography (Value) | Northeast | |
| Midwest | ||
| South | ||
| West | ||


Key Questions Answered in the Report
What is the current size and expected growth of the United States ceramic tableware market?
The United States ceramic tableware market size is USD 7.83 billion in 2026 and is projected to reach USD 11.42 billion by 2031 at a 7.84% CAGR.
Which product types are leading and which are growing fastest in the United States ceramic tableware market?
Stoneware leads with 44.48% share in 2025, while porcelain and bone china are the fastest growing with a 7.44% CAGR through 2031.
Which end-use segments are driving demand in the United States ceramic tableware market?
Household holds 58.38% share in 2025, but the commercial food-service subsegment is projected to grow at 11.76% CAGR through 2031, supported by hotel and restaurant refurbishments.
How are distribution channels shifting in the United States ceramic tableware market?
Supermarkets and hypermarkets hold 39.35% share in 2025, while online is the fastest growing channel with a 15.39% CAGR to 2031 as direct-to-consumer brands expand.
Which regions lead and grow fastest within the United States ceramic tableware market?
The South leads with a 33.49% share in 2025, and the West is the fastest growing at a 7.44% CAGR through 2031.
Page last updated on:


