Surimi Market Size and Share
Market Overview
| Study Period | 2021 - 2031 |
|---|---|
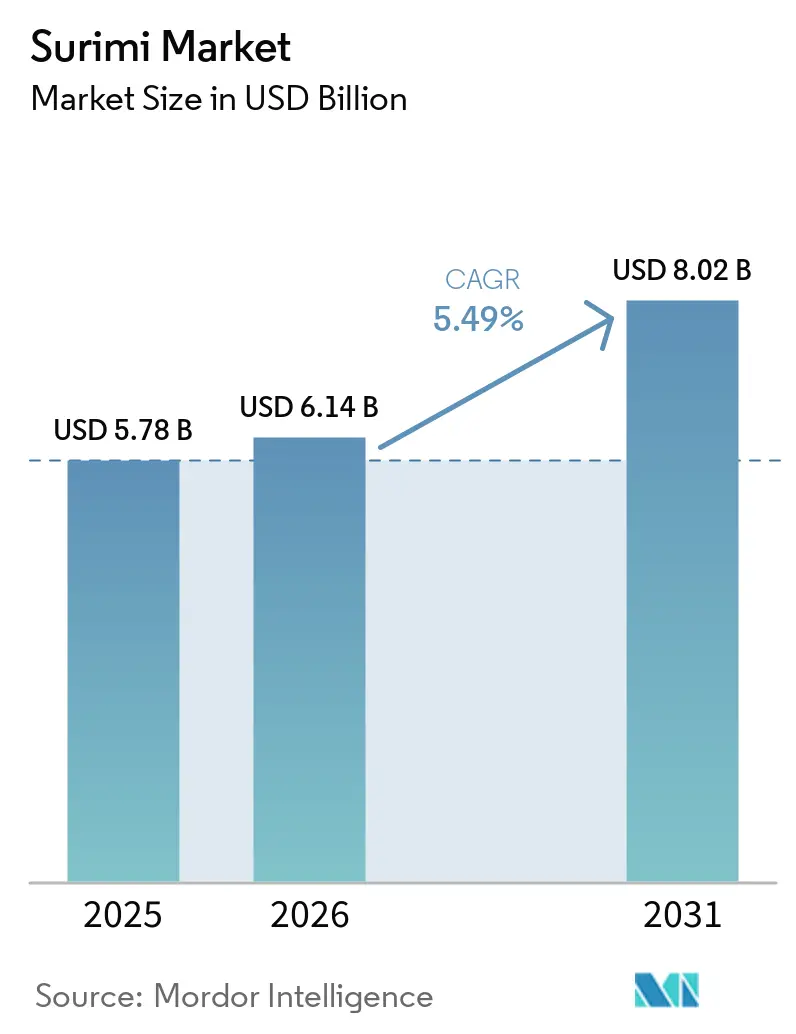
| Market Size (2026) | USD 6.14 Billion |
| Market Size (2031) | USD 8.02 Billion |
| Growth Rate (2026 - 2031) | 5.49% CAGR |
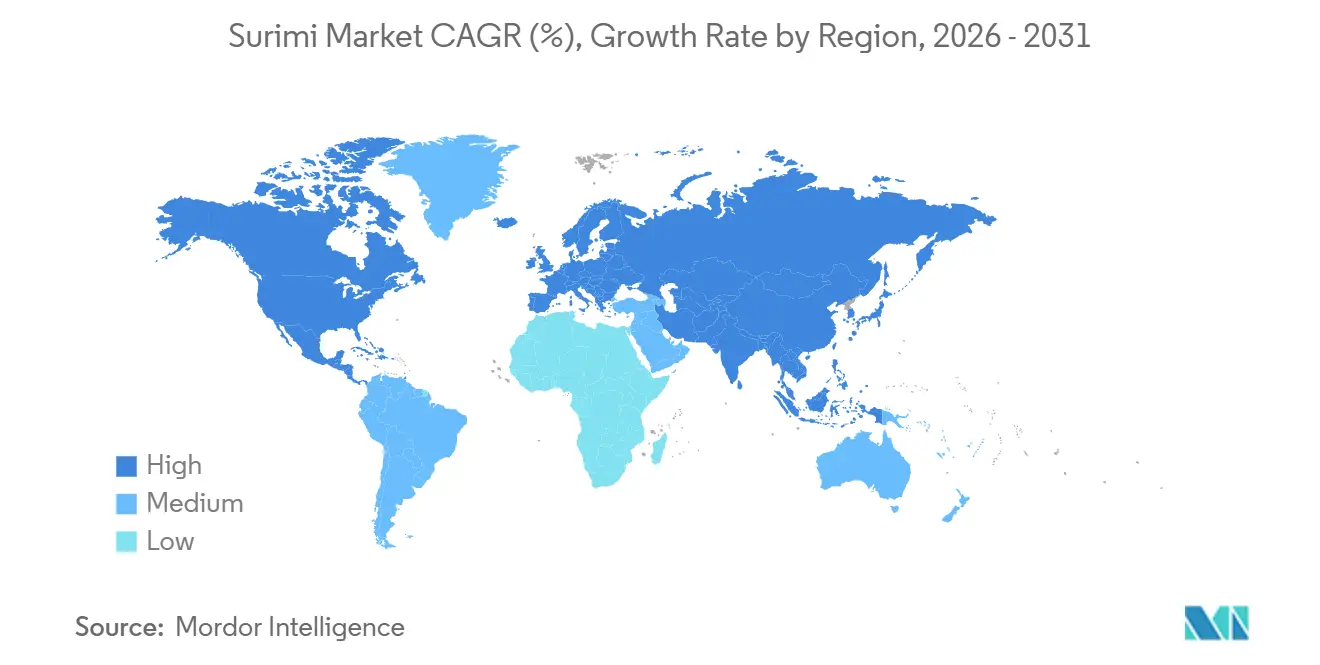
| Fastest Growing Market | Asia-Pacific |
| Largest Market | North America |
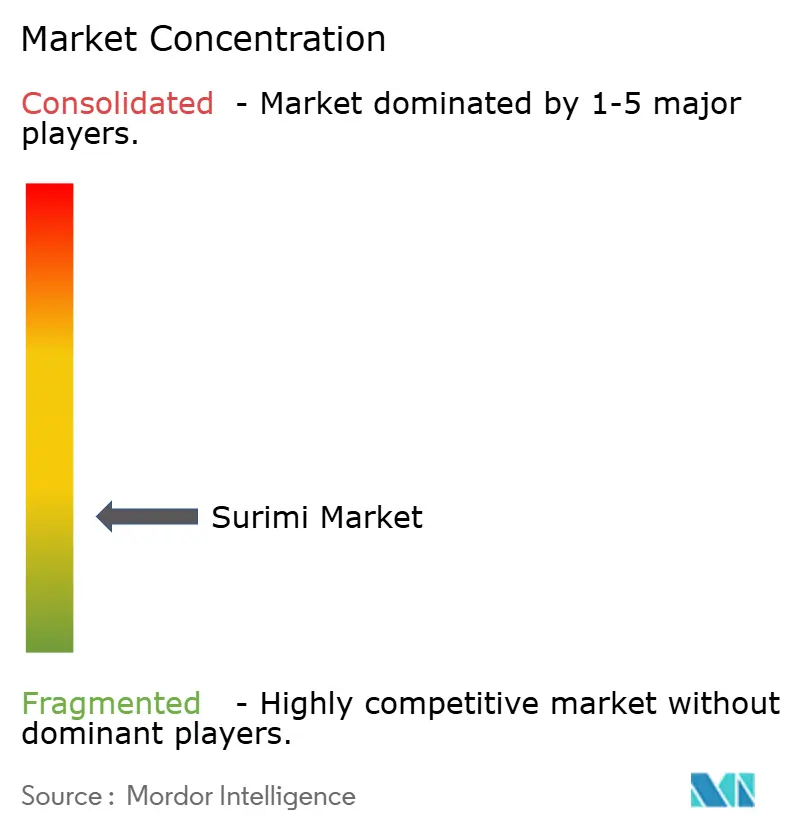
| Market Concentration | Low |
Major Players *Disclaimer: Major Players sorted in no particular order Image © Mordor Intelligence. Reuse requires attribution under CC BY 4.0. | |
Surimi Market Analysis by Mordor Intelligence
The surimi market size was valued at USD 5.78 billion in 2025 and is estimated to grow from USD 6.14 billion in 2026 to reach USD 8.02 billion by 2031, at a CAGR of 5.49% during the forecast period (2026-2031). The surimi market is gaining support from food manufacturers that want a lower-cost protein base than shellfish and premium meat, especially in processed and prepared foods. Global surimi production rebounded 6.3% year over year through H1 2025 to an estimated 437,000 metric tons, led by Russia, China, and Southeast Asian processors, which showed that supply recovered after the 2024 downturn. The surimi market is also benefiting from wider use in reformulated foods because its protein structure supports gel formation, neutral taste, and cleaner-label product design with natural functional ingredients. Supply risk still matters in the surimi market because lower Alaska pollock output in 2024 and stronger Russian supply changed sourcing decisions and price behavior across key buyer markets in 2025 and 2026. The surimi market is therefore moving on 2 tracks at the same time, with buyers seeking low-cost protein and processors trying to secure more stable, traceable, and value-added supply.
Key Report Takeaways
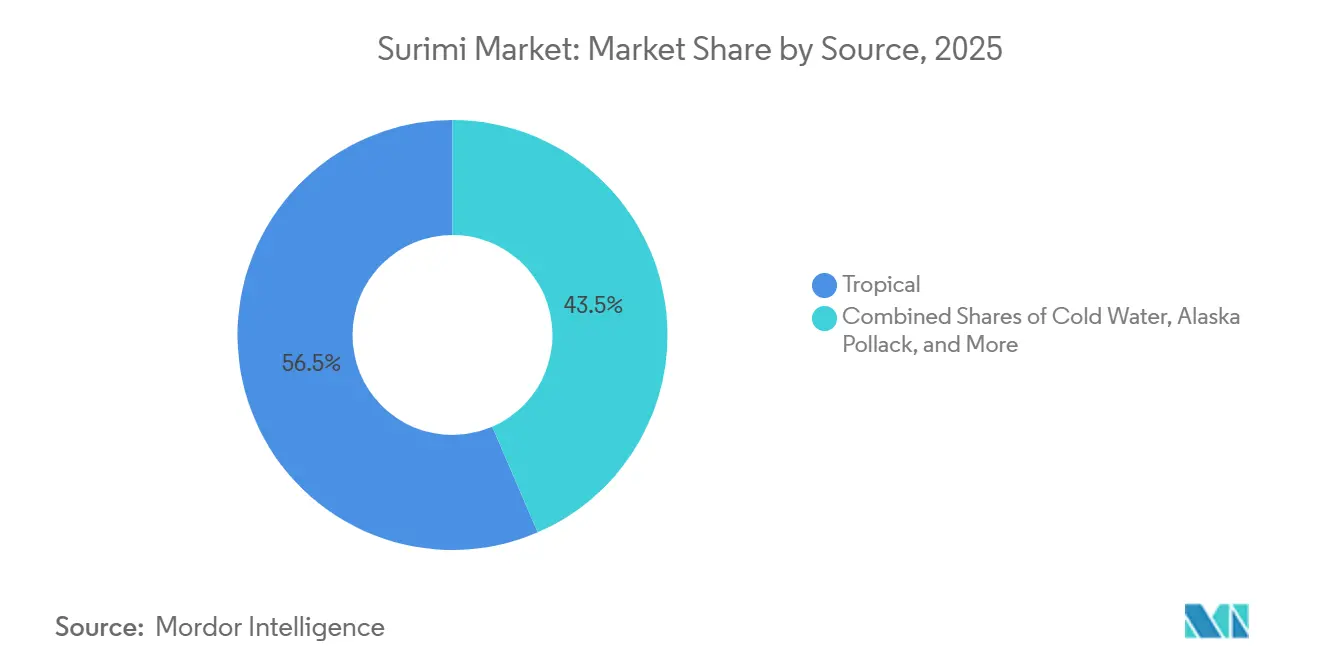
- By source, tropical species held a 56.49% share in 2025, while cold water species are forecast to expand at a 6.85% CAGR through 2031.
- By form, frozen surimi accounted for a 67.35% share in 2025, while processed surimi is projected to grow at a 7.15% CAGR through 2031.
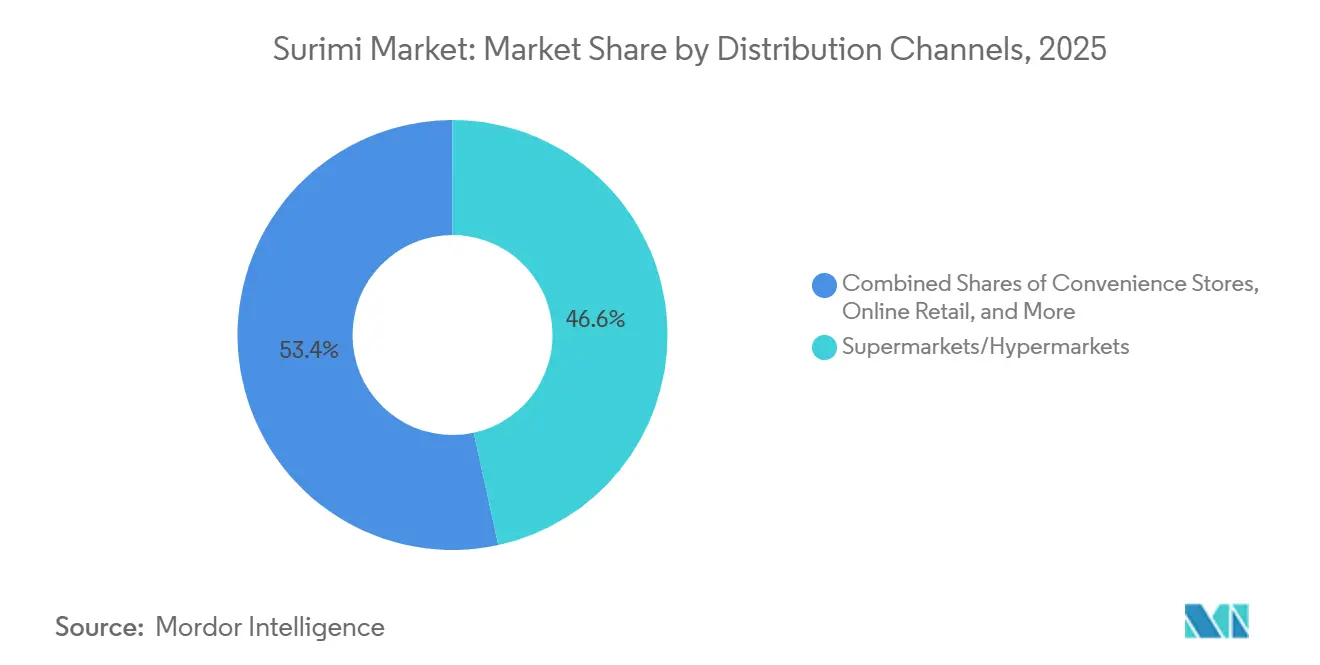
- By distribution channel, supermarkets and hypermarkets held a 46.58% share in 2025, while online retail channels are set to advance at a 6.54% CAGR through 2031.
- By geography, Asia-Pacific captured a 45.22% share in 2025, while North America recorded the highest projected CAGR at 6.43% through 2031.
Note: Market size and forecast figures in this report are generated using Mordor Intelligence’s proprietary estimation framework, updated with the latest available data and insights as of January 2026.
Global Surimi Market Trends and Insights
Drivers Impact Analysis*
| Drivers | (~) % Impact on CAGR Forecasts | Geographic Relevance | Impact Timeline |
|---|---|---|---|
| Rising Demand for Cost-Effective Protein Ingredients | +1.2% | Global, with primary concentration in Asia-Pacific and North America | Medium term (2-4 years) |
| Expansion of Ready-to-Eat Seafood Formats | +0.8% | Asia-Pacific core, growing pull in Europe and North America | Short term (≤ 2 years) |
| Growth in Cold-Chain Enabled Retail and E-Commerce | +0.7% | North America, East Asia, Western Europe | Medium term (2-4 years) |
| Broader Use of Surimi in Value-Added Food Manufacturing | +0.8% | Global, particularly ASEAN, EU, and North America | Medium term (2-4 years) |
| Sustainability Pressure Favoring Underutilized Species | +0.5% | North America and EU, spill-over to APAC | Long term (≥ 4 years) |
| Reformulation Demand for Higher-Yield and Cleaner-Label Surimi | +0.5% | EU, North America, Japan | Long term (≥ 4 years) |
| Source: Mordor Intelligence | |||
Rising Demand for Cost-Effective Protein Ingredients
The surimi market is getting stronger support from buyers who need a protein ingredient with lower procurement cost than shellfish and premium meat. Japan’s fish paste production grew 13% through the first 8 months of 2025 from a year earlier, with fried kamaboko and crab-flavored analog products driving much of the increase. The same period saw food manufacturers face higher beef and poultry input costs, which made surimi blends more attractive in convenience foods and prepared products. US frozen surimi exports to India rose in 2025 even as Japan’s import volume fell 33.8%, which showed that bulk block trade was moving toward large and cost-sensitive manufacturing markets. This pattern shows that the surimi market is moving beyond traditional seafood analog uses and becoming a broader industrial protein input where affordability is the main buying reason.
Expansion of Ready-to-Eat Seafood Formats
The surimi market is also growing with the wider shift toward convenient seafood products that need little or no preparation. In the United States, imitation crab sticks kept solid retail and online momentum through 2025 as consumers looked for lower-cost alternatives to fresh shellfish, and Vietnamese exporters saw continued opportunity in these formats. Japan’s fish paste sector recovered sharply in 2025, and output in January through November reached 360,000 metric tons, already above the full-year 2024 total of 358,000 metric tons. Product positioning is also shifting because the Japan Kamaboko Association introduced a Fish Protein Mark, while Suzuhiro Kamaboko promoted fish protein bars and alliance activity tied to sports nutrition. That combination means the surimi market is not only selling convenience and price, it is also moving into better-margin shelf positions tied to protein value and everyday snacking.
Growth in Cold-Chain Enabled Retail and E-Commerce
The surimi market is seeing new demand routes as frozen logistics improve and online grocery platforms handle more seafood products. In South Korea, where more than 10 million single-person households favor convenient meal options, e-commerce accounted for close to 30% of select frozen seafood categories in 2025, which helped support sales of surimi snacks and related products[1]Source: Norwegian Seafood Council, “NSC Forecasts Seafood's Transformative Year in 2026,” NSC 2026 Seafood Forecast, aquafeed.co.uk. China’s inland cold-chain buildout is also widening the addressable base for frozen seafood by reducing dependence on coastal distribution hubs. Vietnam’s surimi exports to the EU rose 99% in 2025, which reflected stronger cold-chain links between Southeast Asian processors and Western European retail channels. In parts of Southeast Asia, convenience chains such as 7-Eleven and Lawson are already setting detailed surimi specifications directly with processors, which shortens the route to market and speeds product turnover.
Broader Use of Surimi in Value-Added Food Manufacturing
The surimi market is moving into a wider set of prepared food applications because surimi works as a neutral and functional protein matrix. Lucky Union Foods is investing USD 50 million in a 2-phase expansion that is expected to lift annual processed surimi product output to 70,000 metric tons, with the new factory scheduled for August 2026 and revenue targeted above USD 200 million. A 2026 peer-reviewed study in Food Science and Biotechnology developed an ambient-stable surimi-based fish cake snack using continuous extrusion-retort processing, which showed that shelf-life economics can extend into channels that do not depend on frozen distribution. This matters because it opens foodservice, institutional, military, and food-aid uses that were harder to serve with frozen blocks or chilled formats. As a result, the surimi market is expanding wherever suppliers can offer specification-led ingredient systems instead of selling only commodity-style seafood analog products.
Restraints Impact Analysis*
| Restraints | (~) % Impact on CAGR Forecasts | Geographic Relevance | Impact Timeline |
|---|---|---|---|
| Raw Material Volatility in Whitefish and Tropical Species | -0.9% | Global, with acute impact in North America and Japan | Short term (≤ 2 years) |
| Tightening Sustainability Scrutiny on Fishing Practices | -0.5% | North America and EU, spill-over to APAC | Long term (≥ 4 years) |
| Rising Energy and Frozen Logistics Costs | -0.5% | Global, most acute in export-oriented ASEAN processors | Medium term (2-4 years) |
| Texture and Quality Perception Limits in Premium Applications | -0.4% | Japan, EU premium food categories, North America foodservice | Long term (≥ 4 years) |
| Source: Mordor Intelligence | |||
Raw Material Volatility in Whitefish and Tropical Species
The surimi market still faces a basic supply problem because its major raw material streams remain exposed to catch swings and pricing pressure. US Alaska pollock surimi production fell 12.6% in 2024 to 170,478 metric tons from 195,107 metric tons in 2023, and Japanese spot prices rose to USD 2,800 to USD 2,900 per metric ton by Q2 2025 after much lower levels in early 2024. Japan also kept the higher import duty on Russian pollock surimi through March 2026, which narrowed substitution choices for some buyers and kept price risk concentrated on certified supply. In tropical species, Indonesian threadfin bream AA-grade surimi was quoted at USD 1,900 to USD 2,300 per metric ton FOB in 2026, and seasonal landing swings continued to complicate procurement planning for contract manufacturers. Major Japanese processors responded with retail price increases of 2% to 10% in early 2025, which reduced margin room and weakened part of the low-cost value case that supports the surimi market
Tightening Sustainability Scrutiny on Fishing Practices
The surimi market is also under more pressure from traceability, labor, and sourcing rules across premium import markets. In May 2026, Alaska surimi producers warned that the EU CATCH harvest traceability program and its July 2026 deadline were hard to manage for onboard surimi operations, where documenting each catch event is more complex. MSC certification remains expensive for many tropical processors in Southeast Asia, which creates a clear gap between suppliers that can access premium EU and North American channels and those that mainly compete on price in mid-tier markets. Russian pollock surimi continues to add volume to the global balance, but many buyers still apply extra scrutiny because of geopolitical sourcing concerns. This means the surimi market is becoming more split between premium chains built on full auditability and lower-cost chains with thinner documentation standards.
*Our forecasts treat driver/restraint impacts as directional, not additive. The impact forecasts reflect baseline growth, mix effects, and variable interactions.
Segment Analysis
By Source: Cold Water Growth Tightens the Gap with Tropical Supply
Tropical species held 56.49% of the surimi market share in 2025, supported by Southeast Asia’s large supply of threadfin bream, nemipterids, and other low-value tropical whitefish that offer reliable gel strength at competitive processing cost. Vietnam’s fish cake and surimi exports rose above USD 344 million in 2025, up 15% from the prior year, with South Korea importing USD 83 million, China USD 54 million, and Thailand USD 46 million[2]Source: Vietnam Association of Seafood Exporters and Producers, “Global Surimi Market 2025, Expansion Opportunities for Vietnamese Exporters,” VASEP, seafood.vasep.com.vn. That trade pattern kept tropical species in a strong position because processors in Vietnam, Thailand, and Indonesia can serve both regional and export buyers with cost-efficient raw material. Tropical dominance also reflects the wide fit of these species in standard fish cakes, imitation seafood, and convenience products where value matters more than premium whitefish positioning.
Cold water species, led by Alaska pollock and supported by Pacific whiting and related species, are projected to grow at a 6.85% CAGR through 2031. Demand is strongest among Japanese and Korean buyers who want SA-grade and A-grade pollock surimi with stable texture, whiteness, and stronger sustainability credentials. Wild Alaska Pollock’s life cycle assessment showed an 18% improvement in carbon footprint for the 2024 fishing year, lowering emissions to 3.09 kg CO2e per kg protein, which supports premium procurement programs in Europe and North America. The “others” category is still small, but it is gaining attention as the surimi industry looks for underused species that can reduce dependence on the main whitefish streams. Researchers at Universitas Gadjah Mada identified Layang, Belanak, and Kembung across Indonesia’s Fisheries Management Areas as viable surimi raw materials that remain commercially underused. That leaves room for future capacity growth outside the current tropical strongholds in East Java, East Kalimantan, and Lampung.


By Form: Processed Products Expand Faster than Frozen Blocks
Frozen surimi accounted for 67.35% of the surimi market size in 2025, which reflects its role as the main commercial format in cross-border B2B trade. Buyers prefer frozen blocks because quality can be graded in a standardized way through SA, A, B, and FA specifications, and shelf life usually extends from 12 to 18 months. This makes frozen material easier to ship across Asia, Europe, and the Americas and easier to fit into large-scale manufacturing schedules. It also keeps frozen surimi at the center of contract supply, where processors and food manufacturers need consistency across batch volumes.
Processed surimi is the fastest-growing form, and this part of the surimi market size is set to rise at a 7.15% CAGR from 2026 to 2031. Lucky Union Foods’ USD 50 million expansion is a direct sign that suppliers want more downstream value from finished surimi products rather than relying only on frozen block trade. Umios Corp. also backed that shift in June 2025 with a freeze-dried, non-fried chikuwa snack that moved a traditional fish paste product into a portable and health-oriented format. Fresh surimi remains limited because its shelf life ranges from 24 to 72 hours, but it still holds premium value in Japanese restaurants and artisanal production. The new ambient-stable processing work published in 2026 suggests the surimi industry can push processed products into more retail and institutional channels without relying fully on frozen distribution
By Distribution Channel: Digital Retail Gains Ground on Store-Led Sales
Supermarkets and hypermarkets held 46.58% of global surimi market revenue in 2025, making them the main purchase point for packaged surimi and imitation seafood products in Europe, North America, and Japan. Their lead came from strong freezer space, regular household traffic, and the ability to stock both economy and premium surimi products in one channel. This format also fits the product mix of frozen blocks for home preparation, ready-to-eat sticks, and value-added seafood snacks. Even so, large store chains are no longer the only route shaping product development and market access.
Online retail channels are forecast to grow at a 6.54% CAGR from 2026 to 2031, and this route is becoming more important to the surimi market as digital grocery adoption expands. In South Korea, digital seafood sales were approaching 30% of select frozen categories in 2025, which showed that online platforms are already influencing seafood buying behavior in convenience-led households. Viciunai Group supported this shift by establishing VG Trading USA in February 2025 and then opening a Canadian subsidiary in July 2025 to tighten its access to Western retail markets. Convenience stores remain meaningful in Southeast Asia, especially where 7-Eleven and Lawson support portioned surimi snack formats and fast product turnover. Other channels such as wet markets and foodservice distributors still matter in South Asia and Southeast Asia, where traditional seafood retail structures remain important alongside newer digital routes.
Geography Analysis
Asia-Pacific captured 45.22% of the surimi market share in 2025 and remained the largest regional center for both production and demand. Japan remained the quality benchmark market, and it imported 38,334 metric tons of US Alaska pollock surimi through H1 2025 [3]Source: Genuine Alaska Pollock Producers, “2025 Q2 Base Report,” Genuine Alaska Pollock Producers, alaskapollock.org. Japan’s fish paste sector also recovered in 2025, with January through November output of 360,000 metric tons, already above the full-year 2024 total of 358,000 metric tons. China continued to widen inland frozen seafood demand through stronger cold-chain infrastructure, which shifted procurement beyond coastal markets. Vietnam added to the region’s strength with surimi and fish cake exports of USD 344 million in 2025, and January 2026 exports reached USD 32 million, up 20% from January 2025.
North America is the fastest-growing regional block, and the regional surimi market size is projected to rise at a 6.43% CAGR through 2031. The region shows a split between tight supply and improving retail demand. US frozen surimi block exports fell 10% in 2025 to 145,000 metric tons, which was the lowest level since 2011, as Japan cut purchases and Russian pollock gained a position in some mid-tier uses. At the same time, imitation crab sticks and surimi snack products kept gaining shelf presence because they remained cheaper than fresh shellfish. Trident Seafoods’ April 2026 acquisition of a surimi processing plant showed that producers still see value in tighter control over Alaska-based capacity. EU CATCH traceability rules with a July 2026 deadline added compliance pressure for exporters while also strengthening the position of certified supply chains in premium retail.
Europe, South America, and the Middle East and Africa form smaller but important growth corridors for the surimi market. In Europe, Spain’s imports of US Alaska pollock surimi more than doubled in H1 2025, and Vietnam’s EU-directed surimi shipments rose 99% in 2025, which pointed to stronger demand for frozen and convenience-oriented products. In South America, Brazil’s labeling framework requiring clear surimi content disclosure supports product transparency as processed seafood use widens. In the Middle East and Africa, halal certification is becoming a useful access route, and Sugiyo was targeting mid-2026 certification for its crab-stick plant to support export entry into Southeast Asian and Middle Eastern channels.

Competitive Landscape
The surimi market has a semi-consolidated structure where a small group of Japanese leaders sets many of the quality and formulation standards, while a larger group of Southeast Asian and South Asian suppliers competes on raw material cost and export pricing. Umios Corp., Nissui, and Kibun Foods remain important reference points because buyers often look to Japanese processors for grade consistency, product performance, and finished product development. Umios Corp.’s March 2025 management plan committed JPY 140 billion in growth investments through FY2028, including North American surimi crab-stick expansion and a strategic alliance with Kibun Foods, which showed a clear push toward higher-value downstream positions. By May 2026, Umios was targeting a third straight record operating profit of USD 206 million for the fiscal year ending March 2027, with Thailand and Europe supporting growth.
Strategic moves in the surimi market increasingly show a split between firms investing in value-added capacity and firms reshaping their geographic exposure. Trident Seafoods’ April 2026 plant acquisition strengthened vertical integration in Alaska pollock surimi at a time when US exports were under pressure. Viciunai Group also reworked its footprint by finalizing a EUR 100 million sale of Russian and Eastern European operations in June 2025, or USD 114 million, and redirecting capital toward Western-facing processing growth. Lucky Union Foods made one of the clearest growth bets with its USD 50 million expansion aimed at 70,000 metric tons of annual output and revenue above USD 200 million. At the same time, product white space is opening in ambient-stable surimi formats and in cleaner-label formulations that use ingredients such as specialty potato proteins instead of phosphate-heavy systems.
Smaller exporters still matter because the surimi market does not behave like a tightly locked oligopoly. Vietnam had more than 50 companies exporting surimi, and the top 3 accounted for 39% of national export value, which showed concentration at the country level but not dominance across the full global market. EU CATCH documentation and MSC chain-of-custody rules are becoming practical gatekeepers in premium channels, and they give certified suppliers a better chance to win share from processors that struggle with compliance. Overall, the surimi market remains competitive enough that scale matters, but certification, formulation capability, and channel reach now do just as much to shape supplier position as raw fish access.
Surimi Industry Leaders
Starfish Co., Ltd.
MEENA Brand Surimi
Thai Union Group PCL
Trident Seafoods Corporation
Java Seafood
- *Disclaimer: Major Players sorted in no particular order

Recent Industry Developments
- May 2026: Lucky Union Foods (Thai Union Group JV with LF Food Corp. and CJ CheilJedang) confirmed its new surimi processing factory will come online in August 2026 as part of a USD 50 million two-phase expansion targeting 70,000 metric tons annual output and revenue exceeding USD 200 million.
- May 2026: The Association of Genuine Alaska Pollock Producers (GAPP) announced plans to strengthen the presence of Wild Alaska Pollock surimi in India, recognizing the country as a high-potential growth market for value-added seafood products.
- June 2025: Maruha Nichiro launched a new range of freeze-dried, non-fried surimi-based snacks, transforming traditional fish paste products into convenient, high-protein snack offerings aimed at health-conscious consumers. The innovation leverages freeze-drying technology to deliver a crispy texture without deep frying, aligning with growing demand for nutritious, low-fat, and ready-to-eat snack products.


Global Surimi Market Report Scope
| Tropical |
| Cold Water |
| Alaska Pollock |
| Others |
| Fresh |
| Frozen |
| Processed |
| Supermarkets/Hypermarkets |
| Convenience Stores |
| Online Channels |
| Other Distribution channels |
| North America | United States |
| Canada | |
| Mexico | |
| Rest of North America | |
| Europe | Germany |
| United Kingdom | |
| France | |
| Italy | |
| Spain | |
| Netherlands | |
| Sweden | |
| Poland | |
| Belgium | |
| Rest of Europe | |
| Asia-Pacific | China |
| India | |
| Japan | |
| Australia | |
| South Korea | |
| Vietnam | |
| Indonesia | |
| Thailand | |
| Singapore | |
| Rest of Asia-Pacific | |
| South America | Brazil |
| Argentina | |
| Chile | |
| Peru | |
| Colombia | |
| Rest of South America | |
| Middle East and Africa | United Arab Emirates |
| Saudi Arabia | |
| South Africa | |
| Nigeria | |
| Egypt | |
| Morocco | |
| Turkey | |
| Rest of Middle East and Africa |
| By Source | Tropical | |
| Cold Water | ||
| Alaska Pollock | ||
| Others | ||
| By Form | Fresh | |
| Frozen | ||
| Processed | ||
| By Distribution Channels | Supermarkets/Hypermarkets | |
| Convenience Stores | ||
| Online Channels | ||
| Other Distribution channels | ||
| By Geography | North America | United States |
| Canada | ||
| Mexico | ||
| Rest of North America | ||
| Europe | Germany | |
| United Kingdom | ||
| France | ||
| Italy | ||
| Spain | ||
| Netherlands | ||
| Sweden | ||
| Poland | ||
| Belgium | ||
| Rest of Europe | ||
| Asia-Pacific | China | |
| India | ||
| Japan | ||
| Australia | ||
| South Korea | ||
| Vietnam | ||
| Indonesia | ||
| Thailand | ||
| Singapore | ||
| Rest of Asia-Pacific | ||
| South America | Brazil | |
| Argentina | ||
| Chile | ||
| Peru | ||
| Colombia | ||
| Rest of South America | ||
| Middle East and Africa | United Arab Emirates | |
| Saudi Arabia | ||
| South Africa | ||
| Nigeria | ||
| Egypt | ||
| Morocco | ||
| Turkey | ||
| Rest of Middle East and Africa | ||


Key Questions Answered in the Report
What is the expected value of the surimi market by 2031?
The surimi market is forecast to reach USD 8.02 billion by 2031, rising from USD 6.14 billion in 2026 at a 5.49% CAGR over 2026-2031.
Which source type is growing fastest in surimi products?
Cold water species are the fastest-growing source segment, with a projected 6.85% CAGR through 2031, even though tropical species remained the largest in 2025.
Why are processed surimi products growing faster than frozen blocks?
Processed surimi is growing faster because producers are pushing into finished seafood analogs, snacks, and convenience foods, and the segment is forecast to grow at 7.15% CAGR through 2031.
What is driving online sales of surimi-based products?
Better cold-chain coverage and digital grocery adoption are expanding online sales, and in South Korea digital channels were approaching 30% of select frozen seafood categories in 2025.
Page last updated on:


