Propolis Market Size and Share
Market Overview
| Study Period | 2021 - 2031 |
|---|---|
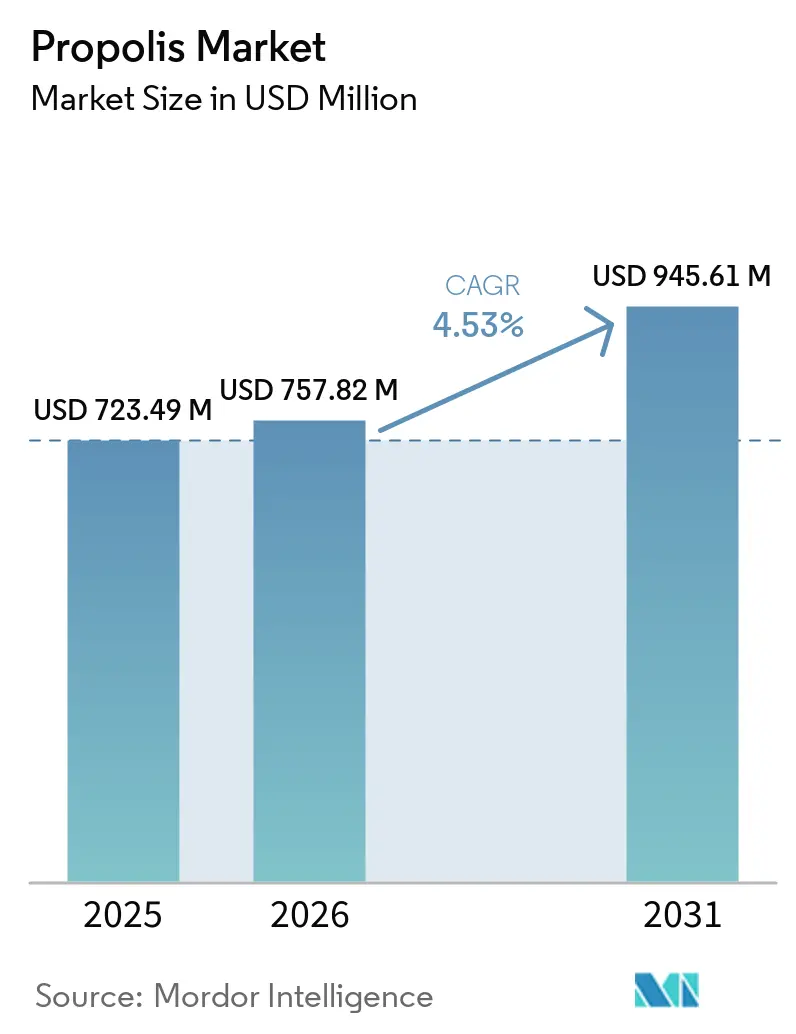
| Market Size (2026) | USD 757.82 Million |
| Market Size (2031) | USD 945.61 Million |
| Growth Rate (2026 - 2031) | 4.53% CAGR |
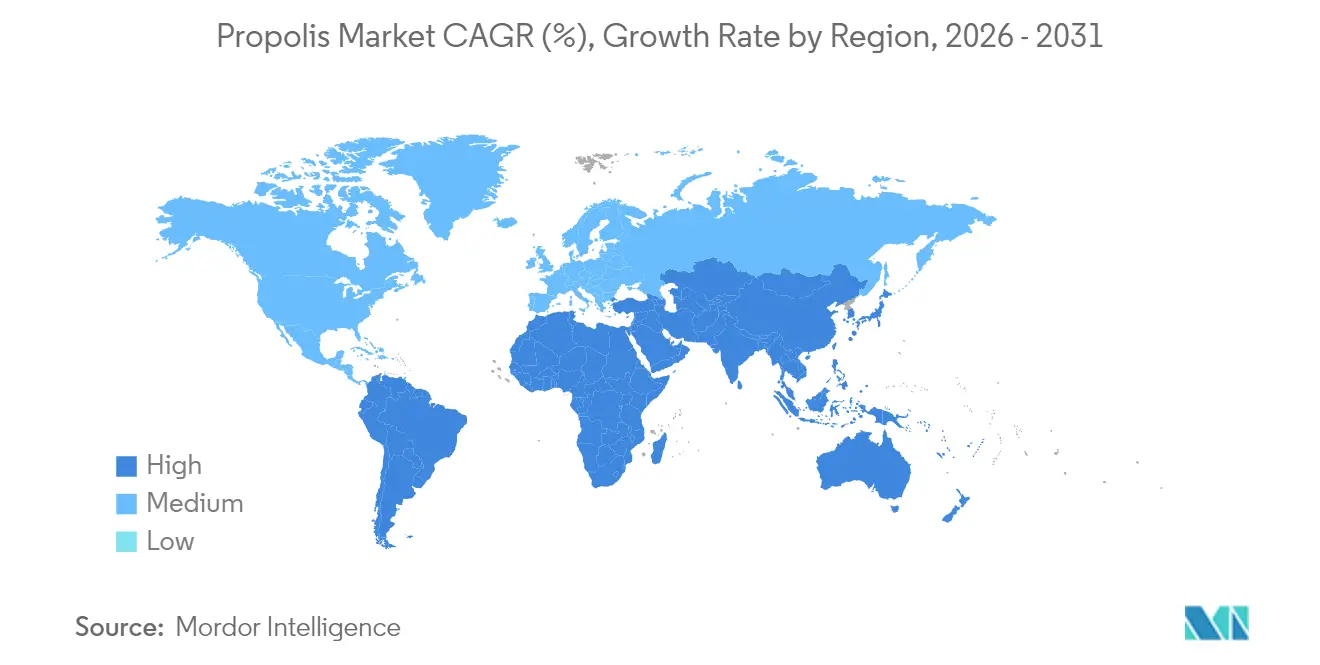
| Fastest Growing Market | South America |
| Largest Market | Asia Pacific |
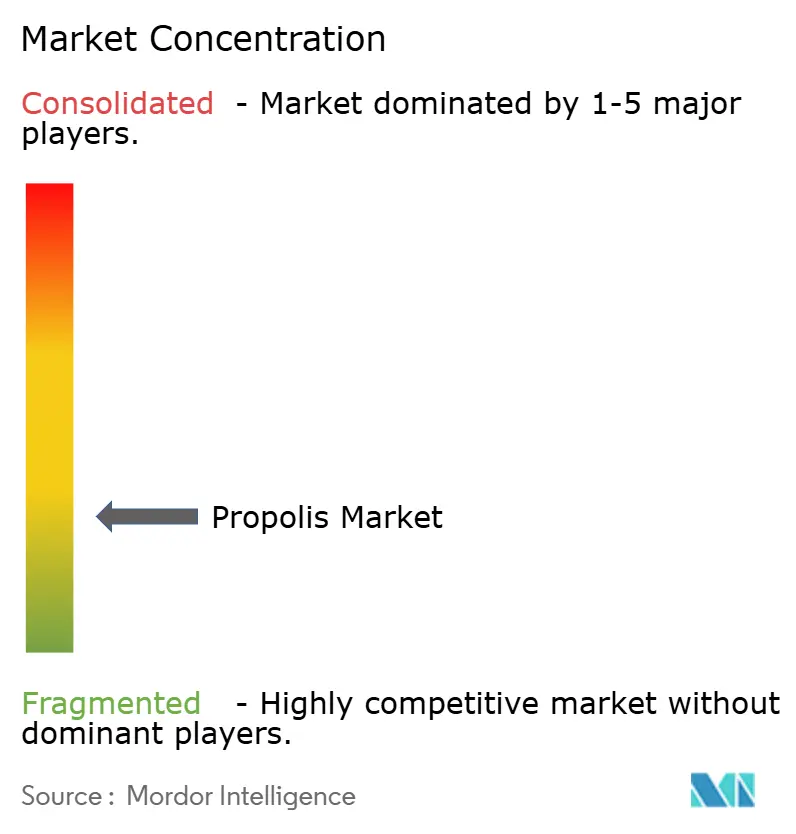
| Market Concentration | Low |
Major Players
*Disclaimer: Major Players sorted in no particular order Image © Mordor Intelligence. Reuse requires attribution under CC BY 4.0. |
|
Propolis Market Analysis by Mordor Intelligence
The propolis market size is projected to expand from USD 723.49 million in 2025 and USD 757.82 million in 2026 to USD 945.61 million by 2031, registering a CAGR of 4.53% between 2026 to 2031. Heightened consumer interest in plant-derived immunity support, coupled with growing skepticism toward synthetic preservatives, is steering formulators toward bioactive propolis extract as a multifunctional antimicrobial and antioxidant. Capsules remain the dominant dosage form, yet sprays and other liquid presentations are capturing share as users seek convenient throat-health solutions. Clean-label mandates and third-party certification programs are accelerating demand for organic propolis, even as regulatory agencies hold a conservative stance on health-claim substantiation. Digital-first brands are reshaping the propolis market narrative by pairing standardized extracts with influencer-driven storytelling and direct-to-consumer logistics.
Key Report Takeaways
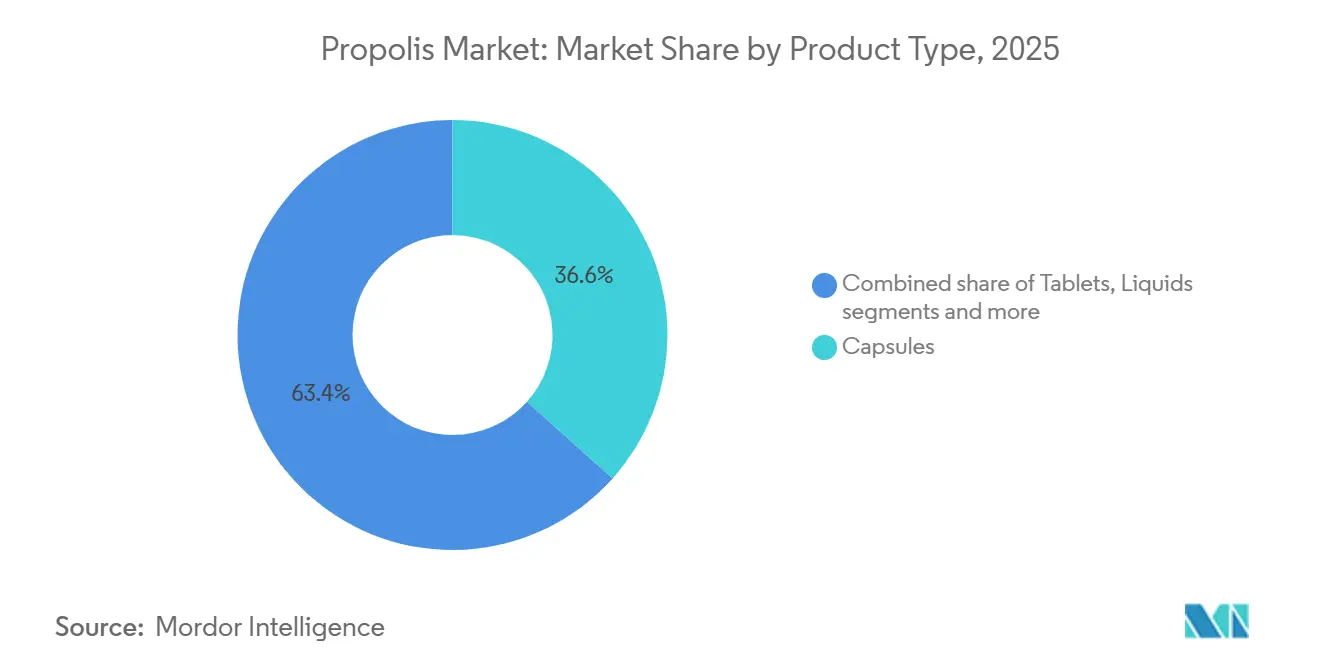
- By product type, capsules captured 36.62% of the 2025 propolis market share, whereas liquids are forecast to advance at a 5.50% CAGR through 2031.
- By category, conventional grades held 82.74% of the 2025 propolis market size, while organic variants are expanding at a 6.11% CAGR.
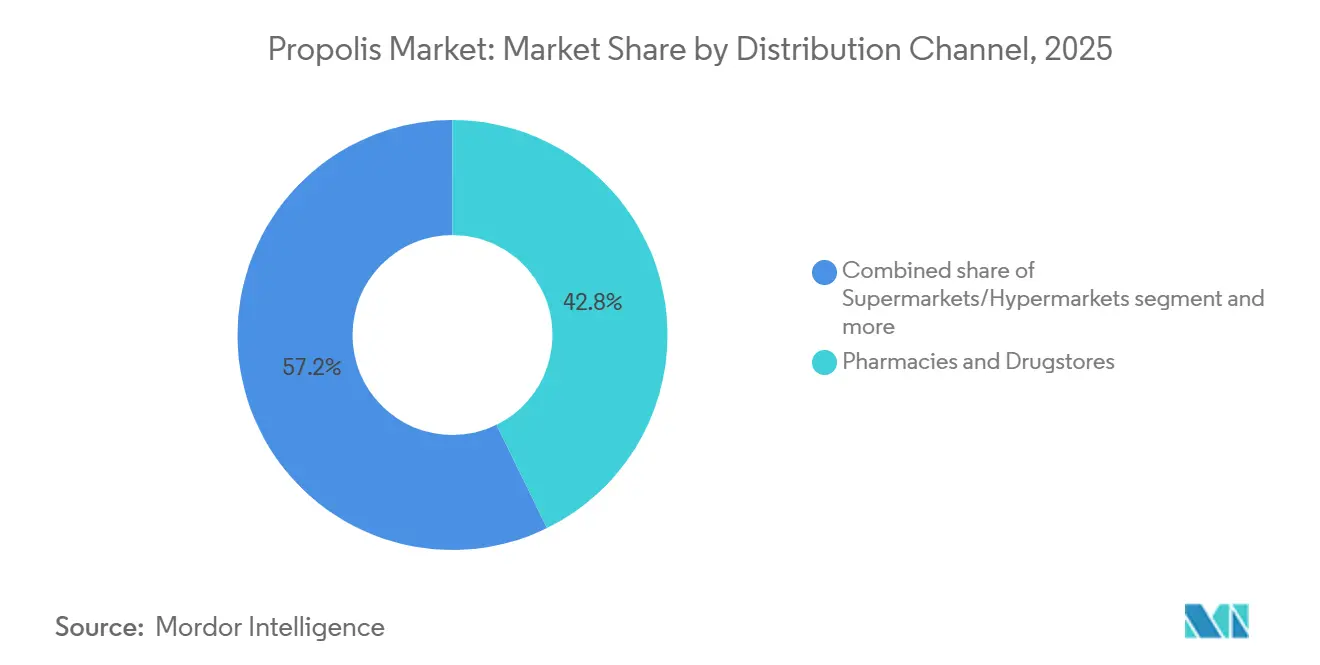
- By distribution channel, pharmacies and drugstores led distribution with 42.71% of 2025 revenue, but online retail is rising at a 6.92% CAGR.
- By geography, Asia-Pacific dominated with 33.43% of 2025 revenue, whereas South America is set to post the fastest 6.52% CAGR to 2031.
Note: Market size and forecast figures in this report are generated using Mordor Intelligence’s proprietary estimation framework, updated with the latest available data and insights as of 2026.
Global Propolis Market Trends and Insights
Drivers Impact Analysis*
| Driver | (~) % Impact on CAGR Forecast | Geographic Relevance | Impact Timeline |
|---|---|---|---|
| Rising demand for natural immunity-boosting products | +1.2% | Global, with concentration in North America, Europe, and the Asia-Pacific | Medium term (2-4 years) |
| Increasing product launches in the functional food space | +0.9% | North America, Europe, Asia-Pacific | Short term (≤ 2 years) |
| Influencer marketing boosts awareness of propolis benefits | +0.7% | Global, led by North America and Europe, among Gen Z and millennial cohorts | Short term (≤ 2 years) |
| Propolis is recognized as a natural antibiotic alternative globally | +0.8% | Global, with regulatory traction in South America (Argentina Food Code inclusion) | Long term (≥ 4 years) |
| Increasing use in natural skincare and cosmetics | +0.6% | Europe, North America, Asia-Pacific premium segments | Medium term (2-4 years) |
| Consumer shift toward clean label ingredients | +0.9% | Global, strongest in North America and Europe | Medium term (2-4 years) |
| Source: Mordor Intelligence | |||


Rising demand for natural immunity-boosting products
Post-pandemic, consumers have increasingly prioritized preventive health measures. This shift has propelled propolis, once a niche ingredient in apitherapy, into the spotlight as a mainstream immunity supplement. A clinical study in 2025 highlighted the efficacy of Promunel, a standardized propolis extract. Developed by Fytexia and marketed by PLT Health Solutions, the study found a notable 31% decrease in respiratory discomfort over a span of 90 days. Such quantifiable results offer formulators a solid foundation for product claims[1]Source: Fytexia Research Team, “Promunel Clinical Outcomes,” MDPI, mdpi.com . However, this finding stands in stark contrast to the European Food Safety Authority's (EFSA) dismissal of health claims associated with propolis, highlighting a clear regulatory divide between the transatlantic regions. While EFSA maintains stringent substantiation standards, North American and Asian markets have been more lenient. As a result, these regions have seamlessly integrated propolis into multivitamin combinations and immune-boosting regimens. The appeal of propolis, especially its polyphenol and flavonoid content like artepillin C found in Brazilian green propolis, is evident. Consumers are increasingly gravitating towards it as a natural alternative to synthetic immunomodulators, even as the scientific community continues to explore the nuances of its dose-response relationships.
Increasing product launches in the functional food space
In 2024 and 2025, the pace of product innovation quickened, introducing a range of offerings from capsules and sprays to liquid concentrates. Life Extension's December 2025 debut of Bee Immune Propolis Capsules, standardized to 12% polyphenols, highlights a trend towards biomarker-driven formulations. In November 2025, Beekeeper's Naturals rolled out its Propolis Throat Soother spray in major retail outlets like Target, Walmart, and Whole Foods, capitalizing on the growing demand for convenient, on-the-go wellness solutions. Vimergy, in July 2024, unveiled its USDA Organic Liquid PropolisPure, boasting 1,220 mg of the PROMUNEL standardized extract in every 2 mL serving[2]Source: Vimergy, "Vimergy's USDA Organic Liquid PropolisPure Launch", vimergy.com . They also adopted a direct-to-consumer subscription model, offering 5% discounts to ensure steady revenue. These product launches indicate a strategic shift from traditional bulk raw propolis to more refined, standardized formats. These new offerings not only command higher prices but also promise consistency in formulation. This evolution aligns with broader trends in the nutraceutical sector, where brands are increasingly emphasizing clinical validation, third-party endorsements, and transparent supply chain stories to set themselves apart.
Influencer marketing boosts awareness of propolis benefits
Social media platforms have become the go-to channels for health information, especially among Generation Z, with many turning to TikTok for wellness advice. Beekeeper's Naturals has tapped into this trend, garnering 42,900 followers on TikTok. They've shared educational content highlighting the benefits of bee propolis, alongside user testimonials and transformation stories. This approach sidesteps traditional media gatekeepers, allowing brands to cultivate communities and boost direct sales. Yet, a significant portion of videos tagged with top health hashtags are riddled with inaccuracies, raising consumer concerns about misleading claims. This presents a strategic dilemma: while influencer marketing can rapidly elevate brand awareness, it also draws the attention of regulators. This is underscored by several FDA warning letters sent to propolis sellers for making unapproved claims related to COVID-19.
Propolis recognized as a natural antibiotic alternative globally
Propolis, celebrated for its potent antimicrobial properties against bacteria, fungi, and viruses, is now being explored for applications beyond dietary supplements. A 2024 study underscored the efficacy of oromucosal sprays infused with propolis, revealing notable inhibition zones of 28.1 mm against Candida albicans and 26.2 mm against Staphylococcus aureus. These results suggest propolis could play a pivotal role in oral health and wound care. In real-world scenarios, propolis not only soothes pain from oral ulcers but also disinfects infected wounds within 3 to 6 days. Moreover, it has shown potential in alleviating mucositis caused by radiotherapy and chemotherapy. On the regulatory front, Argentina integrated propolis into its Food Code in May 2008, establishing quality standards through norms IRAM-INTA 15935-1 and -2. This move could signal future global harmonization efforts.
Restraints Impact Analysis*
| Restraint | (~) % Impact on CAGR Forecast | Geographic Relevance | Impact Timeline |
|---|---|---|---|
| Allergen concerns limit use among sensitive consumers | -0.5% | Global, with a higher incidence in Europe and North America | Short term (≤ 2 years) |
| High product prices restrict mass market growth | -0.6% | Price-sensitive markets in South America, Southeast Asia, and Africa | Medium term (2-4 years) |
| Limited scientific validation reduces mainstream acceptance | -0.4% | Europe (EFSA jurisdiction), North America (FDA scrutiny) | Long term (≥ 4 years) |
| Contamination risks (pesticide residues, heavy metals, environmental pollutants) | -0.7% | Global, acute in regions with intensive agriculture (China, Brazil, Eastern Europe) | Medium term (2-4 years) |
| Source: Mordor Intelligence | |||
Allergen concerns limit use among sensitive consumers
Allergic reactions to propolis, ranging from contact dermatitis to severe anaphylaxis, hinder its widespread acceptance in the wellness industry. Caffeic acid phenethyl ester (CAPE), a bioactive compound prevalent in propolis, has been pinpointed as the main allergen triggering these sensitivities. Reports highlight significant skin reactions among beekeepers and consumers using propolis-infused topicals. As a precaution, dermatologists now advocate for patch testing prior to regular application. The challenge of allergenicity is intensified by the diverse compositions of propolis. Varieties sourced from Brazilian green (Baccharis dracunculifolia), red (Dalbergia ecastaphyllum), European poplar, and Pacific Macaranga tanarius each boast unique phytochemical profiles, complicating predictions of cross-reactivity. Lemon Pharma's Apropolis Liquid Spray, exclusively derived from South American poplar, eucalyptus, acacia, and pine, claims to be less allergenic than its European counterparts. This move underscores suppliers' efforts to reduce risk by emphasizing origin differences. Yet, despite these precautions, the lack of standardized allergen-testing methods and the absence of mandatory allergen labeling in numerous regions expose consumers to risks. This vulnerability is especially pronounced in e-commerce platforms, where product details can often be scant.
High product prices restrict mass market growth
Propolis prices are shaped by supply limitations, intricate processing, and strategies aimed at premium positioning. At iHerb, propolis prices span from USD 5.95 for standard tinctures to a steep USD 96.87 for niche formulations. Notable bestsellers include California Gold Nutrition's Bee Propolis at USD 9.67 and NOW Foods' Propolis 1500, fetching USD 13.34. Brazilian green propolis, celebrated for its artepillin C richness, outprices its European poplar counterparts, establishing a dual-tier market. Using a 70% ethanol maceration method, a 5-day extraction recovers ~80% of polyphenols. Further re-extractions can garner an extra 23% on the second try and 6% on the third, though these come with added labor and solvent expenses. Price fluctuations arise from seasonal variations in hive health and forage availability. Comvita's fiscal 2025 report highlighted a 7.2% dip in hive count to 15,983 and a staggering 69.7% fall in bee value, now at NZD 1.3 million (USD 0.78 million). Such apicultural hurdles directly impact profit margins. In regions like Southeast Asia, sub-Saharan Africa, and rural South America, where price sensitivity prevails, these factors confine propolis consumption to wealthier urbanites, curbing volume growth and cementing its niche market status.
*Our forecasts treat driver/restraint impacts as directional, not additive. The impact forecasts reflect baseline growth, mix effects, and variable interactions.
Segment Analysis
By Product Type: Liquid Formats Outpace Capsules on Convenience and Bioavailability
Spray and liquid propolis formats are projected to grow at a 5.50% CAGR through 2031, outpacing capsules, which held a 36.62% market share in 2025. This shift is driven by convenience: throat sprays deliver propolis directly to mucous membranes, bypassing first-pass metabolism and providing swift relief for sore throats and oral discomfort. Beekeeper's Naturals Propolis Throat Soother spray, launched in November 2025 at Target, Walmart, and Whole Foods, highlights the category's retail appeal[3]Source: Beekeeper’s Naturals, “Product Specifications and Retail Expansion,” BeekeepersNaturals.com, beekeepersnaturals.com . Lemon Pharma's Apropolis Liquid Spray, with 4% propolis extract sourced from South American botanicals to reduce allergenicity, is gaining traction. Vimergy's USDA Organic Liquid PropolisPure, introduced in July 2024, offers 1,220 mg of PROMUNEL standardized extract per 2 mL serving and uses a direct-to-consumer subscription model with a 5% discount to drive recurring revenue. Capsules remain dominant in the preventive-health segment, where daily dosing consistency outweighs rapid relief. Life Extension's Bee Immune Propolis Capsules, standardized to 12% polyphenols and launched in December 2025, cater to this demand. Tablets and creams serve niche uses, such as chewables for children and topicals for skin conditions, but lack the growth momentum of liquids.
Nanoencapsulation technologies are transforming bioavailability. Propolis flavonoids face less than 10% oral bioavailability due to poor water solubility and rapid hepatic metabolism. Liposomal and nanoemulsion delivery systems improve absorption, supporting premium pricing. Consumer feedback is mixed: 45.7% praised "tasty flavors," while 55.4% cited "unpleasant taste," emphasizing the need for palatability in liquid formats. Brands excelling in taste-masking, through honey blends, essential oils, or flavor encapsulation, are well-positioned to capture the 5.50% CAGR growth in liquid propolis.


By Category: Organic Propolis Gains Share as Clean-Label Demand Intensifies
As consumers increasingly prioritize pesticide-free sourcing and third-party certifications, organic propolis is witnessing a robust acceleration at a 6.11% CAGR. While conventional propolis is set to capture 82.74% of the 2025 revenue, thanks to established supply chains and cost advantages, the upward trajectory of organic propolis hints at a significant structural shift in the market. YS Organic Bee Farms, a trailblazer in certified organic beekeeping in North America since 1985 and certified in 1995, proudly markets Propolis 1000 capsules and tincture sprays, underscoring the maturation of the organic category. In July 2024, Vimergy introduced its USDA Organic Liquid PropolisPure, catering to health-conscious consumers ready to invest in premium, transparently sourced products.
Despite the momentum, organic propolis faces challenges: certification costs and supply constraints act as brakes on its expansion. While USDA organic beekeeping standards allow the use of formic and oxalic acids for Varroa mite control, they strictly prohibit synthetic pesticides, necessitating buffer zones and pesticide-free forage. Additionally, the European Union's regulations introduce another layer of complexity, requiring Novel Food assessments for botanicals without a consumption history prior to 1997. Yet, amidst these challenges, a significant portion of consumers place a premium on third-party certifications and plant-based supplements, establishing a solid demand base for organic propolis. In contrast, conventional propolis continues to dominate in price-sensitive regions like Southeast Asia and sub-Saharan Africa, where affordability takes precedence over certification. Brands operating in this divided landscape face the challenge of expanding margins in the organic segment while retaining volume in the conventional one, necessitating a nuanced approach with targeted marketing and adaptable supply chains.
By Distribution Channel: Online Retail Disrupts Pharmacy Dominance with DTC Models
In 2025, pharmacies and drugstores accounted for 42.71% of the distribution, leveraging professional endorsements and impulse buys. Online retail channels, however, surged with a 6.92% CAGR projected through 2031. E-commerce platforms like iHerb highlighted digital demand for bee products, listing 61 out of 177 total stock-keeping units (SKUs) for propolis. Top sellers included California Gold Nutrition's Bee Propolis, NOW Foods' Propolis, and Beekeeper's Naturals' Propolis Immune Support spray. To address quality concerns in online supplement sales, iHerb's iTested program collaborates with third-party laboratories like ABC Testing, Eurofins, and Alkemist to validate label claims. Direct-to-consumer models are proving lucrative: Vimergy offers a subscription with a 5% discount, and Mix+Save bundle promotions ensure steady revenue. Free shipping on orders over USD 85 also curbs cart abandonment.
According to the National Institutes of Health, Tmall and JD.com dominate supplement purchases in China's growing nutraceutical market, especially among buyers aged 26 to 45. In Japan, non-store channels, mail orders, online platforms, and TV shopping secure a significant share of dietary supplement sales, with consumers prioritizing safety, traceability, and smaller pack sizes. Supermarkets and hypermarkets act as discovery hubs, showcasing promotional displays and cross-merchandising with honey and royal jelly to encourage trials, but lack the assortment depth and personalized recommendations of online platforms. Niche segments rely on health-food stores, direct sales, and practitioner dispensaries, though these channels face margin pressures from online disintermediation. Brands adopting an omnichannel approach, leveraging pharmacy presence for credibility, e-commerce for ease, and subscriptions for retention, are positioned to outperform single-channel competitors.
Geography Analysis
Asia-Pacific dominates with a 33.43% market share in 2025 as consumers integrate traditional medicine practices and prioritize health awareness. China leads the regional market, though Comvita experienced a 17.6% revenue decline in Chinese markets during 2024. India targets mass market distribution while Japan focuses on premium segments, creating distinct growth pathways. The region's strong apiculture foundation and cultural acceptance drive market growth, though companies face challenges navigating varied regulations across countries.
South America drives market expansion at a 6.52% CAGR through 2031, with Brazil leading propolis production and processing. Brazilian producers create premium-grade propolis, valued for its unique chemical properties and health benefits. The region strengthens its position through enhanced export capabilities and trade agreements. Argentina offers growth opportunities despite economic challenges affecting market stability. Sustainable production practices and diverse propolis varieties give South American producers a competitive edge.
North America and Europe shape market standards through strict regulations and premium positioning. These regions grow through product innovations and increased market reach. European regulators now require apiculture importers to register in the EU's Trade Control and Expert System, benefiting established companies. North American consumers readily accept premium prices for scientifically-proven products, supported by healthcare professionals. The Middle East and Africa show growth potential as economic development increases, though limited infrastructure and developing regulations currently restrict market expansion.

Competitive Landscape
The propolis market demonstrates significant fragmentation with multiple companies operating across regions. This structure enables both established companies and new entrants to gain market share through product innovation and strategic positioning. The fragmentation stems from varying regional preferences, regulatory frameworks, and quality standards, preventing market dominance by any single company. Major companies in the propolis market include Comvita Ltd, Apiary Polenecter, Apis Flora Industrial e Comercial Ltda (Apis Flora), and NOW Foods. Competition intensity varies across regions and applications, with the skincare and oral care segments experiencing increased pressure for innovation in product formulations and delivery systems.
Companies are differentiating themselves through technological advancement, particularly in extraction methods. The adoption of supercritical CO2 extraction offers higher purity and environmental benefits compared to traditional solvent-based processes. Opportunities exist in standardized clinical applications, where regulatory approvals could provide competitive advantages for companies investing in clinical validation.
New market entrants are implementing direct-to-consumer models and digital marketing strategies to circumvent traditional distribution networks. Established companies maintain focus on healthcare practitioner education and retail partnerships. The market's fragmented nature suggests potential consolidation as regulatory requirements increase and smaller companies face challenges with compliance costs and quality standardization.
Propolis Industry Leaders
-
Comvita Ltd
-
Apiary Polenecter
-
Apis Flora Industrial e Comercial Ltda (Apis Flora)
-
NOW Foods
-
Herb Pharm LLC
- *Disclaimer: Major Players sorted in no particular order

Recent Industry Developments
- January 2026: Life Extension launched Bee Immune Propolis Capsules, standardized to 12 percent polyphenols, targeting the preventive-health segment with quantifiable bioactive levels that enable clinical substantiation and differentiation in a crowded supplement market.
- November 2025: Beekeeper's Naturals introduced Propolis Throat Soother spray across Target, Walmart, and Whole Foods, leveraging mass-retail distribution to capture on-the-go wellness demand and amplify brand visibility through TikTok's 42,900 followers.
- February 2025: PT Phytochemindo Reksa introduced Propolisul, a propolis-based product derived from stingless bees in Sulawesi. The product contains two newly identified bioactive compounds, Sulawesin A and Sulawesin B. This product is available through online platforms, including Shopee and Tokopedia.


Global Propolis Market Report Scope
Propolis or bee glue is a resinous mixture that honey bees produce by mixing saliva and beeswax with exudate gathered from tree buds, sap flows, or other botanical sources. The propolis market is segmented by product type, category, distribution channel, and geography. By product type, the market is segmented into capsules and tablets, liquids, creams, and other product types. By category, the market is segmented into conventional and organic. Based on the distribution channel, the market is segmented into supermarkets/hypermarkets, pharmacies and drugstores, online retail stores, and other distribution channels. Also, the report provides global insights into the propolis market across major economies in North America, Europe, Asia-Pacific, South America, the Middle East and Africa. The market sizing has been done in USD value terms for all the aforementioned segments.
| Capsules |
| Tablets |
| Liquids |
| Creams |
| Others |
| Conventional |
| Organic |
| Supermarkets/Hypermarkets |
| Pharmacies and Drugstores |
| Online Retail Stores |
| Other Distribution Channels |
| North America | United States |
| Canada | |
| Mexico | |
| Rest of North America | |
| Europe | United Kingdom |
| Germany | |
| France | |
| Italy | |
| Spain | |
| Sweden | |
| Belgium | |
| Poland | |
| Netherlands | |
| Rest of Europe | |
| Asia-Pacific | China |
| Japan | |
| India | |
| Thailand | |
| Singapore | |
| South Korea | |
| Australia | |
| New Zealand | |
| Rest of Asia Pacific | |
| South America | Brazil |
| Argentina | |
| Colombia | |
| Chile | |
| Peru | |
| Rest of South America | |
| Middle East and Africa | United Arab Emirates |
| Saudi Arabia | |
| Qatar | |
| Turkey | |
| South Africa | |
| Nigeria | |
| Egypt | |
| Morocco | |
| Rest of Middle East and Africa |
| Product Type | Capsules | |
| Tablets | ||
| Liquids | ||
| Creams | ||
| Others | ||
| Category | Conventional | |
| Organic | ||
| Distribution Channel | Supermarkets/Hypermarkets | |
| Pharmacies and Drugstores | ||
| Online Retail Stores | ||
| Other Distribution Channels | ||
| Geography | North America | United States |
| Canada | ||
| Mexico | ||
| Rest of North America | ||
| Europe | United Kingdom | |
| Germany | ||
| France | ||
| Italy | ||
| Spain | ||
| Sweden | ||
| Belgium | ||
| Poland | ||
| Netherlands | ||
| Rest of Europe | ||
| Asia-Pacific | China | |
| Japan | ||
| India | ||
| Thailand | ||
| Singapore | ||
| South Korea | ||
| Australia | ||
| New Zealand | ||
| Rest of Asia Pacific | ||
| South America | Brazil | |
| Argentina | ||
| Colombia | ||
| Chile | ||
| Peru | ||
| Rest of South America | ||
| Middle East and Africa | United Arab Emirates | |
| Saudi Arabia | ||
| Qatar | ||
| Turkey | ||
| South Africa | ||
| Nigeria | ||
| Egypt | ||
| Morocco | ||
| Rest of Middle East and Africa | ||


Key Questions Answered in the Report
What is the projected value of the propolis market by 2031?
The propolis market is forecast to reach USD 945.61 million by 2031, driven by a 4.53% CAGR from 2026 to 2031.
Which region is growing fastest for propolis products?
South America leads with a projected 6.52% CAGR through 2031 thanks to Brazil’s large organic beekeeping base and Argentina’s Monte propolis exports.
Why are liquid sprays gaining traction over capsules?
Sprays deliver propolis directly to throat tissues, improving bioavailability and convenience, and are expanding at a 5.50% CAGR.
How significant is organic certification in consumer purchase decisions?
Organic propolis is growing 6.11% annually as consumers favor third-party certifications for purity assurance.
Page last updated on:


