
Nisin Market Size and Share
Market Overview
| Study Period | 2021 - 2031 |
|---|---|
| Market Size (2026) | USD 579.27 Million |
| Market Size (2031) | USD 740.72 Million |
| Growth Rate (2026 - 2031) | 5.04 % |
| Fastest Growing Market | Asia Pacific |
| Largest Market | North America |
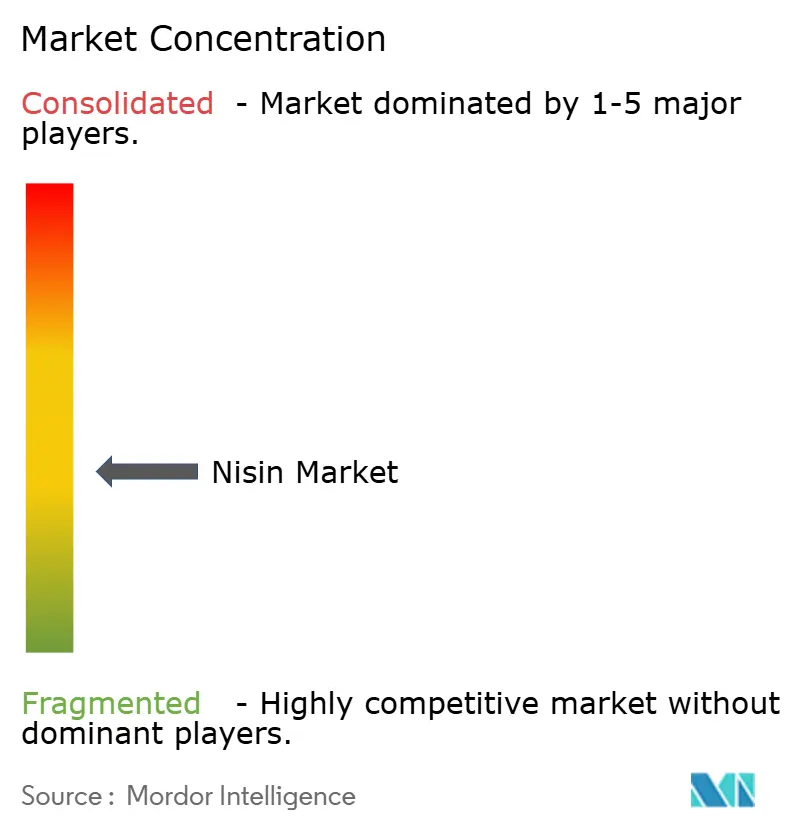
| Market Concentration | Medium |
Major Players *Disclaimer: Major Players sorted in no particular order Image © Mordor Intelligence. Reuse requires attribution under CC BY 4.0. | |
Nisin Market Analysis by Mordor Intelligence
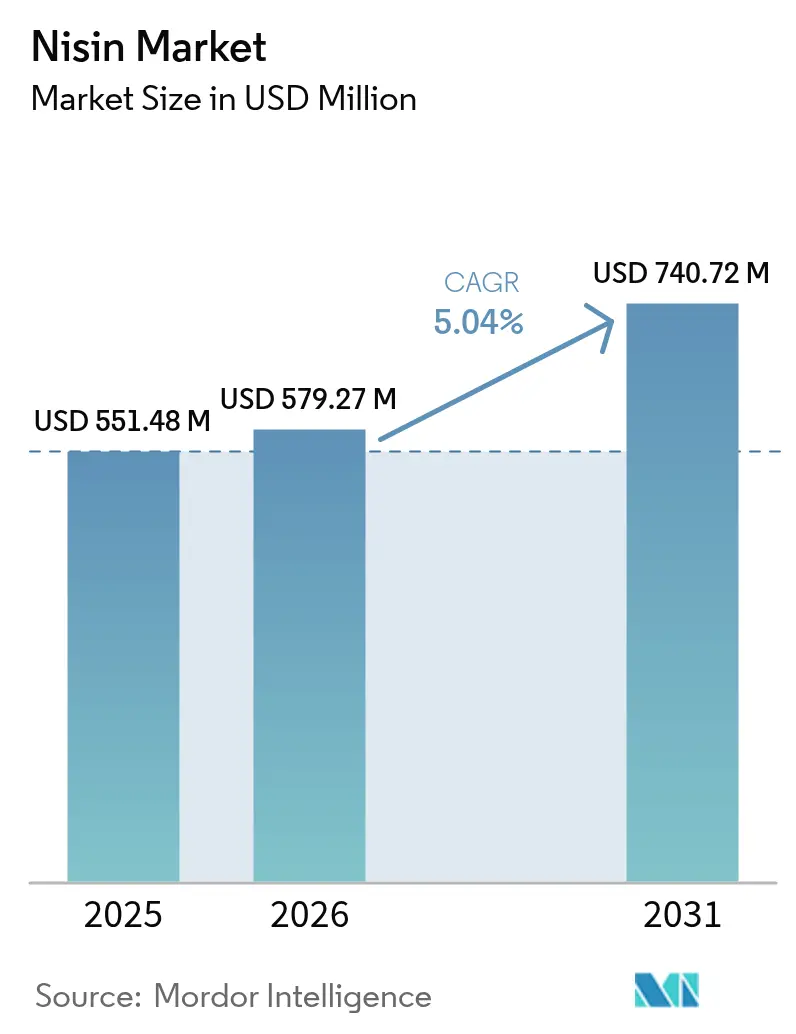
The global nisin market size was valued at USD 551.48 million in 2025 and estimated to grow from USD 579.27 million in 2026 to reach USD 740.72 million by 2031, at a CAGR of 5.04% during the forecast period (2026-2031). This growth trajectory reflects the increasing shift toward natural preservatives as food manufacturers respond to consumer demand for clean-label products. The rising concerns about foodborne pathogens and the growing recognition of nisin's effectiveness against antibiotic-resistant bacteria are creating new application avenues beyond traditional food preservation. Nisin's approval by the FDA as Generally Recognized as Safe (GRAS) since 1988 has established a strong regulatory foundation for market expansion. The market is witnessing a paradigm shift as nisin applications extend beyond traditional food preservation into pharmaceuticals, cosmetics, and animal feed. The antimicrobial peptide's potential in combating antibiotic resistance and its emerging applications in therapeutic areas are opening new revenue streams for market players. The World Health Organization's recognition of antimicrobial resistance as one of the top global public health threats has accelerated interest in natural antimicrobials like nisin as alternatives to conventional antibiotics [1]Source: World Health Organization, “Antimicrobial Resistance,” who.int.
Key Report Takeaways
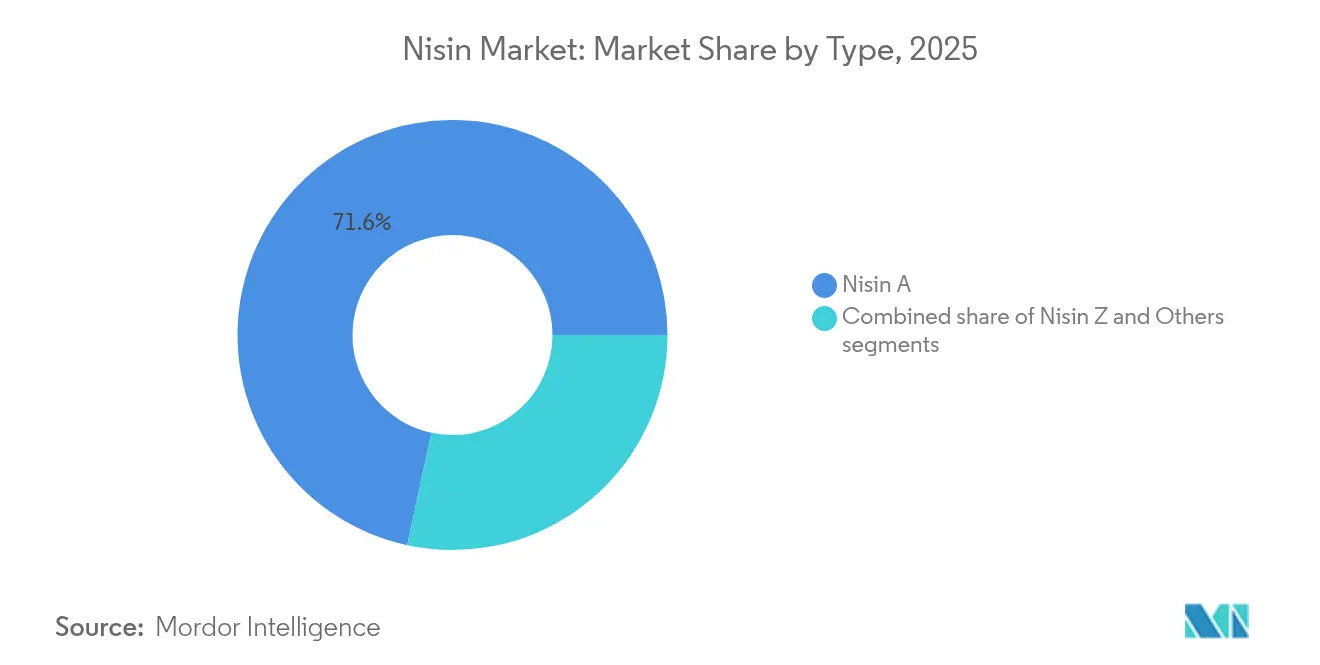
- By type, nisin A captured 71.62% nisin market share in 2025, and nisin Z is set to grow at 7.97% CAGR during 2026-2031.
- By form, powder held 83.94% revenue in 2025, liquid formulations are projected to advance at 7.78% CAGR through 2031.
- By application, food and beverages accounted for 78.58% of the Nisin market size in 2025, while nutraceuticals and pharmaceuticals are forecast to expand at 8.49% CAGR to 2031.
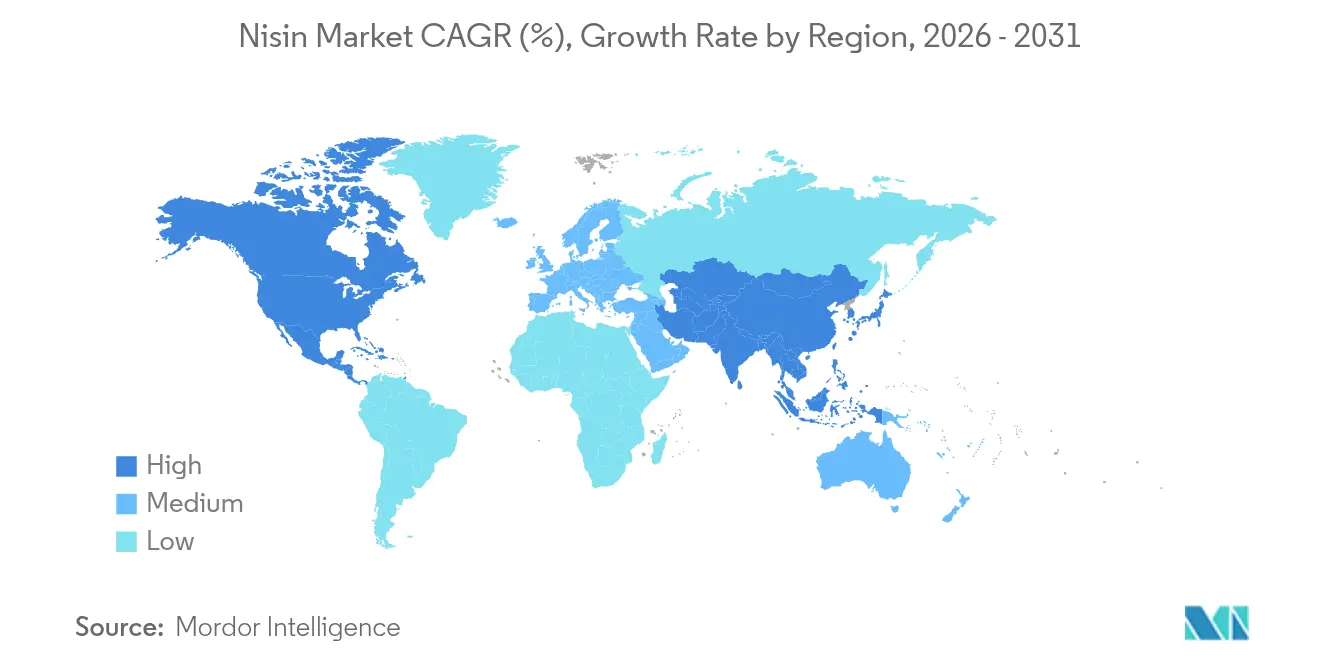
- By geography, North America led with 35.74% share in 2025; Asia-Pacific is poised for the quickest growth at 8.43% CAGR between 2026-2031.
Note: Market size and forecast figures in this report are generated using Mordor Intelligence’s proprietary estimation framework, updated with the latest available data and insights as of 2026.
Market Trends and Insights
Drivers Impact Analysis of Nisin Market*
| Drivers | (~) % Impact on CAGR Forecasts | Geographic Relevance | Impact Timeline |
|---|---|---|---|
| Rising consumer demand for clean-label and natural preservatives | +1.2% | Global, with stronger impact in North America and Europe | Medium term (2-4 years) |
| Rapid adoption of clean-label antimicrobials in meat processing | +1.0% | North America, Europe, emerging in Asia-Pacific | Short term (≤ 2 years) |
| Increasing consumption of packaged, processed, and frozen foods | +0.9% | Global, particularly strong in Asia-Pacific | Long term (≥ 4 years) |
| Growing application in craft breweries for preventing lactic acid bacteria spoilage | +0.7% | North America, Europe | Medium term (2-4 years) |
| Heightened awareness of foodborne pathogen risks | +0.6% | Global | Short term (≤ 2 years) |
| Increasing Use in Antimicrobial Packaging | +0.5% | North America, Europe, Japan | Medium term (2-4 years) |
| Source: Mordor Intelligence | |||
Rising Consumer Demand for Clean-Label and Natural Preservatives
The shift toward clean-label products is fundamentally restructuring preservation strategies across the food industry, with nisin emerging as a frontrunner in natural antimicrobial solutions. Consumer rejection of synthetic preservatives has accelerated, with regulatory bodies responding through updated guidance on natural preservative applications. The FDA's continued recognition of nisin as GRAS status provides manufacturers with regulatory certainty for clean-label formulations. The European Food Safety Authority (EFSA) has similarly maintained nisin's approval as food additive E234, reinforcing its acceptance in premium markets where clean-label positioning commands price premiums. This regulatory support is enabling food manufacturers to reformulate products while maintaining safety standards, driving sustained market growth across multiple food categories.
Rapid Adoption of Clean-Label Antimicrobials in Meat Processing
Meat processors are increasingly turning to nisin as a strategic solution to address both consumer clean-label demands and regulatory pressure to reduce synthetic preservatives. The United States Department of Agriculture's Food Safety and Inspection Service (FSIS) has recognized nisin's effectiveness against Listeria monocytogenes, a persistent challenge in ready-to-eat meat products, supporting its adoption in commercial meat processing [2]Source: U.S. Department of Agriculture Food Safety and Inspection Service, “Safe and Suitable Ingredients Used in the Production of Meat, Poultry, and Egg Products,” usda.gov. Recent innovations in encapsulation technology have overcome previous limitations of nisin in meat matrices, with research demonstrating enhanced stability and controlled release mechanisms. This technological advancement allows for reduced nitrite levels in processed meats while maintaining safety standards, addressing a key industry challenge. The meat industry's adoption of nisin represents a convergence of food safety imperatives, regulatory compliance, and consumer preferences, driving significant market growth in this application segment.
Increasing Consumption of Packaged, Processed, and Frozen Foods
The global surge in packaged and processed food consumption is creating unprecedented demand for effective natural preservatives, with nisin positioned as a key enabler of extended shelf life without synthetic additives. Urbanization and changing lifestyle patterns have accelerated the consumption of convenience foods, supported by government initiatives promoting food security and safety. The FAO's Codex Alimentarius Commission continues to evaluate and update international standards for nisin usage across various food categories, facilitating global trade and adoption. International standards provide manufacturers with standardized guidelines for nisin application, which simplifies regulatory compliance processes and documentation requirements for multinational food companies. The convergence of these standards with increasing consumer preference for natural preservatives, coupled with the growing awareness of food safety and shelf-life extension, supports continuous market growth across various food and beverage segments.
Growing Application in Craft Breweries for Preventing Lactic Acid Bacteria Spoilage
Craft breweries are emerging as a high-growth application segment for nisin, as these producers seek natural solutions to prevent beer spoilage without compromising their artisanal positioning. The craft beer industry faces unique preservation challenges due to limited pasteurization and filtration processes that maintain flavor complexity but increase spoilage risks. Scientific research published in peer-reviewed journals has demonstrated nisin's effectiveness against lactic acid bacteria, the primary spoilage organisms in beer, without affecting beneficial yeast cultures. This application is driving innovation in liquid nisin formulations specifically designed for beverage applications, with studies showing maintained beer quality for extended periods at ambient temperature. The brewing industry's adoption reflects a broader trend toward natural preservation methods in artisanal food and beverage production.
Restraints Impact Analysis of Nisin Market*
| Restraints | (~) % Impact on CAGR Forecasts | Geographic Relevance | Impact Timeline |
|---|---|---|---|
| Higher production costs compared to chemical preservatives | -0.8% | Global, particularly impacting emerging markets | Medium term (2-4 years) |
| Limited effectiveness in high-fat food applications | -0.7% | Global | Short term (≤ 2 years) |
| Regulatory restrictions varying by region | -0.5% | Primarily impacts international trade and global food companies | Medium term (2-4 years) |
| Increasing shift toward plant-based preservatives | -0.4% | North America, Europe | Long term (≥ 4 years) |
| Source: Mordor Intelligence | |||
Higher Production Costs Compared to Chemical Preservatives
The cost differential between nisin and synthetic preservatives remains a significant market constraint, particularly affecting adoption rates in price-sensitive segments and emerging markets. Production costs for nisin are substantially higher than common chemical preservatives, primarily due to complex fermentation processes and purification requirements. This cost barrier is most pronounced in low-margin food categories and developing markets where price sensitivity outweighs clean-label preferences. Academic research published in biotechnology journals continues to focus on optimizing fermentation conditions and developing more efficient purification techniques to reduce manufacturing costs. Despite ongoing research efforts, the price premium continues to limit market penetration in certain segments, creating a bifurcated market where nisin adoption correlates strongly with consumer purchasing power and product positioning.
Increasing Shift Toward Plant-Based Preservatives
The growing interest in plant-derived antimicrobials presents competitive pressure for nisin, particularly in markets where botanical extracts are perceived as more natural than microbial-derived preservatives. Consumer research indicates increasing preference for preservatives derived from recognizable plant sources, potentially limiting nisin's positioning advantages in certain market segments. Scientific literature published in food science journals documents the antimicrobial properties of various plant extracts, providing alternative options for manufacturers seeking natural preservation solutions. While plant-based preservatives often face their limitations in terms of stability, flavor impact, and regulatory approval, their growing availability creates competitive pressure for nisin in specific applications. This trend is most pronounced in premium and organic food segments where botanical ingredients command strong consumer preference.
*Our forecasts treat driver/restraint impacts as directional, not additive. The impact forecasts reflect baseline growth, mix effects, and variable interactions.
Nisin Market Segment Analysis
By Type:
Nisin A Dominates While Nisin Z AcceleratesNisin A currently commands 71.62% of the market share in 2025, establishing its dominance in food preservation applications due to its proven track record and extensive regulatory approvals across global markets. The segment benefits from established production methods and widespread acceptance across various food categories, particularly in dairy and meat products, where its antimicrobial efficacy against Gram-positive bacteria is well-documented. Meanwhile, nisin Z is emerging as the fastest-growing segment with a projected CAGR of 7.97% from 2026-2031, driven by its enhanced stability at higher pH levels and broader antimicrobial spectrum. Research published in antimicrobial journals has demonstrated nisin Z's superior performance in neutral pH environments, making it particularly valuable for applications in beverages and low-acid foods where traditional nisin A shows limited efficacy.
The "others" segment, comprising emerging nisin variants and bioengineered derivatives, is gaining attention for specialized applications requiring enhanced stability or broader antimicrobial activity. Ongoing bioengineering efforts focus on developing nisin derivatives with enhanced antimicrobial activity and stability, potentially reshaping the competitive landscape. The diversification of nisin variants reflects the market's evolution toward more specialized antimicrobial solutions tailored to specific application requirements and environmental conditions, supported by advances in protein engineering and fermentation technology.



By Form:
Powder Formulations Lead While Liquid Solutions Gain MomentumThe powder form dominates the nisin market with an 83.94% share in 2025, driven by its superior stability during storage and ease of incorporation into dry food ingredients. Food manufacturers prefer powder formulations for their extended shelf life and precise dosing capabilities in industrial processing environments, supported by established handling protocols and equipment compatibility across the food industry. The segment's dominance is reinforced by regulatory approvals that primarily reference powder formulations in permitted usage guidelines. Liquid nisin formulations are emerging as the fastest-growing segment with a projected CAGR of 7.78% from 2026-2031, fueled by their ease of incorporation into beverage systems and liquid food products.
Recent innovations in liquid stability have addressed previous limitations, expanding applications in ready-to-drink beverages and liquid dairy products. Encapsulated nisin represents a high-value niche within the market, offering targeted release mechanisms that enhance antimicrobial effectiveness in complex food matrices. The development of encapsulation technologies addresses traditional limitations of nisin in challenging food environments, enabling controlled release and protection from adverse interactions with food components. These technological advancements are gradually shifting the market toward more sophisticated delivery systems that overcome traditional limitations of nisin in complex food matrices, though adoption remains limited by higher costs and regulatory complexity.
By Application:
Food Preservation Dominates While Pharmaceuticals Expand RapidlyThe food and beverages segment commands 78.58% of the nisin market in 2025, with meat and dairy applications representing the largest subsegments due to nisin's proven efficacy against key foodborne pathogens. Within this segment, processed meat products represent a particularly high-growth application due to nisin's effectiveness against Listeria monocytogenes, as recognized by food safety authorities, including the USDA FSIS. Dairy applications benefit from nisin's stability during pasteurization and its compatibility with starter cultures in fermented products, supported by extensive research published in dairy science journals. Beverage applications are expanding rapidly, particularly in alcoholic beverages, where nisin provides an effective natural solution for preventing spoilage by lactic acid bacteria without heat treatment. The canned and frozen foods subsegment is experiencing growth driven by the increasing demand for natural preservation in shelf-stable products.
The nutraceutical and pharmaceutical segment is projected to grow at the highest CAGR of 8.49% from 2026-2031, driven by emerging applications in drug delivery, antimicrobial resistance, and potential therapeutic uses. The animal feed segment is gaining traction as a natural growth promoter and alternative to antibiotics in livestock production, supported by research demonstrating improved feed conversion ratios and beneficial modulation of gut microbiota. The cosmetics and personal care segment represents an emerging application area where nisin's antimicrobial properties offer natural preservation alternatives to synthetic preservatives, though regulatory pathways for cosmetic applications vary significantly by region.

Geography Analysis
North America Nisin Market
North America leads the nisin market with a 35.74% share in 2025, driven by stringent food safety regulations and the strong consumer preference for clean-label products. The USDA's support for natural antimicrobials in meat processing has further accelerated adoption in processed meat applications, where nisin's effectiveness against Listeria monocytogenes addresses critical food safety concerns. The craft brewing industry represents a particularly high-growth application segment in North America, with breweries increasingly turning to nisin as a natural solution for preventing beer spoilage without compromising product positioning. Canada's Health Canada has similarly approved nisin for food applications, supporting regional market integration and cross-border trade in nisin-preserved products.
APAC Nisin Market
Asia-Pacific is positioned as the fastest-growing region with a projected CAGR of 8.43% from 2026-2031, driven by rapid industrialization of food processing, increasing disposable income, and growing awareness of food safety. China is emerging as a key growth market, with the National Health Commission accepting nisin for public comments in July 2024 as part of an accelerated approval process for food additives, CIRS. Japan's Ministry of Health, Labour and Welfare has approved nisin for specific food applications, supporting market development in high-value processed foods. The region's expanding middle class is driving demand for packaged and processed foods with clean-label ingredients, creating favorable conditions for nisin adoption. India's Food Safety and Standards Authority (FSSAI) continues evaluating expanded nisin applications, potentially opening significant market opportunities in the world's most populous country.
EMEA and South America Nisin Market
Europe maintains a significant market share, supported by the European Food Safety Authority's (EFSA)approval of nisin as a food additive E234 with specific usage guidelines across various food categories .The region's focus on sustainable food production aligns with nisin's natural origin, driving adoption particularly in premium and organic food segments where regulatory standards are most stringent. The European Commission's Farm to Fork Strategy, emphasizing reduced chemical inputs in food production, creates additional momentum for natural preservatives like nisin. South America and the Middle East and Africa regions represent emerging markets with growing potential, particularly in dairy and meat applications, where food safety concerns are driving interest in effective natural preservatives.

Regulatory Landscape
Nisin has a mature, multi-jurisdiction regulatory footing in food, but permitted uses remain highly category- and country-specific. In the United States, the FDA affirms nisin as Generally Recognized as Safe (GRAS) under 21 CFR 184.1538 for use as an antimicrobial agent in defined pasteurized cheese applications under good manufacturing practice (GMP). For national meat processing use, USDA FSIS suitability determinations and labeling requirements apply for meat and poultry products.
In the European Union, nisin is authorized as food additive E234 with specific maximum use levels by food category. This reinforces the need for formulation-by-category compliance for multinational food producers.
Value Chain Analysis
The nisin value chain starts with upstream fermentation inputs and process aids, then moves to specialized bioprocess manufacturing based on pure-culture fermentation of Lactococcus lactis subsp. lactis. Producers run controlled fermentations in nutrient media (often dairy-derived substrates), followed by recovery and purification steps such as concentration (for example, membrane filtration), precipitation or salting out, and spray-drying to produce standardized powders.
Commercial nisin preparations are typically blended to defined activity specifications (commonly expressed in IU/mg). Quality control is aligned with JECFA specifications and regional additive frameworks, including FDA and EU food additive requirements, so regulatory documentation and analytical testing sit at the center of supply readiness.
Competitive Landscape
The market is moderately fragmented. Multinational corporations and emerging regional players alike are vying for a slice of the nisin market, which is witnessing moderate consolidation. This surge in competition is largely fueled by a growing demand for natural food preservatives, a trend propelled by health-conscious consumers and regulatory shifts favoring clean-label ingredients.
Market leaders such as DSM-Firmenich, International Flavors and Fragrances Inc., Galactic, Siveele B.V., Cayman Chemical, and Shandong Freda Biotechnology, among others, command substantial market shares. Their dominance is attributed to robust brand reputations, vast distribution networks, and adherence to rigorous regional regulatory standards. Moreover, these firms pour substantial resources into research, crafting advanced nisin formulations. These innovations not only boost stability and efficacy but also broaden applicability across various food matrices, from processed meats to dairy.
Established players dominate the competitive landscape, utilizing their scale, technological prowess, and regulatory know-how. In contrast, nimble emerging companies are carving out market share through specialized product offerings and innovative strategies. As global demand surges, the market sees a notable uptick in investments aimed at bolstering production capacities.
Nisin Industry Leaders
DSM-Firmenich
International Flavors and Fragrances Inc.
Galactic S.A.
Shandong Freda Biotechnology
Cayman Chemical
- *Disclaimer: Major Players sorted in no particular order
Nisin Market Companies Covered in this Report
- DSM-Firmenich
- International Flavors and Fragrances Inc.
- Galactic S.A.
- Shandong Freda Biotech
- Siveele B.V.
- Handary S.A.
- Luoyang Chihon Biotechnology Co., Ltd
- Cayman Chemical
- Mayasan Biotech
- Amtech Biotech
- Jeneil Biotech Inc
- Merck KGaA
- Zhejiang Silver-Elephant Bio-Eng.
- Sacco System
- Zhengzhou Bainafo Bioengineering Co., Ltd
- PT Sentra Food Indonesia Tbk (Kemfood)
- Hi-Media Laboratories
- Hebei Shengxue Dacheng Pharmaceutical Co., Ltd
- Hefei Senotech New Materials Co., Ltd.
- Yota Bio-Engineering Co., Ltd.

Market Opportunities and Future Outlook
Near-term opportunities concentrate in regulated category expansions and reformulation programs where nisin directly substitutes or reduces synthetic preservatives while maintaining food safety outcomes. A concrete example is the extension of authorized use into egg-white products in Canada, where Health Canada updated the List of Permitted Preservatives to allow nisin in egg-white wraps with a defined maximum use level. For suppliers, this kind of permission-by-product pathway can serve as a practical template when supporting new customer qualifications for liquid egg and adjacent prepared-food formats.
Beyond Canada, similar category-by-category approvals show up as more granular permissions that specify food-product pairings and maximum levels. That, in turn, raises demand for technical dossiers and country-specific labeling support, and creates room for suppliers that can package regulatory, analytical, and application assistance alongside ingredient supply.
Recent Industry Developments in Nisin Market
- June 2026: A leading global ingredients company completed validation for a new pilot-scale fermentation facility dedicated to nisin production, enabling higher output and improved lifecycle stability. The project supports supply resilience for regulated categories in dairy and meat segments, aligning with customer qualification programs and regulatory adherence efforts.
- May 2026: A major dairy ingredients supplier announced a strategic collaboration with a fermentation technology firm to co-develop encapsulated nisin formulations for beverages and structured foods, expanding end-use formats and supporting shelf-life improvements in non-dairy matrices. The collaboration highlights a push toward alternative delivery formats and integrated regulatory dossiers.
- April 2026: A global food ingredients company expanded its nisin production capacity by upgrading a fermentation line, aiming to meet rising demand from regulated category expansions in North America and Europe. The upgrade supports more consistent activity levels and faster response to customer qualification requirements in regulatory contexts.


Nisin Market Report Scope and Research Methodology
Market Definition and Coverage
For this methodology, the market covers revenue earned from nisin (a natural antimicrobial ingredient) sold for use as a preservative or shelf life extender across commercial end uses.
Scope exclusions: This sizing excludes adjacent preservatives and blends where nisin is not the primary active, and it also excludes downstream finished food sales values.
Segments Covered in This Report
- By Type
- Nisin A
- Nisin Z
- Others
- By Form
- Powder
- Liquid
- Encapsulated
- By Application
- Food and Beverages
- Meat and Poultry Products
- Dairy Products
- Beverages
- Bakery and Confectionery
- Canned and Frozen Foods
- Other Food and Beverages
- Animal Feed and Pet Food
- Nutraceutical and Pharmaceuticals
- Cosmetics and Personal Care
- Food and Beverages
- By Geography
- North America
- United States
- Canada
- Mexico
- Rest of North America
- Europe
- Germany
- United Kingdom
- Italy
- France
- Spain
- Netherlands
- Rest of Europe
- Asia-Pacific
- China
- India
- Japan
- Australia
- Rest of Asia-Pacific
- South America
- Brazil
- Argentina
- Rest of South America
- Middle East and Africa
- South Africa
- Saudi Arabia
- United Arab Emirates
- Rest of Middle East and Africa
- North America
Data Sources, Market Sizing, and Validation
Desk Research
We started with desk research to set clear boundaries on what counts as nisin revenue and to build the first set of demand signals by region. Public references were reviewed to understand food additive rules, approved use levels, and trade flows that influence where nisin is permitted and how widely it is adopted.
Sources used included non-paywalled and official data points such as food additive and safety updates from regulators like the US FDA, scientific monographs and evaluations from bodies such as FAO and WHO programs, trade and tariff statistics published by UN Comtrade, agriculture and food processing indicators from sources such as the USDA, and selected peer reviewed journals covering bacteriocins and food preservation. Company filings, investor presentations, association pages, and reputed press were also checked. Paid subscriptions for company financials and patent databases were used only to improve completeness of company coverage and technology signals. The sources listed here are illustrative only, and many additional references were used for data collection, validation, and clarification during the study.
Primary Interviews and Surveys
Primary work was used to pressure test adoption patterns and pricing logic across key applications like dairy, meat, beverages, bakery, and canned foods, and then to confirm how demand changes with clean label and formulation shifts. We spoke with ingredient suppliers, distributors, food manufacturers, and technical experts across APAC, EMEA, and the Americas, so assumptions from desk research could be corrected and remaining gaps could be filled with how the market actually buys and specifies nisin.
Distribution of primary research fieldwork respondents
| Company type | Respondent position | Region |
|---|---|---|
| Top tier: 26% | CXOs: 17% | APAC: 40% |
| Mid tier: 56% | Functional/Unit leaders: 39% | EMEA: 33% |
| Smaller Players: 18% | Managers: 44% | Americas: 27% |
Market-Sizing & Forecasting
Sizing was built using a top-down demand pool, where food processing output and application level penetration assumptions were used to reconstruct the addressable nisin consumption by region, and then translated into value using typical price bands by grade and form. The totals were corroborated with selective bottom-up approximations, including sampled supplier revenue disclosures where available, channel checks on pricing, and volume to value conversions to keep the final number realistic.
Inputs that mattered most in this market included nisin usage rates in key categories (especially dairy and meat), the share of products reformulating toward clean label preservation, regional regulatory acceptance and labeling practices, import and export patterns for food additives, and observed price movements for fermentation based ingredients. For forecasting, scenario analysis was applied around penetration growth and pricing, and then aligned to expert expectations gathered in primary conversations so the curve does not assume an unrealistically smooth adoption path. Where direct volume or pricing signals were weak for a country or application, proxies were used first, and then narrowed through interview feedback until the implied spend matched what buyers and sellers described.
Data Validation & Update Cycle
Outputs were checked through triangulation across independent signals such as application consumption shares, regional trade direction, and pricing reasonableness against typical contract behavior. If a region showed a sudden jump that did not match food production trends or the interview inputs, the assumptions were reopened and the sensitive variables were recalibrated before review sign-off.
A multi step internal review was followed so definitions, conversions, and year alignment stayed consistent across the model. The report is refreshed annually, and interim updates are triggered when material events occur, such as major regulatory changes or sharp price shifts in fermentation based ingredients. Before delivery, a fresh pass on key assumptions is run so clients receive the most current view available at the time of publication.
Mordor Intelligence's Nisin Market Size Measured Against Other Published Estimates
It is normal to see different market values for nisin because researchers do not always count the same applications, they may pick different base years, and they often apply different pricing or adoption assumptions. Differences also show up when one study relies more on broad food preservative totals, while another tries to isolate nisin specific demand by application.
By tracking application level nisin penetration and refreshing price bands through primary checks, Mordor Intelligence keeps the estimate tied to where nisin is actually used in foods, rather than extending scope into broader antimicrobial ingredient baskets. Some publishers also choose a different starting year and then apply smoother growth curves, which can pull the current value up or down depending on how quickly they assume clean label reformulation happens and how they treat currency timing.
Benchmark comparison
| Source | Market Size | Gaps in Research Methodology |
|---|---|---|
| Mordor Intelligence | USD 579.27 M (2026) | |
| Global Consultancy A | USD 527.67 M (2024) | Uses an earlier base year and a broader scope that explicitly includes non-food end uses like pharmaceuticals and cosmetics, which changes both the starting level and the implied adoption path. |
| Industry Publisher B | USD 509.00 M (2024) | Anchors the market in 2024 and frames segmentation around type and form, which can apply different average prices and may not align penetration assumptions to food category output in the same way. |
The spread in published values is mainly explained by year alignment and what is counted as nisin demand, especially when non-food uses are included or when price progression is handled differently. With clear application mapping, traceable assumptions, and repeatable checks, the estimate stays practical for planning and can be updated cleanly as adoption and prices change.


Key Questions Answered in the Report
What is the projected value of the Nisin market by 2031?
The Nisin market is expected to reach USD 740.72 million by 2031, supported by a 5.04% CAGR.
Which region will expand the quickest in the forecast period?
Asia-Pacific is forecast to record the fastest CAGR at 8.43% between 2026 and 2031 as regulatory acceptance widens.
How are suppliers addressing nisin’s cost disadvantage versus chemical preservatives?
Investments in high-yield fermentation, process optimization, and capacity expansion aim to reduce unit costs, while encapsulation adds value in premium applications.
What new applications are fueling future growth beyond food preservation?
Rapid expansion is seen in nutraceuticals, pharmaceuticals, antimicrobial packaging, and animal feed as research validates nisin’s broader antimicrobial utility.
Page last updated on:


 Your data is secure and never sold or shared.


