Sweet Spread Market Size and Share
Market Overview
| Study Period | 2021 - 2031 |
|---|---|
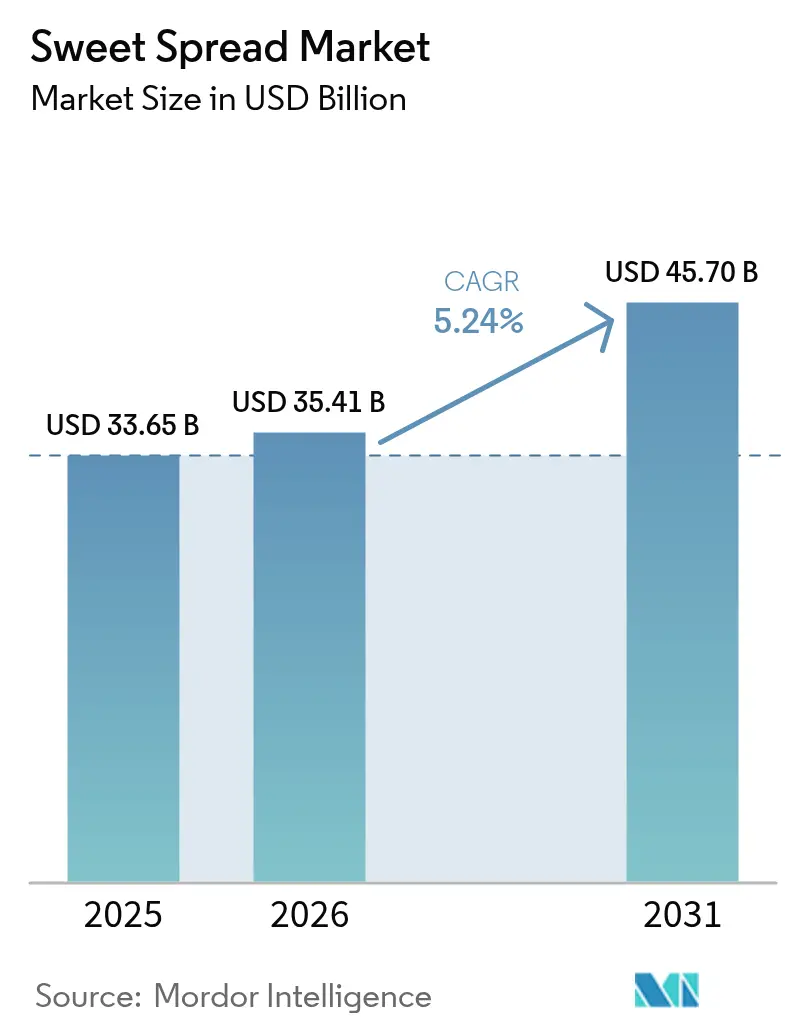
| Market Size (2026) | USD 35.41 Billion |
| Market Size (2031) | USD 45.7 Billion |
| Growth Rate (2026 - 2031) | 5.24% CAGR |
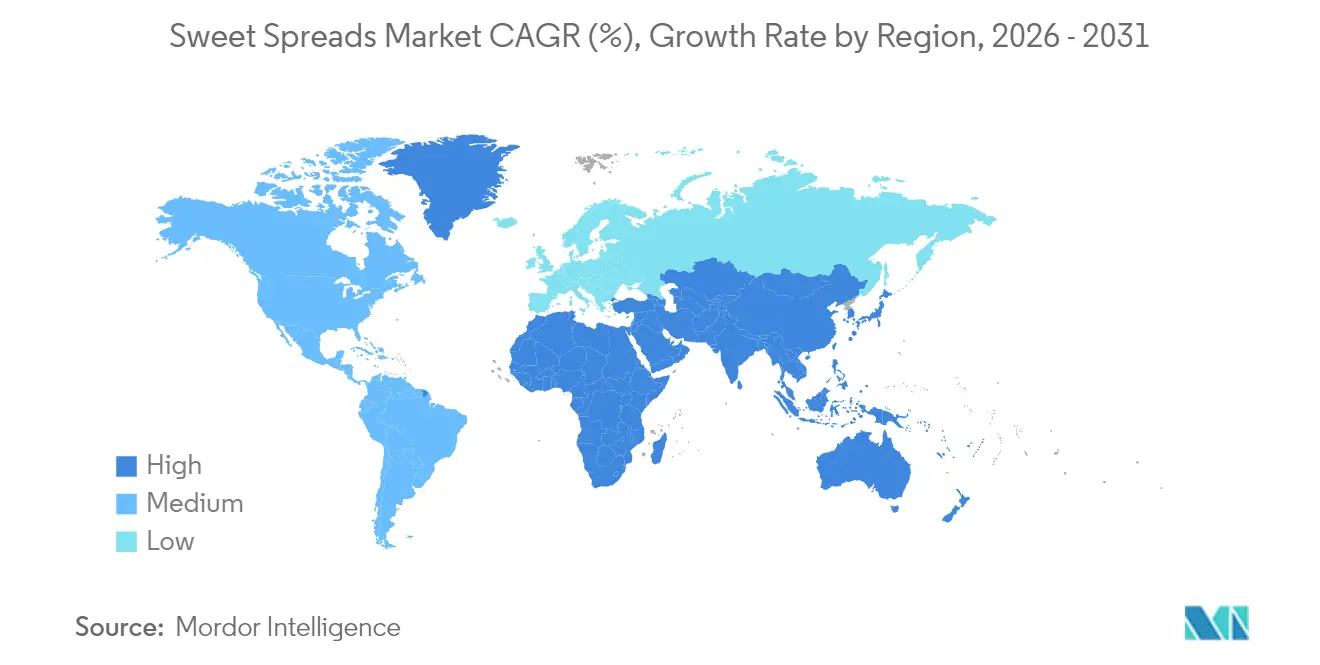
| Fastest Growing Market | Asia-Pacific |
| Largest Market | Europe |
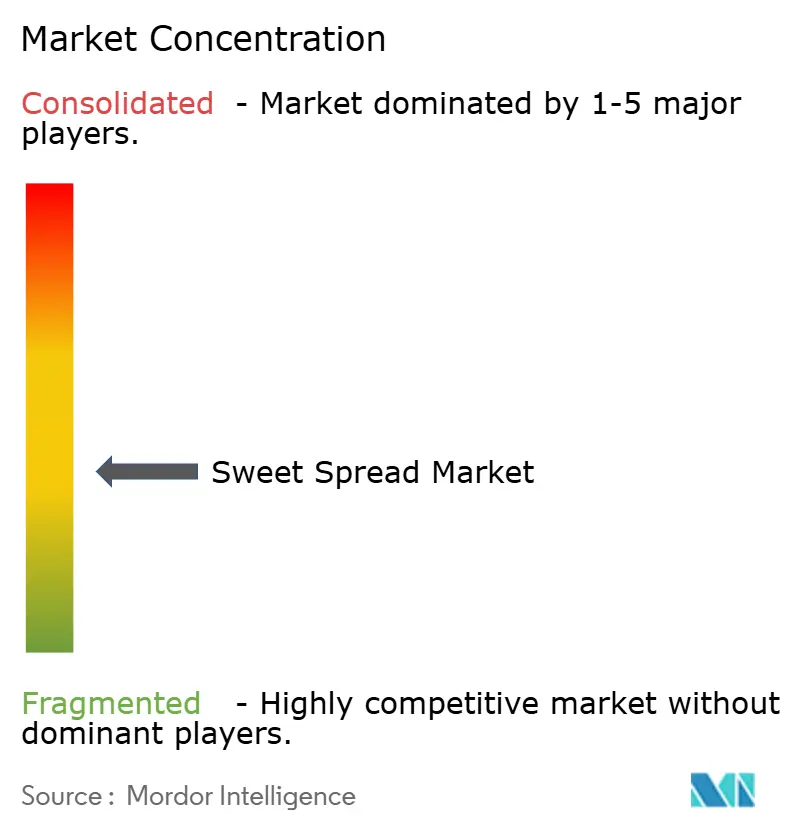
| Market Concentration | Medium |
Major Players
*Disclaimer: Major Players sorted in no particular order Image © Mordor Intelligence. Reuse requires attribution under CC BY 4.0. |
|
Sweet Spread Market Analysis by Mordor Intelligence
The sweet spreads market size was valued at USD 33.65 billion in 2025 and estimated to grow from USD 35.41 billion in 2026 to reach USD 45.7 billion by 2031, at a CAGR of 5.24% during the forecast period (2026-2031). The rising demand for products that combine indulgence with nutritional benefits is driving the popularity of honey-based, nut-based, and fruit-derived formulations. The Asia-Pacific region has the fastest market growth, fueled by increasing urbanization, the growing adoption of Western-style breakfast habits, and the rapid expansion of e-commerce platforms. In contrast, Europe, while being a mature market, remains the largest regional consumer. The region is witnessing a shift toward premium offerings and lower-sugar alternatives, reflecting changing consumer preferences. On a global scale, supermarkets continue to dominate in terms of volume; however, the rapid growth of online retail, with its double-digit CAGR, is significantly influencing merchandising strategies, packaging innovations, and channel dynamics within the sweet spreads market.
Key Report Takeaways
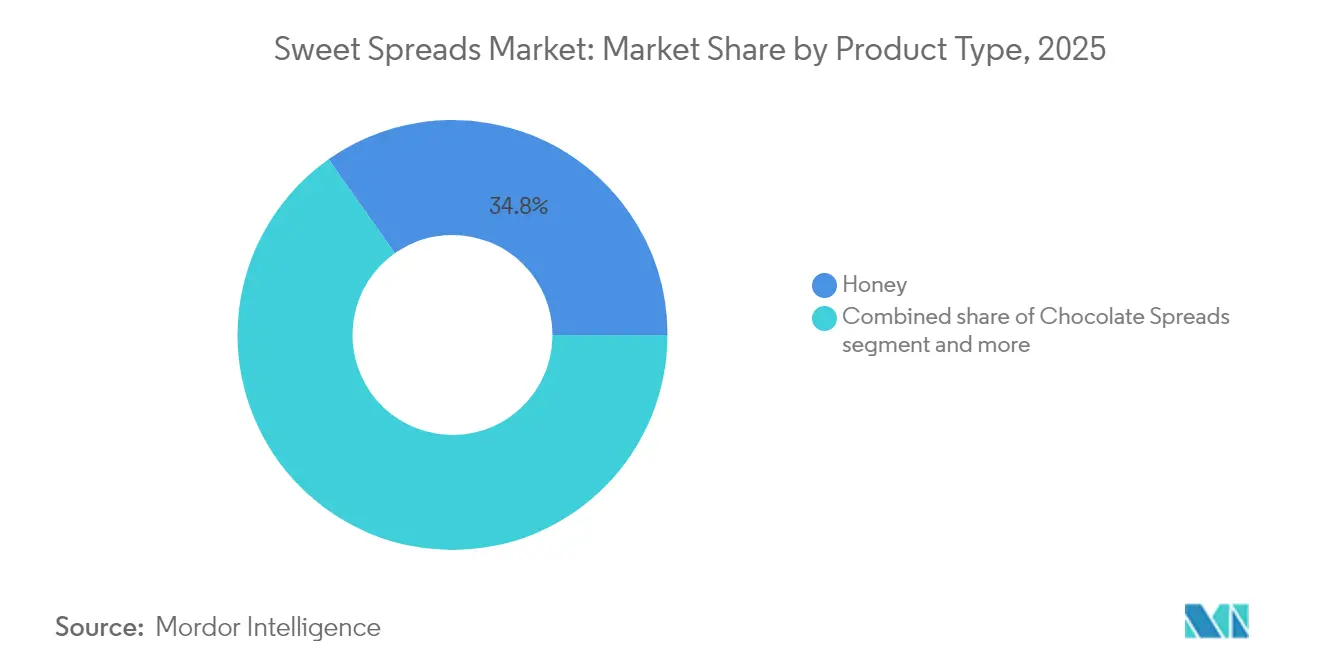
- By product type, honey held 34.78% of the sweet spreads market share in 2025 and is projected to expand at a 7.01% CAGR through 2031.
- By nature, conventional products accounted for 70.52% of the sweet spreads market size in 2025, whereas organic variants are forecast to grow at an 7.88% CAGR to 2031.
- By packaging type, jars captured 61.33% of revenue in 2025, while sachets and pouches are set to post a 6.66% CAGR from 2026-2031.
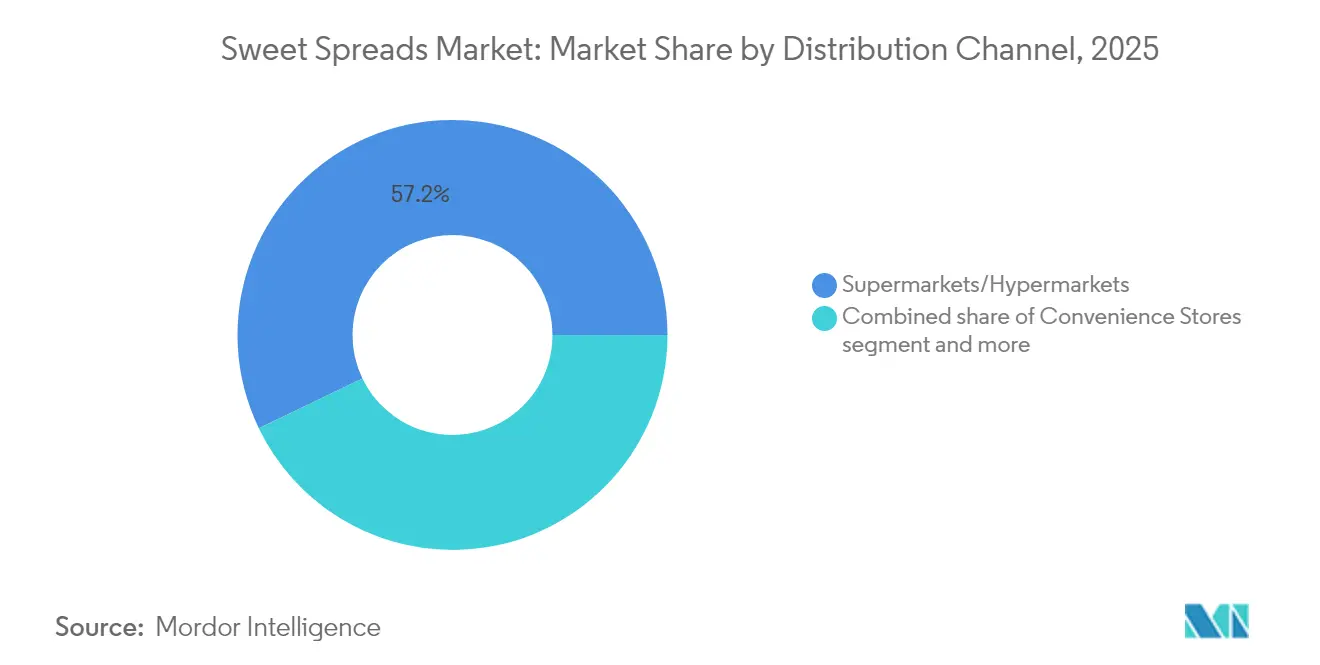
- By distribution channel, supermarkets and hypermarkets commanded 57.15% of sales in 2025, yet online retail is on course for an 11.32% CAGR through 2031.
- By region, Europe led with 31.68% of the sweet spreads market share in 2025; Asia-Pacific will outpace all regions at a 7.08% CAGR to 2031.
Note: Market size and forecast figures in this report are generated using Mordor Intelligence’s proprietary estimation framework, updated with the latest available data and insights as of 2026.
Global Sweet Spread Market Trends and Insights
Drivers Impact Analysis*
| Driver | (~) % Impact on CAGR Forecast | Geographic Relevance | Impact Timeline |
|---|---|---|---|
| Rising demand for convenient breakfast options | +1.2% | Global, with stronger impact in Asia-Pacific | Medium term (2-4 years) |
| Product innovations such as new flavors and health-focused variants attract diverse demographics | +1.1% | Global | Long term (≥ 4 years) |
| Growth of retail stores and online distribution channels improves spreads availability to consumers | +1.0% | Global, with stronger impact in Asia-Pacific | Medium term (2-4 years) |
| Increasing consumer preference for natural and organic ingredients | +0.9% | North America and Europe | Medium term (2-4 years) |
| Branding and marketing campaigns by companies | +0.6% | Global | Short term (≤ 2 years) |
| Adoption of western breakfast habits in developing countries | +0.8% | Asia-Pacific, Middle East and Africa | Long term (≥ 4 years) |
| Source: Mordor Intelligence | |||
Rising demand for convenient breakfast options
Modern lifestyles have turned breakfast into a quick, functional routine, driving growth in the sweet spreads market as consumers seek convenient, flavorful options. In urban areas, where time is limited, demand for ready-to-eat and easy-to-prepare solutions has surged. Sweet spreads appeal to singles and families due to their versatility and ease of use, extending beyond breakfast to snacking, baking, and desserts. Manufacturers have introduced innovations like portion-controlled packs, squeezable bottles, and single-serve sachets, supporting on-the-go consumption and reducing food waste. Healthier variants, such as low-sugar and organic options, have expanded the consumer base, meeting the demand for convenience, portability, and sustainability, and solidifying sweet spreads as a staple in today’s health-focused food industry.
Increasing consumer preference for natural and organic ingredients
Growing consumer skepticism toward artificial ingredients has driven a significant market shift toward natural and organic sweet spreads. This transition has given rise to a premium segment that achieves higher profit margins, even in a price-sensitive market. However, this trend extends beyond mere ingredient substitution, it reflects a broader reevaluation of consumer food values. Transparency in sourcing and minimal processing have emerged as critical factors influencing purchasing decisions. This shift is particularly prominent in honey and nut-based spreads, where consumers are increasingly attentive to sourcing practices and production methods. Brands that can substantiate their natural claims through transparent supply chains and credible third-party certifications are well-positioned to capitalize on this evolving demand, creating a competitive edge in the market.
Product innovations such as new flavors and health-focused variants attract diverse demographics
In the sweet spreads market, product innovation has shifted from simply adding new flavors to incorporating functional benefits that cater to specific nutritional needs. This shift has expanded the market's appeal to a wider demographic. By integrating superfoods, enhancing protein content, and formulating with less sugar, sweet spreads have transitioned from being seen solely as indulgent treats to being recognized as functional foods with tangible health benefits. This transformation is not only creating new occasions for use but also attracting consumer segments that traditional sweet spread marketing overlooked. Responding to the rising consumer demand for artisanal and small-batch products with unique flavors, the New York State Department of Agriculture and Markets has set forth guidelines for home processing of fruit jams and jellies [1]Source: Department of Agriculture and Markets, "Home Processing", agriculture.ny.gov. Furthermore, the "swicy" trend, melding sweet and spicy flavors, has gained momentum, with companies delving into bold innovations that fuse sweetness with heat for unique taste experiences.
Branding and marketing campaigns by companies
In the sweet spreads market, companies are adopting advanced branding strategies to gain a competitive edge. Emotional connections and lifestyle positioning now shape consumer preferences, often outweighing price-value considerations. Campaigns increasingly use "newstalgia," blending nostalgic comfort with modern innovation to meet consumer desires for familiarity and novelty. Digital platforms, especially social media, amplify these efforts by enabling immersive experiences, direct consumer engagement, and community building, extending brand influence beyond retail shelves. Additionally, brands focus on authentic storytelling and transparency to align with health-conscious consumers, building trust and meeting evolving demands.
Restraints Impact Analysis*
| Restraint | (~) % Impact on CAGR Forecast | Geographic Relevance | Impact Timeline |
|---|---|---|---|
| Rising concerns over sugar content and obesity discourage frequent consumption | -0.8% | Global, with stronger impact in North America and Europe | Long term (≥ 4 years) |
| Increasing raw material costs (e.g., nuts, cocoa) impact pricing and profit margins | -0.6% | Global | Medium term (2-4 years) |
| Growing competition from healthier alternatives like yogurt spreads restrains category | -0.5% | North America and Europe | Medium term (2-4 years) |
| Shorter shelf-life for natural and preservative-free products challenges supply chains | -0.4% | Global, with stronger impact in developing markets | Short term (≤ 2 years) |
| Source: Mordor Intelligence | |||
Rising concerns over sugar content and obesity discourage frequent consumption
Rising consumer awareness of sugar's health risks is challenging the traditional sweet spreads market. Manufacturers must balance taste with nutritional standards, while regulatory actions add pressure. For instance, Peru's front-of-package warning labels have driven reformulations, and Chile's Food Labelling Law cut 'high in' sugar sweet spreads from 58.0% to 13.7%, as per a BMC Medicine study. Adding to this momentum, the FDA's updated definition of "healthy" as a nutrient content claim, which will take effect in February 2025, introduces stricter criteria for products making health claims [2]Source: Food and Drug Administration, "Food Labeling: Nutrient Content Claims; Definition of Term 'Healthy'", federalregister.gov. This regulatory landscape is pushing manufacturers to adopt innovative sugar reduction strategies, such as incorporating natural sweeteners and reformulating products to retain their taste profiles while addressing growing health concerns.
Increasing raw material costs (e.g., nuts, cocoa) impact pricing and profit margins
Key sweet spread ingredients have seen volatile price swings, squeezing margins across the board. In response, manufacturers are turning to advanced procurement strategies and reformulating products to stay profitable. This challenge hits hardest for premium and organic variants. Here, consumer demand for authentic, high-quality formulations leaves little room for ingredient substitutions. Beyond just costs, these hurdles are steering innovation. Research and development are now more focused on crafting formulations that lean less on these volatile ingredients. For instance, Lindt & Sprüngli's 2024 annual report underscored the pinch of rising cocoa prices on its bottom line. In response, the company made strategic tweaks to safeguard its margins, all while keeping an eye on product development. Compounding these challenges are supply chain disruptions and climate impacts on agriculture, making raw material availability and pricing even more unstable for manufacturers.
*Our forecasts treat driver/restraint impacts as directional, not additive. The impact forecasts reflect baseline growth, mix effects, and variable interactions.
Segment Analysis
By Product Type: Honey Dominance and Growth Leadership
In 2025, the honey market held the largest share at 34.78% and was the fastest-growing segment, with a projected CAGR of 7.01% from 2026 to 2031. This growth reflects honey's role in meeting demand for natural sweeteners and functional foods. Its dominance stems from being a natural, minimally processed sweetener with health benefits, aligning with the clean-label trend. Honey's uses in cooking, baking, and remedies expand its market reach. Regulatory support, such as guidelines from the New York State Department of Agriculture and Markets, highlights the rising importance of natural sweeteners. Innovations like 'hot honey' further drive consumer interest and market growth.
The segment's growth is driven by awareness of honey's antioxidant and immune-supporting benefits. Innovations combining honey with natural ingredients create premium options for health-conscious consumers. Regulatory changes, like the FDA's focus on 'added sugars,' strengthen honey's position. Honey's role as a market leader and growth driver solidifies its importance in the natural sweetener market.


By Nature: Conventional Dominance Versus Organic Growth
In 2025, conventional sweet spreads dominate the market with a 70.52% share, driven by affordability and consumer familiarity. Competitive pricing and the reach of traditional retail channels make them the preferred choice for mainstream buyers. Manufacturers leverage economies of scale to keep prices low while investing in product innovations and marketing. Although the USDA highlights growing interest in organic products, conventional spreads remain dominant due to price sensitivity and established habits. They also serve as a platform for testing new flavors and formulations, aiding the development of premium variants.
The organic segment, however, is growing rapidly, with a projected CAGR of 7.88% from 2026 to 2031, outpacing conventional spreads. This growth is fueled by consumer demand for healthier, sustainable, and high-quality products. Adhering to strict production standards, organic spreads appeal to health-conscious buyers who value transparency. The USDA notes that despite economic challenges, a loyal consumer base supports organic products, driving demand. Expanding retail channels and increased awareness of organic benefits further bolster this growth.
By Distribution Channel: Supermarket Dominance Meets Digital Disruption
In 2025, supermarkets and hypermarkets dominate the distribution landscape, capturing a 57.15% share. Their success lies in showcasing diverse products and enticing impulse buys through savvy merchandising. With established ties to major manufacturers, supermarkets negotiate terms that ensure competitive pricing. Furthermore, they leverage prime shelf space for heightened product visibility and promotional activities, fueling category growth. Food Export USA's assessment underscores the pivotal role of supermarkets in Chile's retail food sector, emphasizing their market dominance and influence in product introductions .
Online retail is set to outpace all other distribution channels, boasting a projected CAGR of 11.32% from 2026 to 2031. This surge is attributed to the convenience, broader selections, and tailored shopping experiences it offers. The channel's ascent mirrors a shift in consumer habits, a trend hastened by the pandemic, as shoppers grow increasingly at ease with online food purchases. Online platforms excel in product discovery, owing to recommendation engines, and they provide access to specialty and premium items often absent from local shelves. Moreover, these platforms foster direct relationships with consumers, yielding invaluable data for refining products and marketing strategies.
By Packaging Type: Traditional Jars Lead While Convenience Formats Accelerate
In 2025, jars dominate the packaging market with a 61.33% share, driven by consumer familiarity and perceived value. Glass packaging protects products and allows visual quality assessment, while jars also aid in storage and portion control, making them a household staple. Established supply chains and cost-efficient production enable competitive pricing. As sustainability gains focus, manufacturers are adopting recyclable glass and reducing materials while maintaining product integrity.
Sachets and pouches are set to be the fastest-growing packaging format, with a projected CAGR of 6.66% from 2026 to 2031. This growth reflects a shift toward convenience and portion control, appealing to on-the-go and health-conscious consumers, especially younger demographics. Advances in flexible packaging technology enhance product protection and reduce material use, addressing functionality and sustainability. A report from the Australian Food and Beverage Accelerator highlights the importance of circular design and waste reduction, aligning with the efficiency of sachets and pouches.
Geography Analysis
In 2025, Europe leads the sweet spreads market with a 31.68% share, driven by established consumption habits and a refined retail network. Western Europe emphasizes quality and authenticity, supporting premium pricing. Despite market maturity, Europe is shifting towards premiumization and functional, plant-based variants. USDA data highlights strong demand for premium products, with Germany and France leading the organic market. Regulatory changes, including sugar content and nutritional labeling, are driving product reformulations, with front-of-package warning labels prompting significant adjustments. The region fosters innovation by blending traditional appeal with health and sustainability trends.
Asia-Pacific is set to drive the sweet spreads market growth, with a projected CAGR of 7.08% from 2026 to 2031, surpassing global rates. Growth is fueled by rising incomes, urbanization, and western breakfast trends in China and India. Diverse consumer preferences and market maturity require balancing affordability with premiumization. USDA forecasts India’s food processing sector to grow at a 15% CAGR, reaching USD 535 billion by 2025/26, driven by Tier-II and III cities. The Asian Development Bank's report on e-commerce in Asia-Pacific underscores the sustained momentum in online retail, offering digital opportunities for manufacturers.
North America remains a key market but faces maturity challenges. High per-capita consumption drives intense competition between established and emerging brands. Consumer preferences split between indulgent and health-focused options, creating diversification opportunities. In the U.S., nut-based spreads like peanut butter hold cultural significance, while health-centric alternatives gain traction. Regulatory changes, such as the FDA’s 'added sugars' label, push for transparency, influencing formulations and marketing. Trade agreements like the United States-Chile Free Trade Agreement, removing tariffs on agricultural goods, create export opportunities for U.S. manufacturers.

Competitive Landscape
The global sweet spreads market is moderately fragmented, featuring a diverse range of products such as jams, nut butters, honey, and chocolate spreads offered by both multinational giants and regional players. While companies like The Kraft Heinz Company, Ferrero International S.A., The J.M. Smucker Company, Mondelez International, Inc., and Andros Group lead in distribution and innovation, smaller niche and artisanal brands hold strong positions in local markets.
The growing demand for natural, low-sugar, and high-protein options is fueling product innovation, with low entry barriers allowing startups to meet evolving consumer needs, especially in health-focused, premium segments. In line with this trend, GOOD GOOD, a leader in no-added-sugar jams and spreads, entered the United Kingdom retail market for the first time in October 2024. Its Strawberry, Raspberry, Apricot, and Blackcurrant jams were launched at Holland & Barrett, offering wellness-conscious shoppers fruit-forward, naturally sweetened options with great taste and nutrition.
Digital technologies are reshaping competitive dynamics by enhancing consumer engagement, illustrated by Lindt & Sprüngli's 2024 launch of a generative AI chatbot for personalized shopping experiences. Emerging disruptors like MeliBio are challenging category conventions with plant-based honey alternatives, exemplified by its Spicy Habanero Plant-Based Hot Honey launch, which addresses growing consumer interest in vegan options.
Sweet Spread Industry Leaders
-
The Kraft Heinz Company
-
Ferrero International S.A.
-
The J.M. Smucker Company
-
Mondelez International, Inc.
-
Andros Group
- *Disclaimer: Major Players sorted in no particular order

Recent Industry Developments
- May 2025: Sowleil has expanded its product line with the launch of its new nut-free seed butter, crafted in Vancouver, B.C. According to the brand, the seed and tiger nut spreads are free from 11 allergens, including peanuts, tree nuts, dairy, gluten, soy, and sesame.
- May 2025: Pip & Nut has launched a new Chocolate Hazelnut Spread designed to compete with Nutella, offering a healthier alternative with less than one-sixth the sugar content. The spread aims to attract health-conscious consumers seeking lower-sugar options without sacrificing taste.
- May 2025: Ferrero launched Nutella Peanut, a new spread that combines Nutella’s signature hazelnut cocoa flavor with roasted peanuts, marking the brand’s first major flavor extension in over 60 years. With this launch, Ferrero aims to expand its presence in the U.S. spreads market by offering a dairy-free option that caters to American preferences for peanut-based spreads.
- March 2025: Hilltop Honey has launched Hilltoppers, a new range of spreadable honey in flavors like Sweet and Salty, Cocoa Honey, Chai Spiced, Whipped, and Pink, aiming to attract younger consumers to the category. Made from 100% natural ingredients and designed for easy spreading on toast, Hilltoppers offers a healthier, additive-free alternative to traditional spreads, according to the brand.


Research Methodology Framework and Report Scope
Market Definitions and Key Coverage
Our study defines the global sweet spread market as all packaged, shelf-stable edible spreads containing at least eight grams of sugar per 100 g, covering honey, jams and fruit preserves, chocolate pastes, nut and seed butters, malt or syrup-based spreads, and emerging plant-based sweet pastes. Valuation is expressed in manufacturer selling price after trade discounts and before retail mark-ups.
Scope exclusion: savory sandwich spreads, dairy cheese spreads, margarine, frosting, and artisan batches sold only through food service are deliberately left out.
Segmentation Overview
-
By Product Type
- Chocolate Spreads
- Honey
- Jam and Fruit Preserves
- Nut and Seed Based Spreads
- Malt and Syrup-based Spreads
- Others
-
By Nature
- Conventional
- Organic
-
By Packaging Type
- Jars
- Tubs
- Sachets/Pouches
- Others
-
By Distribution Channel
- Supermarkets/Hypermarkets
- Convenience Stores
- Online Retail Stores
- Other Distribution Channels
-
By Geography
-
North America
- United States
- Canada
- Mexico
- Rest of North America
-
Europe
- Germany
- United Kingdom
- Italy
- France
- Spain
- Netherlands
- Poland
- Belgium
- Sweden
- Rest of Europe
-
Asia-Pacific
- China
- India
- Japan
- Australia
- Indonesia
- South Korea
- Thailand
- Singapore
- Rest of Asia-Pacific
-
South America
- Brazil
- Argentina
- Colombia
- Chile
- Peru
- Rest of South America
-
Middle East and Africa
- South Africa
- Saudi Arabia
- United Arab Emirates
- Nigeria
- Egypt
- Morocco
- Turkey
- Rest of Middle East and Africa
-
North America
Detailed Research Methodology and Data Validation
Primary Research
Our team held interviews with ingredient suppliers, packaging converters, supermarket category buyers across Europe, Asia, and North America, and nutritionists tracking breakfast habits. These conversations refined consumption elasticity, validated online penetration assumptions, and flagged early regulatory moves on sugar limits.
Desk Research
First, Mordor analysts screened open sources such as UN Comtrade shipment codes, FAO honey output tables, USDA Fruit Market News, Eurostat household spend panels, and national customs dashboards to map physical volumes and trade flows. These volumes were matched with price corridors pulled from industry association bulletins and quarterly filings of leading spread companies to anchor average selling prices.
Next, we tapped D&B Hoovers for company splits, Dow Jones Factiva for price-sensitive events, and Questel for flavor-innovation patents, while retail scanner briefs and government nutrition surveys helped spot category mix shifts. The sources named illustrate the breadth of inputs; many additional records were reviewed before figures were locked.
The sources named illustrate the breadth of inputs; many additional records were reviewed before figures were locked.
Market-Sizing & Forecasting
A top-down build starts with country retail sales reported by statistics bureaus, reconstructed where missing through honey production plus import-export netting, then adjusted with penetration-rate demand pools for chocolate and nut spreads. Select bottom-up checks, sampled supplier revenues and e-commerce channel audits, ground truth the totals before calibration. Key variables include per-capita bread intake, median pack price, honey yield trends, online share of grocery, and disposable income growth.
Forecasts rely on an ARIMA model enriched with scenario overlays from expert consensus on sugar taxes and flavor innovation. Regional proxies fill data gaps, which are flagged for the next survey wave.
Data Validation & Update Cycle
Outputs pass variance screens, peer review, and senior sign-off. We compare totals with import duty receipts, scan for outlier CAGR swings, and reconnect with contacts when deviations exceed two standard deviations. Reports refresh annually, with unscheduled revisions after material events such as crop failures or major acquisitions.
Why Mordor's Sweet Spread Baseline Commands Reliability
Published values differ because firms select dissimilar product baskets, price markings, and refresh rhythms. By centering on manufacturer level value and harmonizing sugar-content criteria, Mordor Intelligence offers a steadier baseline that decision makers can trace and repeat.
Benchmark comparison
| Market Size | Anonymized source | Primary gap driver |
|---|---|---|
| USD 33.65 B (2025) | Mordor Intelligence | |
| USD 31.41 B (2025) | Regional Consultancy A | Excludes malt and syrup spreads, mixes retail and CPI factors |
| USD 11.00 B (2024) | Trade Journal B | Counts only jams, jellies, and honey, omits Asia and online-only brands |
The comparison shows that when scope and geography align, Mordor's disciplined variable selection and yearly refresh deliver the most balanced and reproducible view of the sweet spread opportunity.


Key Questions Answered in the Report
What is the current value of the sweet spreads market?
The sweet spreads market stands at USD 35.41 billion in 2026 and is projected to hit USD 45.7 billion by 2031.
How important is online retail to category growth?
Online retail is the fastest-expanding channel with an 11.32% CAGR outlook, reshaping assortment and marketing strategies.
What is driving premiumization in sweet spreads?
Rising demand for organic, clean-label, and functional formulations is steering consumers toward higher-priced, value-added spreads.
How are manufacturers addressing sugar-reduction pressures?
Companies use natural sweeteners, reformulate recipes, and adopt portion-controlled packaging to align with health regulations and consumer expectations.
Page last updated on:


